United States County-level COVID-19 Death Rates and Case Fatality Rates Vary by Region and Urban Status - MDPI
←
→
Page content transcription
If your browser does not render page correctly, please read the page content below
healthcare
Article
United States County-level COVID-19 Death Rates
and Case Fatality Rates Vary by Region and
Urban Status
Rashid Ahmed 1 , Mark Williamson 2, * , Muhammad Akhter Hamid 3 and Naila Ashraf 4
 1    College of Nursing, University of Manitoba, Winnipeg, MB R3T 2N2, Canada; Rashid.Ahmed@umanitoba.ca
 2    School of Nursing and Professional Disciplines, University of North Dakota, Grand Forks, ND 58202, USA
 3    Department of Pediatrics, University of Toronto, Toronto, ON M5S, Canada;
      Muhammad.Hamid@utoronto.ca
 4    Southend Medical and Walk-in Clinic, Winnipeg, MB R2M 5G8, Canada; nailamalik1980@yahoo.com
 *    Correspondence: Mark.Williamson.2@und.edu; Tel.: +1-701-777-4174

 Received: 3 August 2020; Accepted: 7 September 2020; Published: 9 September 2020

 Abstract: COVID-19 is a global pandemic with uncertain death rates. We examined county-level
 population morality rates (per 100,000) and case fatality rates by US region and rural-urban
 classification, while controlling for demographic, socioeconomic, and hospital variables. We found that
 population mortality rates and case fatality rates were significantly different across region, rural-urban
 classification, and their interaction. All significant comparisons had p < 0.001. Northeast counties had
 the highest population mortality rates (27.4) but had similar case fatality rates (5.9%) compared to
 other regions except the Southeast, which had significantly lower rates (4.1%). Population mortality
 rates were highest in urban counties but conversely, case fatality rates were highest in rural counties.
 Death rates in the Northeast were driven by urban areas (e.g., small, East Coast states), while case
 fatality rates tended to be highest in the most rural counties for all regions, especially the Southwest.
 However, on further inspection, high case fatality rate percentages in the Southwest, as well as in
 overall US counties, were driven by a low case number. This makes it hard to distinguish genuinely
 higher mortality or an artifact of a small sample size. In summary, coronavirus deaths are not
 homogenous across the United States but instead vary by region and population and highlight the
 importance of fine-scale analysis.

 Keywords: COVID-19; death rate; case fatality rate; county-level

1. Introduction
     Severe acute respiratory syndrome coronavirus 2 (SARS-CoV-2) is the viral agent of Coronavirus
Disease 2019 (COVID-19). Currently a global pandemic, it was first identified in Wuhan city,
Hubei province, China and has since spread worldwide. By March 2020, the daily new cases were higher
outside China than within [1]. By May 2020, over four million cases were reported across 187 countries [2].
The global case number has since passed 10 million, with almost 500,000 deaths. Furthermore, at the
time of writing, the United States has the leading number of cases, with almost 2.9 million confirmed
cases reported and over 130,000 deaths [3]. The Center for Disease Control and Prevention has reported
an even higher number of cases and deaths of 3,047,671 and 132,056, respectively.
     A variety of risk factors have been identified for COVID-19 infection and mortality. The most
important are older age and underlying health conditions [4]. There are also indications that males
face a higher mortality risk [5] and that members of ethnic minorities, especially Blacks, have higher
infection rates [6,7].

Healthcare 2020, 8, 330; doi:10.3390/healthcare8030330                        www.mdpi.com/journal/healthcare
Healthcare 2020, 8, 330                                                                              2 of 12

      The population mortality rate and the case-fatality rate are two important measures of disease
impact. The population mortality rate is the number of deaths from a disease within a specified time
adjusted by population size. Typically, this rate is multiplied by a set number, for example the mortality
rate per 100,000. The case fatality rate is the proportion of cases that are fatal within a specified time.
It may be underestimated because of a time-lag bias or overestimated because of case definition. As a
disease emerges, the case fatality rate is overestimated at the beginning, but drops as more information
is available. Overall, total cases are better than closed cases to express fatality rates [8].
      Early cases from China (December 2019–April 2020) were analyzed to determine a case fatality
rate of 5.65% for all China, with rates as high as 7.71% in Wuhan and as low as 0.86% in Hubei [9].
As of March 2020, the case fatality rate using total cases in China was 4% [8], while the May 2020
rate was 1.38% [10]. Outside China, the case fatality rate in Singapore, where contracting tracing and
quarantine was implemented, was 0.30% in March 2020. A May 2020 report from France found a
hospitalization rate of 3.6% and a population mortality rate of 0.7%, with mortality of up to 10.1%
in the oldest age groups (>80 years old) [11]. A study using data from the Diamond Princess cruise
ship provided one of the most robust case fatality rate estimates available because it was a contained
population with few confounding factors and ample testing for the whole population. Results found a
case fatality rate of 0.99%, though the older demographics do not represent the general population so
overall rates are likely to be lower [12]. For the United States, the John Hopkins Center reported a
gross case fatality rate of 4.8% in July 2020. A county-level study modeled the case fatality rate and
estimated it to be much lower, at 1.3%, with county-level variation from 0.5% to 3.6% [13].
      As the pandemic has continued, there has been an increased spread of COVID-19 infections into
rural areas [14]. This is an issue because rural populations are more vulnerable due to comorbidities
such as cancer, heart disease, diabetes, hypertension, and obesity [15,16]. Rural areas also have older age
structures, which is expected to increase the expected death rate [17]. These vulnerabilities, combined
with healthcare infrastructure shortfalls, make rural areas potentially high mortality areas [18]. A spatial
study found hotspots in COVID-19 incidence and mortality rates per 100,000 in both urban and rural
areas [19]. Another study found higher mortality rates per capita in rural, vulnerable counties compared
to diverse, urban counties [20].
      The United States is a large, heterogenous country with the most confirmed cases of COVID-19.
The scope of this study encompasses counties in the United States across both region and rural-urban
classifications. The United States can be broadly separated into five geographical regions, the Midwest,
Northeast, Southeast, Southwest, and West. Each county can be further classified by a rural-urban code
from 1 to 9. The most urban counties are classified as 1, the most rural as 9 (Supplemental Figure S1).
      It is important to understand the disease impact across different regions and populations.
Our research will learn more about the impact of COVID-19 by modeling mortality rates using
county-level data. Our main aim in this study is to determine the differences in COVID-19 death rates
across regions and rural-urban classifications using case and death number data from the New York
Times. We hypothesize that deaths per 100,000 will be higher on the East and West Coasts, as they
are densely populated and have some of the earliest reported US cases. We also predict that case
fatality rates will be no higher in urban areas compared to rural, because while rural areas may have
less access to health facilities, urban areas are more prone to being overwhelmed by cases, leading to
preventable deaths.

2. Materials and Methods

2.1. Data Collection
     Coronavirus case data at the county level were taken from a dataset created by the New York
Times based on reports from state and local health agencies [21]. The most recent cases and deaths
by county at the time of writing (23 June 2020) were used [21]. Rural-urban continuation codes from
2013 were obtained from the United States Department of Agriculture Economic Research Service [22].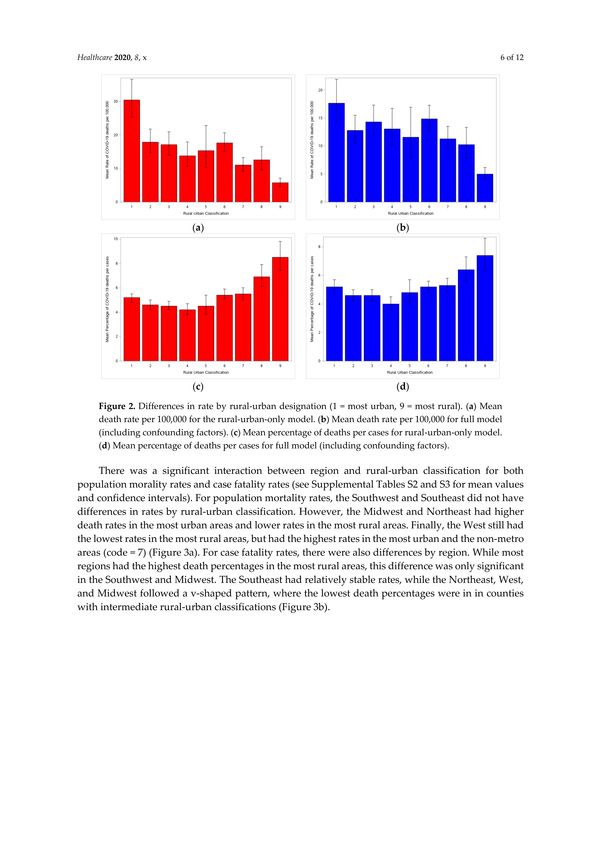
Healthcare 2020, 8, 330                                                                                                            3 of 12

Counties were classified into nine categories based on urban population and proximity to a metro
areas (1 being the most metro, 9 being completely rural and not adjacent to a metro area). States were
designated into one of five regions (Northeast, Midwest, West, Southwest, and Southeast). County-level
demographic, social, and economic data were obtained from the 2018 American Community Survey [23].
Variables that may affect coronavirus infection and mortality rates were retained as confounding
factors (Table 1). Sex ratio was the number of males per 100 females. Hospital bed data from Definitive
Healthcare was obtained through ESRI and condensed to the county level [24]. Bed utilization was the
proportion of total patient days over bed days available. All datasets were combined via FIPS county
code using a custom Python dataset. Counties that had missing data were not used. New York City
counties (Bronx, Kings, New York, Queens, and Richmond) were not individually available in the
dataset but rather, were aggregated as New York City.

      Table 1. Factors from the American Community Survey and Definitive Healthcare Hospital Beds data.

                             Total US          Midwest          Northeast         Southeast         Southwest               West
        Variable
                          Mean     Median   Mean     Median   Mean     Median   Mean     Median   Mean     Median   Mean      Median
     Demographic
       % White             83.1     89.7     91.4     94.7    85.3      91.2    74.8      78.8     81.3     83.5     83.9       89.8
       % Black              9.1      2.3      2.6      0.9     7.1       3.3    20.3      14.2      5.2      2.9      1.3        0.7
      % Hispanic            9.3      4.1     4.6       2.8    6.8        3.8     5.0       3.2    30.6      23.5     14.4       9.4
       Sex ratio          100.9     98.5    100.9     99.7    99.1      97.1    98.8      96.2    103.8     99.4    104.8      101.6
         Age               41.3     41.2    42.0      41.9    42.5      42.5    41.1      41.0    39.4      39.0     41.1      40.2
    Socioeconomic
      Family size           3.1      3.0     3.0      2.9       3.0      3.0      3.1      3.1      3.3      3.2     3.2        3.1
        Income            51,557   49,886   53,508   52,558   63,285   59,114   45,620   42,621   49,727   48,331   56,827    53,311
       % insured           89.9     90.8     92.2     93.3     94.0     94.5     89.1     89.2     83.9     84.3     89.3      90.5
     % in poverty          11.2     10.3     8.8      8.2       8.2      8.0     14.5     13.7     12.5     11.8     9.5        9.0
       Hospital
     Bed number           305.2     42.0    205.7     25.0    813.4    237.0    251.9     55.0    314.9     25.0    389.5      30.0
    Bed utilization        0.3       0.3     0.3       0.3     0.5      0.5      0.3       0.3     0.2       0.2     0.3        0.3
   Ventilator number       2.0       2.0     1.5       1.0     3.7      3.0      2.3      2.0      1.4       1.0     1.7       1.5

     The response (dependent) variables used were coronavirus population mortality rates per 100,000
and coronavirus case fatality rates. The county population mortality rate per 100,000 was calculated by
dividing the number of coronavirus deaths in the county by the county population (2010 US estimates)
and multiplying it by 100,000. The county case fatality rate was calculated by dividing the number of
coronavirus deaths in the county by the total number of county cases. After analysis, the proportions
were multiplied by 100 to present them as percentages. Counties with zero cases were excluded from
the analysis. The percentage of Whites, Blacks, and Hispanics, sex ratio, and age were all included as
confounding factors because previous studies have shown differences in infection and mortality rates
across ethnicity, sex, and age. Family size was included because larger families may be at greater risk
of exposure, while the percentage of those that were uninsured or in poverty were included because
those variables may impact on hospital access and care. The number of beds, bed utilization, and
ventilator numbers were included because hospitals overwhelmed by COVID-19 hospitalizations may
have had excess mortality rates.

2.2. Statistical Analysis
     First, null models were created for each of the two response variables, population mortality rate per
100,000 and case fatality rate. Each model included the response variable as a function of region alone
and rural-urban classification alone using a generalized linear model. A negative binomial distribution
was used for the population mortality rate models over a Poisson distribution [25], because the rate
data had a variance much higher than the mean, making the negative binomial a better fit [26,27].
A beta distribution was used for the case fatality rate models because the proportion data fit the range
of the beta distribution, 0 < x < 1.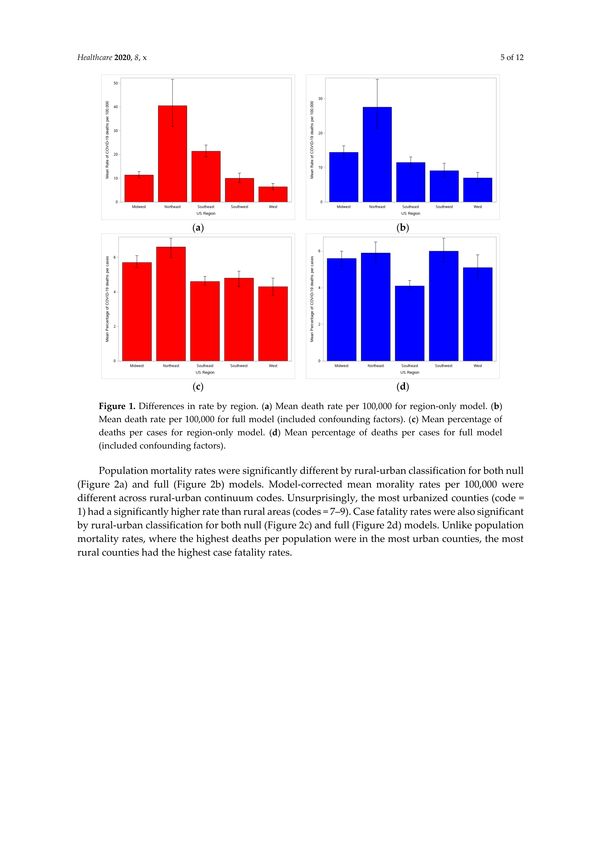
Healthcare 2020, 8, 330                                                                                               4 of 12

      Next, demographic and socioeconomic variables were selected for inclusion as confounding factors
in the population mortality rate models using stepwise model selection, a negative binomial distribution,
and AICc score as the selection method. Then, for the case fatality rate models, because there is no
appropriate model selection for a beta distribution, all confounding factors were included. Full models
for each of the sets of models were run using the appropriate factors and distribution. Resulting
least-square means for region and rural-urban classification were linked back to the data scale and
plotted accordingly. Furthermore, population mortality rate and case fatality rate were each modeled
as a function of the interaction of region and rural-urban classification by including the interaction term
in the model formula, along with the single terms and all confounding factors. Finally, county-level
population morality rates and case fatality rates were averaged by state and mapped by state and region.

3. Results
     County-level population mortality rates per 100,000 and case fatality rates from COVID-19
were significantly different by region (Table 2a) and rural-urban classification (Table 2b) for both
the null and full models (Supplemental Table S1). The full models had lower F-values and AICc
scores than the null models, indicating that the confounding variables explained some but not all
the variation. The interaction between region and rural-urban classification was also significant
(Supplemental Table S1).

                    Table 2. Rate estimates from final models across region and rural-urban code.

      a. Model-corrected mean mortality rate per 100,000 mean and case fatality rate percentage (CFR %) by US region.
                                            Confidence Intervals (CI) are 95%.
      Predictor Variable          Mean Mortality Rate per 100,000                           CFR %
          US Region           Estimate       Lower CI        Upper CI       Estimate       Lower CI       Upper CI
           Midwest               14.4           12.7           16.3           5.6%            5.2             6.0
          Northeast              27.5           21.3           35.6           5.9%            5.4             6.5
          Southeast              11.5           10.1           13.1           4.1%            3.9             4.1
          Southwest               9.1            7.3           11.3           6.0%            5.4             6.7
            West                  7.0            5.7            8.6           5.1%            4.5             5.8
    b. Model-corrected mean mortality rate per 100,000 mean and case fatality rate percentage (CFR %) by Rural-Urban
                                   Classification. Confidence Intervals (CI) are 95%.
      Predictor Variable          Mean Mortality Rate per 100,000                           CFR %
      Rural-Urban Code        Estimate       Lower CI        Upper CI       Estimate       Lower CI       Upper CI
               1                 17.7           14.2           21.9           5.2%            4.8             5.7
               2                 12.8           10.6           15.5           4.6%            4.2             5.0
               3                 14.3           11.8           17.3           4.6%            4.2             5.0
               4                 13.1           10.2           16.7           4.0%            3.6             4.5
               5                 11.6           7.9            17.0           4.8%            4.0             5.7
               6                 14.9           12.8           17.3           5.2%            4.8             5.6
               7                 11.3           9.5            13.5           5.3%            4.8             5.8
               8                 10.3           7.9            13.4           6.4%            5.6             7.3
               9                  5.0            4.0            6.2           7.4%            6.3            8.76).

      Population mortality rates were significantly different by region for both null (Figure 1a) and
full (Figure 1b) models. The Northeast had a significantly higher rate than all other regions and the
Midwest had a significantly higher rate than the Southwest and West. This pattern was expected given
the prevalence of coronavirus infections in East Coast states. Case fatality rates were also significant by
region for both null (Figure 1c) and full (Figure 1d) models. The Southeast had a significantly lower
rate than other regions.
Healthcare 2020, 8, 330 5 of 12
Figure 1. Differences in rate by region. (a) Mean death rate per 100,000 for region-only model. (b) Mean
death rate per 100,000 for full model (included confounding factors). (c) Mean percentage of deaths
per cases for region-only model. (d) Mean percentage of deaths per cases for full model (included
confounding factors).
Population mortality rates were significantly different by rural-urban classification for both null
(Figure 2a) and full (Figure 2b) models. Model-corrected mean morality rates per 100,000 were different
across rural-urban continuum codes. Unsurprisingly, the most urbanized counties (code = 1) had a
significantly higher rate than rural areas (codes = 7–9). Case fatality rates were also significant by
rural-urban classification for both null (Figure 2c) and full (Figure 2d) models. Unlike population
mortality rates, where the highest deaths per population were in the most urban counties, the most
rural counties had the highest case fatality rates.
There was a significant interaction between region and rural-urban classification for both
population morality rates and case fatality rates (see Supplemental Tables S2 and S3 for mean
values and confidence intervals). For population mortality rates, the Southwest and Southeast did
not have differences in rates by rural-urban classification. However, the Midwest and Northeast had
higher death rates in the most urban areas and lower rates in the most rural areas. Finally, the West
still had the lowest rates in the most rural areas, but had the highest rates in the most urban and the
non-metro areas (code = 7) (Figure 3a). For case fatality rates, there were also differences by region.
While most regions had the highest death percentages in the most rural areas, this difference was
only significant in the Southwest and Midwest. The Southeast had relatively stable rates, while the
Northeast, West, and Midwest followed a v-shaped pattern, where the lowest death percentages were
in in counties with intermediate rural-urban classifications (Figure 3b).Healthcare 2020, 8, 330 6 of 12
Figure 2. Differences in rate by rural-urban designation (1 = most urban, 9 = most rural). (a) Mean
death rate per 100,000 for the rural-urban-only model. (b) Mean death rate per 100,000 for full model
(including confounding factors). (c) Mean percentage of deaths per cases for rural-urban-only model.
(d) Mean percentage of deaths per cases for full model (including confounding factors).
Maps of population mortality rate and case fatality rate by state and region revealed that small
states in the Northeast (New Jersey, Massachusetts, and Connecticut) had both the highest mortality
rates and the highest case fatality rates. Western, Southwestern, and Midwestern states generally
had very low population mortality rates, with the exceptions of Arizona and the eastern Midwest
(Michigan, Indiana, Ohio), which had midrange rates (Figure 4a). Eastern Midwestern states also had
higher case fatality rates, along with Louisiana. Utah and Alaska had extremely low case fatality rates
(Figure 4b).Healthcare 2020, 8, 330 7 of 12
Figure 3. Differences in rates by the interaction between region and rural-urban designation (1 = most
urban, 9 = most rural). Models included confounding factors. (a) Mean death rate per 100,000. (b) Mean
percentage of deaths per cases.Healthcare 2020, 8, 330 8 of 12
Figure 4. State and Region maps. (a) Mean COVID-19 mortality rate per 100,000. (b) Mean Percentage
of COVID-19 deaths per case. Values were calculated by averaging county-level rates across each state.
Alaska and Hawaii are part of in the Western region and were moved and scaled to fit.
4. Discussion
4.1. Null versus Full Models
Based on the differences in the null and full models, demographic, socioeconomic, and hospital
variables had an impact on death rates that justified their inclusion as confounding factors. However,
there was an interesting shift between region and rural-urban classification. Population mortality rates
retained the same pattern between the null and full model, indicating that accounting for other factors
gave a similar result to region alone. In contrast, there was a significant difference in case fatality
rates between the two models. Considering region alone, the Northeast had the highest percentage of
deaths, followed by the Midwest. But adding in the other variables, all regions except the Southeast
were comparable, while the Southeast was significantly lower. It was unclear why. Examining the
means/medians for the confounding variables revealed that the Southeast had a higher percentage
of residents in poverty and Black residents. Correcting for these variables—higher rates of eachHealthcare 2020, 8, 330 9 of 12
are expected to contribute to higher mortality—may have had some effect despite there being little
difference between the null and full model. Other factors that could not be accounted for—such
as comorbidities, environmental conditions, or policy decisions—may be stronger contributors to
death rates.
For rural-urban classification, it was the case fatality rates that had the same pattern between
the null and full models, while there was a significant difference between models for the population
morality rates. The most urban counties still had the highest population mortality rates and the
most rural counties had the lowest between models, but classifications between the two (codes = 2–8)
were shifted up in the full model so that most were more comparable to the most urban counties.
Accounting for average ventilator usage, percentage of Black residents, percentage of insured residents,
and percentage of residents in poverty helped correct for the higher null rates found in the most
urban areas.
4.2. Population Mortality Rates
As hypothesized, the region with the highest population mortality rate was the Northeast,
though the same could not be said of the West. This is unsurprising, given that New York has the
highest number of COVID-19 deaths, with 24,172 excess deaths over the baseline in New York City
alone [28]. New Jersey, Massachusetts, Pennsylvania, and Connecticut also have fatality numbers
among the top ten by state. Despite the high number of deaths, the case fatality rate was comparable
to other regions except the Southeast, which had significantly lower death percentages. Looking at
the interaction with rural-urban classification, the Southeast had similar death percentages across
categories, while the rest of the regions had higher rates in more rural counties.
4.3. Case Fatality Rate
Contrary to our predictions, the case fatality rate by rural-urban classification was the highest
in the most rural counties rather than being the same across the rural-urban continuum. To explore
why there were such high death percentages in completely rural counties, we examined case and
death rates for completely rural Southwest counties in more detail (case = 9), as those counties had the
highest case fatality rates. These included 37 counties in New Mexico, Oklahoma, and Texas. For those
counties, the median case number was only 3.5, most counties had no deaths, and only five counties
had a recorded death. Of those, the deaths per case were as high as 50% because two counties had two
total cases and one death. Therefore, the high death percentage appeared skewed by low incidence.
Looking at all counties, the death percentage was 0.00% at the 75% quartile and below. The high death
percentages in rural areas appear to be driven by counties with few deaths and few cases.
4.4. State Maps
Mapping the population mortality rate and case fatality rate by state revealed more patterns.
The higher population mortality rates in the Northeast were driven more by New Jersey, Massachusetts,
and Connecticut than New York. Looking at New York by county revealed that while New York City
had very high rates, many of the more rural counties had low or no mortality rates.
The Southwest had the lowest case fatality rates in the covariate-corrected model, a pattern that
does not appear in the uncorrected map. Because the percentage of Blacks was a significant covariate,
the Southwest had a higher percentage of Blacks than other regions and Blacks have been shown to be
more susceptible to COVID-19 infection [6,29]. Correcting for the percentage of Black residents may be
a reason that the model-corrected case fatality rates were so low in the Southwest. As mentioned before
however, there still appears to be unexamined factors that are contributing to low regional death rates.
4.5. Other Factors
Given the regional distribution of mortality rates, there may be significant factors at work that were
not available for this analysis. Two possible environmental factors are air pollution and temperature.Healthcare 2020, 8, 330 10 of 12
Fine particulate matter was positively associated with COVID-19 death rates in a recent US study [30].
While that association corroborates with our findings that more urban counties have higher population
mortality rates, it does not account for the higher case fatality rates found in more rural counties.
A higher daily temperature range in January–February was positively associated with COVID-19
death rates in a study on Wuhan, China [31], while an average monthly high temperature in April
was negatively associated with COVID-19 death rates in a study of Western counties [32]. No pattern
seemed evident on the state maps regarding temperature, either positive or negative. The effect of
temperature is also likely to change across seasons. Policy decisions are also expected to influence
mortality rates. Some possible factors that were not included are: lockdown status, nursing home
policy, testing regiment, and mask mandates. Finally, there are immunological characteristics that may
lower certain populations’ susceptibility to COVID-19. Studies of the current pandemic and previous
ones suggests that this is likely [33,34].
5. Conclusions
This study had several limitations. First, the data was aggregated at the county level, so individual
metrics were not available. We do not know if the population that made up the cases and deaths
have the same demographics as the county-level population. Second, not all possible confounders of
importance—such as comorbidities, environmental differences, policy differences, or immunological
factors—were available. For example, counties that have residents with more health issues will
certainly have higher mortality rates. Third, it is known that there is a significant asymptomatic rate of
infection. The true death rate is impossible to measure from case fatality rate alone, as only reported
cases are counted. Finally, there were many counties that had few cases or deaths, mostly found in
rural areas of the Midwest and Southeast. This led to some counties having a very high or low case
fatality rate that was more a function of small sample size than actual factors that made it more or less
likely to die from a COVID-19 infection.
More work remains to be done to explain regional and rural–urban differences. As SARS-CoV-2
continues to spread through the most rural areas, a more accurate picture of the mortality rate and
case fatality rate will emerge. This will lead to a better understanding of how and where to allocate
resources to help vulnerable populations.
Supplementary Materials: The following are available online at http://www.mdpi.com/2227-9032/8/3/330/s1.
Figure S1: County-level maps, Table S1: Null and full model significance and fit statistics, Table S2: Population
mortality rate estimates for interaction model, Table S3: Case fatality rate estimates for interaction model.
Author Contributions: Methodology, investigation, formal analysis, and writing—original draft preparation,
M.W.; conceptualization, project administration, and writing—review and editing, R.A.; conceptualization, M.A.H.
and N.A. All authors have read and agreed to the published version of the manuscript.
Funding: This research study and the APC was funded through DaCCoTA by the National Institute of General
Medical Sciences of the National Institutes of Health, grant number U54GM128729.
Acknowledgments: The authors would like to thank Mbongowo Joseph Mbuh for his help on locating county-level
data sources.
Conflicts of Interest: The authors declare no conflict of interest.
References
1. Lai, C.C.; Wang, C.Y.; Wang, Y.H.; Hsueh, S.C.; Ko, W.C.; Hsueh, P.R. Global epidemiology of coronavirus
disease 2019 (COVID-19): Disease incidence, daily cumulative index, mortality, and their association with
country healthcare resources and economic status. Int. J. Antimicrob. Agents 2020, 55, 105946. [CrossRef]
[PubMed]
2. Chauhan, S. Comprehensive review of coronavirus disease 2019 (COVID-19). Biomed. J. 2020. [CrossRef]
[PubMed]
3. WHO. Coronavirus Disease (COVID-19) Situation Report 171; World Health Organization: Genevaa
Switzerland, 2020.Healthcare 2020, 8, 330 11 of 12
4. Gold, J.A.W.; Wong, K.K.; Szablewski, C.M.; Patel, P.R.; Rossow, J.; da Silva, J.; Natarajan, P.; Morris, S.B.
Characteristics and Clinical Outcomes of Adult Patients Hospitalized with COVID-19—Georgia, March 2020.
Morb. Mortal. Wkl. Rep. 2020, 69, 545–550. [CrossRef] [PubMed]
5. Suleyman, G.; Fadel, R.A.; Malette, K.M.; Hammond, C.; Abdulla, H.; Entz, A.; Demertzis, Z.; Hanna, Z.;
Failla, A.; Dagher, C.; et al. Clinical Characteristics and Morbidity Associated With Coronavirus Disease
2019 in a Series of Patients in Metropolitan Detroit. JAMA Netw. Open 2020, 3, e2012270. [CrossRef]
6. Price-Haywood, E.G.; Burton, J.; Fort, D.; Seoane, L. Hospitalization and Mortality among Black Patients and
White Patients with Covid-19. N. Engl. J. Med. 2020, 382, 2534–2543. [CrossRef] [PubMed]
7. Raisi-Estabragh, Z.; McCracken, C.; Bethell, M.S.; Cooper, J.; Cooper, C.; Caulfield, M.J.; Munroe, P.B.;
Harvey, N.C.; Petersen, S.E. Greater risk of severe COVID-19 in Black, Asian and Minority Ethnic populations
is not explained by cardiometabolic, socioeconomic or behavioural factors, or by 25(OH)-vitamin D status:
Study of 1326 cases from the UK Biobank. J. Public Health (Oxf.) 2020, 42, 451–460. [CrossRef] [PubMed]
8. Lan, L.; Xu, D.; Ye, G.; Xia, C.; Wang, S.; Li, Y.; Xu, H. Positive RT-PCR Test Results in Patients Recovered
From COVID-19. JAMA 2020, 323, 1502–1503. [CrossRef]
9. Deng, X.; Yang, J.; Wang, W.; Wang, X.; Zhou, J.; Chen, Z.; Li, J.; Chen, Y.; Yan, H.; Zhang, J.; et al. Case fatality
risk of the first pandemic wave of novel coronavirus disease 2019 (COVID-19) in China. Clin. Infect. Dis.
2020, in press. [CrossRef]
10. Verity, R.; Okell, L.C.; Dorigatti, I.; Winskill, P.; Whittaker, C.; Imai, N.; Cuomo-Dannenburg, G.; Thompson, H.;
Walker, P.G.T.; Fu, H.; et al. Estimates of the severity of coronavirus disease 2019: A model-based analysis.
Lancet Infect. Dis. 2020, 20, 669–677. [CrossRef]
11. Salj, H.; Kiem, C.T.; Lefrancq, N.; Courtejoie, N.; Bosetti, P.; Paireau, J.; Andronico, A.; Hoze, N.; Richet, J.;
Dubost, C.L.; et al. Estimating the burden of SARS-CoV-2 in France. Science 2020, 369, 208–211. [CrossRef]
12. Rajgor, D.D.; Lee, M.H.; Archuleta, S.; Bagdasarian, N.; Quek, S.C. The many estimates of the COVID-19 case
fatality rate. Lancet Infect. Dis. 2020, 20, 776–777. [CrossRef]
13. Basu, A. Estimating The Infection Fatality Rate Among Symptomatic COVID-19 Cases In The United States.
Health Aff. (Millwood) 2020, 39. [CrossRef] [PubMed]
14. Paul, R.; Arif, A.A.; Adeyemi, O.; Ghosh, S.; Han, D. Progression of COVID-19 From Urban to Rural Areas in
the United States: A Spatiotemporal Analysis of Prevalence Rates. J. Rural Health 2020. [CrossRef] [PubMed]
15. CDC. About Rural Health. 2017. Available online: https://www.cdc.gov/ruralhealth/about (accessed on
8 September 2020).
16. Souch, J.M.; Cossman, J.S. A Commentary on Rural-Urban Disparities in COVID-19 Testing Rates per 100,000
and Risk Factors. J. Rural Health 2020. [CrossRef] [PubMed]
17. Johnson, K.M. An Older Population Increases Estimated COVID-19 Death Rates in Rural America; University of
New Hampshire; Carsey School of Public Policy: Durham, NH, USA, 2020.
18. Lakhani, H.V.; Pillai, S.S.; Zehra, M.; Sharma, I.; Sodhi, K. Systematic Review of Clinical Insights into Novel
Coronavirus (CoVID-19) Pandemic: Persisting Challenges in U.S. Rural Population. Int J. Environ. Res.
Public Health 2020, 17, 4279. [CrossRef]
19. Zhang, C.H.; Schwartz, G.G. Spatial Disparities in Coronavirus Incidence and Mortality in the United States:
An Ecological Analysis as of May 2020. J. Rural Health 2020, 36, 433–445. [CrossRef]
20. Khan, S.; McCabe, M.; Krefman, A.; Petito, L.C.; Yang, X.; Kershaw, K.; Pool, L.; Allen, N.B. A County-Level
Susceptibility Index and Coronavirus Disease 2019 Mortality in the United States: A Socioecological Study.
medRxiv 2020. [CrossRef]
21. New York Times COVID-19 Data. Available online: https://github.com/nytimes/covid-19-data (accessed on
8 September 2020).
22. USDA Rural Urban Continuum Codes. Available online: https://www.ers.usda.gov/data-products/rural-
urban-continuum-codes.aspx (accessed on 8 September 2020).
23. American Community Survey. 2018. Available online: https://www.census.gov/programs-surveys/acs
(accessed on 8 September 2020).
24. Definitive Healthcare USA Hospital Beds. Available online: https://coronavirus-resources.esri.com/datasets/
definitivehc::definitive-healthcare-usa-hospital-beds?geometry=13.007%2C-16.820%2C-37.969%2C72.123
(accessed on 8 September 2020).
25. Sng, J.; Koh, D.; Siong, W.C.; Choo, T.B. Skin cancer trends among Asians living in Singapore from 1968 to
2006. J. Am. Acad. Dermatol. 2009, 61, 426–432. [CrossRef]Healthcare 2020, 8, 330 12 of 12
26. Lawless, J.F. Negative Binomial and Mixed Poisson Regression. Can. J. Stat. 1987, 15, 209–225. [CrossRef]
27. Hoef, J.M.V.; Boveng, P.L. Quasi-Poisson vs. Negative Binomial Regression: How Should We Model
Overdispersed Data? Ecology 2007, 88, 2766–2772. [CrossRef]
28. Olson, D.R.; Huynh, M.; Fine, A.; Baumgartner, J.; Castro, A.; Chan, H.T.; Daskalakis, D.; Devinney, K.;
Guerra, K.; Harper, S.; et al. Preliminary Estimate of Excess Mortality During the COVID-19 Outbreak—New
York City, 11 March–2 May. Morb. Mortal. Wkl. Rep. 2020, 69, 6303–6305.
29. Alsan, M.; Stantcheva, S.; Yang, D.; Cutler, D. Disparities in Coronavirus 2019 Reported Incidence, Knowledge,
and Behavior Among US Adults. JAMA Netw. Open 2020, 3, e2012403. [CrossRef]
30. Wu, X.; Nethery, R.C.; Sabath, B.M.; Braun, D.; Dominici, F. Exposure to air pollution and COVID-19 mortality
in the United States: A nationwide cross-sectional study. medRxiv. 2020. [CrossRef]
31. Ma, Y.; Zhao, Y.; Liu, J.; He, X.; Wang, B.; Fu, S.; Yan, J.; Niu, J.; Zhou, J.; Luo, B. Effects of temperature
variation and humidity on the death of COVID-19 in Wuhan, China. Sci. Total Environ. 2020, 724, 138226.
[CrossRef]
32. Benedetti, F.; Pachetti, M.; Marini, B.; Ippodrino, R.; Gallo, R.C.; Ciccozzi, M.; Zella, D. Inverse correlation
between average monthly high temperatures and COVID-19-related death rates in different geographical
areas. J. Transl. Med. 2020, 18, 251. [CrossRef] [PubMed]
33. Mathews, J.D.; McBryde, E.S.; McVernon, J.; Pallaghy, P.K.; McCaw, J.M. Prior immunity helps to explain
wave-like behaviour of pandemic influenza in 1918–9. BMC Infect. Dis. 2010, 10, 128. [CrossRef]
34. Le Bert, N.; Tan, A.T.; Kunasegaran, K.; Tham, C.Y.L.; Hafezi, M.; Chia, A.; Chng, M.H.Y.; Lin, M.; Tan, N.;
Linster, M.; et al. SARS-CoV-2-specific T cell immunity in cases of COVID-19 and SARS, and uninfected
controls. Nature 2020, 584, 457–462. [CrossRef] [PubMed]
© 2020 by the authors. Licensee MDPI, Basel, Switzerland. This article is an open access
article distributed under the terms and conditions of the Creative Commons Attribution
(CC BY) license (http://creativecommons.org/licenses/by/4.0/).You can also read