Ionization effect in the Earth's atmosphere during the sequence of October-November 2003 Halloween GLE events

Page created by Geraldine Mendez
 
CONTINUE READING
Ionization effect in the Earth's atmosphere during the sequence of October-November 2003 Halloween GLE events
Ionization effect in the Earth’s atmosphere during the
                                                     sequence of October-November 2003 Halloween GLE
                                                                               events
arXiv:2011.00048v1 [physics.space-ph] 30 Oct 2020

                                                                                  A.L. Mishev1,2 and P.I.Y. Velinov3
                                                      1 Space   Physics and Astronomy Research Unit, University of Oulu, Finland.
                                                            2 Sodankylä Geophysical Observatory, University of Oulu, Finland.
                                                    3 Institute for Space Research and Technology, Bulgarian Academy of Sciences,

                                                                                     Sofia, Bulgaria

                                                                                              November 3, 2020

                                                                                                     Abstract
                                                              The effect of precipitating high-energy particles on atmospheric physics and chemistry is
                                                          extensively studied over the last decade. In majority of the existing models, the precipitating
                                                          particles induced ionization plays an essential role. For such effects, it is necessary to possess
                                                          enhanced increase in ion production, specifically during the winter period. In this study, we
                                                          focus on highly penetrating particles - cosmic rays. The galactic cosmic rays are the main
                                                          source of ionization in the Earth’s stratosphere and troposphere. On the other hand, the
                                                          atmospheric ionization may be significantly enhanced during strong solar energetic particle
                                                          events, mainly over the polar caps. A specific interest is paid to the most energetic solar
                                                          proton events leading to counting rate enhancement of ground-based detectors, namely the
                                                          so-called ground level enhancements (GLEs). During solar cycle 23, several strong ground
                                                          level enhancements were observed. A sequence of three GLEs was observed in October-
                                                          November 2003, the Halloween events. Here, on the basis of 3-D Monte Carlo model, we
                                                          computed the energetic particles induced atmospheric ionization, explicitly considering the
                                                          contribution of cosmic rays with galactic and solar origin. The ion production rates were
                                                          computed as a function of the altitude above sea level using reconstructed solar energetic
                                                          particles spectra. The 24 hours and event averaged ionization effects relative to the average
                                                          due to galactic cosmic rays were also computed.
                                                       Keywords:Solar eruptive events, Ground level enhancement, Atmospheric ionization.
                                                       For contact: alexander.mishev@oulu.fi

                                                    1 Introduction
                                                    Various populations of precipitating high-energy particles and/or high-energy radiation contribute
                                                    to the atmospheric ionization viz. subatomic particles - cosmic rays of galactic or solar origin,

                                                                                                          1
Ionization effect in the Earth's atmosphere during the sequence of October-November 2003 Halloween GLE events
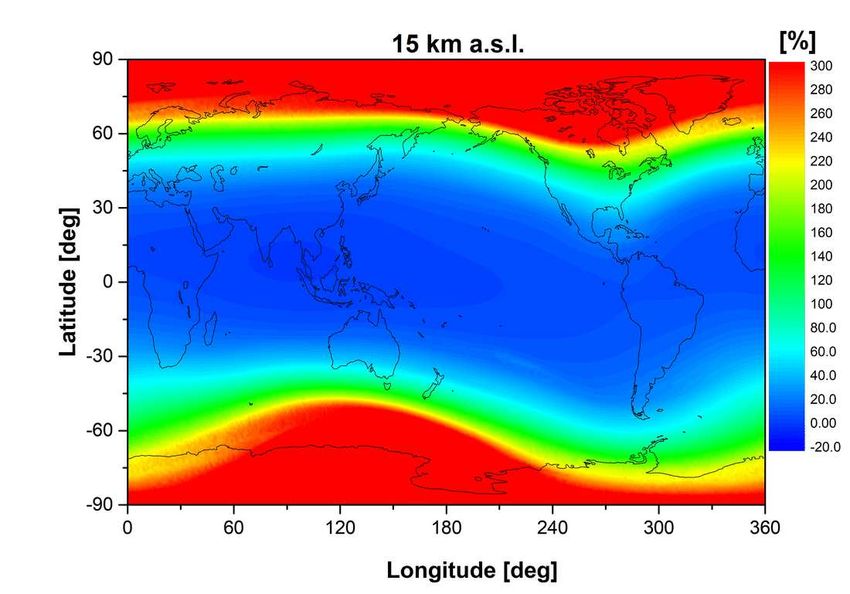
precipitating particles from radiation belts, auroral electrons, UV and X-ray solar emissions (for
details see the reviews by Vainio et al., 2009; Mironova et al., 2015, as well as the references
therein). Energetic particles induced ionization in the upper part of the Earth’s atmosphere is
dominated by solar UV and X-rays. At altitudes below about 100 km above sea level (a.s.l.),
specifically in the stratosphere and upper troposphere, the atmospheric ionization is essentially
due to the penetrating flux of galactic cosmic rays (GCRs), which is variable to a small degree (for
details see Potgieter, 2013), and thus leading to quasi-constant ion production background (for
details see Bazilevskaya et al., 2008). In some cases, as a result of solar eruptions, an enhanced
high-energy particles flux of solar origin, known as solar energetic particles (SEPs), can impinge
the Earth atmosphere, eventually leading to significant ion production (e.g. Usoskin et al., 2011b).
    The energetic particles precipitation induced ionization in the troposphere and stratosphere
results from the nuclear-electromagnetic-lepton cascade, i.e. sequence of successive interactions
of the penetrating primary cosmic ray particle with the atmospheric particulates, producing a
large amount of secondary particles losing their energy mainly via ionization (e.g. Dorman, 2004;
Grieder, 2011; Beatty et al., 2018). The maximum of ion production in the atmosphere due to
cosmic rays (CRs) is observed at the altitude of about 12-15 km a.s.l., known as Regener-Pfotzer
maximum (Regener and Pfotzer, 1935). The GCR flux is slightly modulated in the Heliosphere
and inversely follows the 11-year solar cycle, responding also to transient phenomena leading to
short term episodes as the Forbush decreases (Forbush, 1937, 1958). In some cases, the sporad-
ically occurring SEPs possess energy of about a 1 GeV/nucleon or even greater, as a result in-
duce similarly to GCRs atmospheric shower. Hence, in that case, secondaries produced by SEPs
penetrate deep into the atmosphere or even reach the ground leading to ground level enhance-
ments (GLEs) (e.g. Poluianov et al., 2017). Therefore, GLEs may cause a significant excess of
ionization, specifically over the polar caps (e.g. Jackman et al., 2000, 2011; Mishev et al., 2011;
Usoskin et al., 2011b; Mishev and Velinov, 2015c; Mitthumsiri et al., 2017; Mishev and Velinov,
2018a).
    A systematic study of the induced by high-energy particles impact ionization allows one
to clarify the influence of precipitating particles on different atmospheric chemistry processes,
global electric circuit and atmospheric physics, specifically on minor components (e.g. Krivolutsky et al.,
2006; Randall et al., 2007; Jackman et al., 2008; Rozanov et al., 2012; Nicoll and Harrison, 2014;
Verronen et al., 2015; Sinnhuber et al., 2018). Naturally, over the last decade, the energetic par-
ticles impact ionization was extensively studied. Thus, the increased high-energy particles flux
during GLEs provide a unique opportunity to study such effects in enhanced mode. During the
solar cycle 23, sixteen GLEs were observed, the first event occurred on 6 November 1997 (GLE
# 55), the last occurred on 13 December 2006 (GLE # 70), the full list is available at the Oulu
Cosmic Ray Station http://gle.oulu.fi) (e.g. Gopalswamy et al., 2012). GLEs occur spo-
radically, differ from each other in spectra, particle fluence, anisotropy, duration, apparent source
position, geomagnetic conditions (e.g. Moraal and McCracken, 2012). Therefore, they are usu-
ally studied case by case. Here, we focus on the sequence of three consecutive GLEs, viz. the
three so-called Halloween events of October-November 2003, occurred on 28 October (GLE #
65), 29 October (GLE # 66), and on 2 November (GLE # 67), respectively. On the basis of pre-
cisely derived SEP spectra and convenient state of the art model, we assessed the ion production
and the corresponding ionization effect during the three Halloween GLE events.

                                                 2
Ionization effect in the Earth's atmosphere during the sequence of October-November 2003 Halloween GLE events
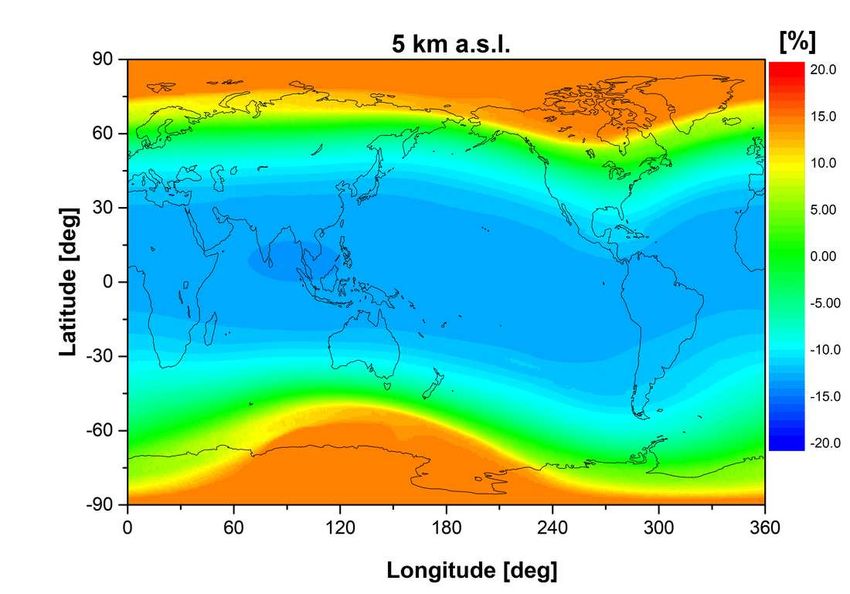
2 Employed model for computation of induced ionization
The ion production in the atmosphere due to precipitating high-energy particles can be assessed by
analytical (parametrization) and/or semi-empirical models (e.g. O’Brien, 1970; Vitt and Jackman,
1996). However, parameterization models usually exhibit constraints to a given atmospheric re-
gion, atmospheric cascade component or primary particle (e.g. Velinov et al., 2013, and refer-
ences therein). On the other hand, models based on Monte Carlo simulations of the atmospheric
cascade allow one to reliably assess the ion production rate considering all the physical processes
(Desorgher et al., 2005; Usoskin and Kovaltsov, 2006; Velinov et al., 2009; Paschalis et al., 2014;
Banjac et al., 2019). Here, we employed a model similar to Usoskin and Kovaltsov (2006), with
the full description and application are given elsewhere (i.e. Mishev and Velinov, 2007; Velinov et al.,
2009; Mishev and Velinov, 2015a). The ion production rate as a function of the altitude a.s.l. is
given by:
                                           Z ∞
                                 1                                   ∂ E(h, E)
                                                    Z

                                 E ion ∑
                     q(h, E) =                              Di (E)             ρ (h)dEdΩ         (1)
                                       i    Ecut (Rc ) Ω                ∂h
     where ∂ E is the deposited energy in an atmospheric layer ∂ h , h is the air overburden (air
mass) above a given altitude in the atmosphere expressed in g/cm2 or altitude a.s.l., Di (E) is the
differential cosmic ray spectrum for a given component i: protons p, Helium (α -particles), the lat-
ter representative for heavier nuclei with atomic number Z > 2 (for details see Usoskin and Kovaltsov,
2006; Mishev and Velinov, 2011), ρ is the atmospheric density in g.cm−3, E is the initial energy
of the incoming primary nuclei on the top of the atmosphere, Ω is a solid angle and Eion = 35
eV is the average energy necessary for creation of an ion pair in air (Porter et al., 1976). The
integration is over the kinetic energy Ecut (Rc ) above the rigidity cut-off Rc for a nuclei of type i
at a given geographic location by the expression:
                                           s
                                               2
                                                Zi
                                  Ecut,i =           R2c + E02 − E0                                (2)
                                                Ai
where E0 = 0.938 GeV/n is the proton’s rest mass.
    Here, the computation of the cut-off rigidity was performed with the MAGNETOCOSMICS
code, explicitly considering the measured K p index during the events (Desorgher et al., 2005),
assuming a combination of the IGRF geomagnetic model as the internal field model and the
Tsyganenko 89 model as the external field (Tsyganenko, 1989). This combination allows one
to compute straightforwardly with reasonable precision the local rigidity cut-offs over the globe
(Kudela and Usoskin, 2004; Kudela et al., 2008; Nevalainen et al., 2013). We emphasize that
employment of newer version of Tsyganenko models e.g. Tsyganenko 96 or Tsyganenko 01
(Tsyganenko, 1995, 2002), would lead to comparable results since the other model uncertainties
such as ionization yield function and the used as input SEP spectra are considerably greater as
discussed below.
    During GLEs, ion production in the atmosphere is presented as a superposition of GCRs and
SEPs contributions. For the contribution of GCRs in Eq. (1) the force field model is employed
(Gleeson and Axford, 1968; Burger et al., 2000), where the parametrization of the local inter-
stellar spectrum is according to Usoskin et al. (2017) and the modulation potential is taken from

                                                        3
Ionization effect in the Earth's atmosphere during the sequence of October-November 2003 Halloween GLE events
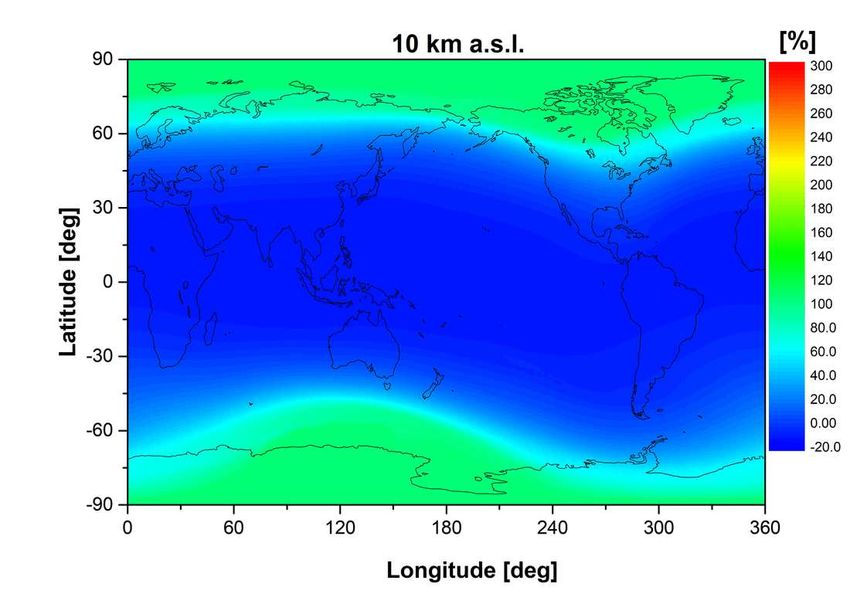
Usoskin et al. (2011a). Accordingly, the SEPs spectra in equation (1) are considered according to
Miroshnichenko et al. (2005); Kocharov et al. (2017).
    Note, that for the computations a realistic atmospheric model NRLMSISE 00 is employed,
that explicitly considers the specifics of the atmospheric conditions and type of the incident pri-
mary particle (Picone et al., 2002; Mishev and Velinov, 2010, 2014).

3 Sequence of three Halloween GLEs on October-November
  2003
A violent solar activity was observed in October–November 2003, which produced a sequence of
three consecutive GLEs, with onsets occurring on 28 October, 29 October and on 2 November,
respectively (Gopalswamy et al., 2005; Liu and Hayashi, 2006; Gopalswamy et al., 2012). The
events were observed by the global neutron monitor network, the details and count rate records
are given in great detail in http://gle.oulu.fi).
     The GLE # 65 on 28 October 2003 was associated with a large flare (4B, X17.2) occurred in
the active region AR10486. The GLE # 65 followed significant interplanetary disturbance related
to previously ejected coronal mass ejection (CME) on 26 October with correspondence with a
3B/X1.2 flare in the same active region. The SEP spectra were relatively hard with observed
softening throughout the event (Fig.1a).
     The GLE # 66, occurred on 29 October, was characterized by a notably smaller recorded
neutron monitor count rate increases, thus this event was considerably weaker. Softer SEP spectra
were observed, with non-significant variation throughout the event (Fig.1b). A strong Forbush
decrease was also observed prior to and during this event, which was explicitly considered during
our computations of ion production rate, i.e. a GCR flux reduction was taken into account during
the computations.
     The GLE # 67, occurred on 2 November 2003, was related to an X8.3/2B solar flare, with
onset at about 17:30–17:35 UT. In general, the event was characterized by a large anisotropy in
its initial phase and relatively hard but constantly softened SEP spectra (Fig.1c), the details are
given in (Kocharov et al., 2017).
     It should be noted that in this period occurred the strongest in 30 years (since march 1989)
geomagnetic storm. The planetary A p index reached values A p =204 on 29 October 2003, A p =191
on 30 October 2003 and A p =116 on 31 October 2003.
     The presented in Fig.1 SEP spectra were used as input in Eq. (1) for the computation of ion
production rate throughout the events. The spectra were mostly derived on the basis of a ver-
ified method for data analysis of ground-based neutron monitor data (e.g. Mishev et al., 2018;
Mishev and Usoskin, 2016), which reliably accounts for the high-energy part of the spectra, usu-
ally underestimated by space-borne instruments (for details see Koldobskiy et al., 2019). The
derived GLE particles spectra are with good agreement with Koldobskiy et al. (2019). More in-
formation about the used spectra is presented in Miroshnichenko et al. (2005); Kocharov et al.
(2017). Here, we would like to point out that the input SEP spectra in the model for computa-
tion of the ion production is crucial and can lead to an important uncertainty, up to an order of
magnitude, in the computations similarly to Bütikofer and Flückiger (2015). The other model
uncertainties, namely the Monte Carlo simulations of the atmospheric cascade used for the com-

                                                4
6                             6                               6
                        10                            10                              10
                                 A           2200              B             1130              C           1730

                                             2230                                                          1800
                                                                             1200
           ]
          -1

                                             2300                                                          1830
                             5                             5                 1300          5
                        10                   2330     10                              10
           GV

                                                                                                           1900
                                                                             1400
                                             2400                                                          1925
          -1
           s
          -1

                             4                             4                               4
                        10                            10                              10
           sr
          -2
           Flux [Proton m

                             3                             3                               3
                        10                            10                              10

                             2                             2                               2
                        10                            10                              10

                             1                             1                               1
                        10                            10                              10

                             0                             0                               0
                        10                            10                              10

                                 1   2   3    4   5            1   2     3    4   5            1   2   3    4   5

                                                                       R [GV]

Figure 1: Rigidity spectra of SEPs during selected stages of Halloween GLEs as denoted in the
legend. Panels a,b,c, correspond to GLE # 65 occurred on 28 October 2003, GLE # 66 occurred
on 29 October 2003 and GLE # 67 occurred on 2 November 2003, respectively. The solid line
denotes the GCR flux.
                                               .

                                                                   5
putation of the ionization yield function (e.g. Mishev and Velinov, 2010), integration methods in
Eq. (1) and computation of the cut-off rigidities using the corresponding magnetospheric model
are significantly smaller. Therefore, the employment of SEP spectra based on a verified method
is specifically important.

4 Atmospheric ionization during Halloween GLEs
The Halloween GLEs differ in duration, features, accordingly anisotropy and spectra, which play
an essential role for the computations of ion production throughout the events (Moraal and McCracken,
2012). In addition, GLE # 66 occurred during deep Forbush decrease, which was explicitly con-
sidered during our computations, i.e. the GCR flux was adjusted from NMs measurements, the
data retrieved from neutron monitor database www.NMDB.eu (Mavromichalaki et al., 2011). Ac-
cordingly, the GLE # 67 occurred during the recovery phase of a Forbush decrease, which was
taken into account in a similar way.

4.1 Ion production rates during Halloween GLEs
Using the model described in Section 2 and the derived GLE particles spectra (Section 3) we
computed the ion production rate in the stratosphere and troposphere from ground level to about
35 km a.s.l. considering the GCRs and SEPs contribution (Mishev and Velinov, 2018b, 2020).
In Fig.2 we present the ion production during the Halloween GLEs, specifically in the polar and
sub-polar region with rigidity cut-off Rc ≤ 1 GV (Fig.2a,b,c) and high mid-latitudes region with
rigidity cut-off Rc ≈ 2 GV (Fig.2d,e,f).
    The computed during GLE # 65 ion production rate was significant throughout the initial and
main phase of the event, specifically in the polar low stratosphere (Fig. 2a). The ion production
rate diminished but remained significant during the late phase of the event. However, in a region
with rigidity cut-off of about Rc ≈ 2 GV the ion production rate was comparable to the average
due to GCRs (Fig.2d). Moreover, at altitudes of about 10 km a.s.l. and below the ion production
rate due to GCR was greater than that due to SEPs, because of the soft spectra of the latter.
Accordingly, in the region of Rc ≈ 3 GV, the ion production due to GCR dominated in the whole
atmosphere. The time evolution of the ion production rate at an altitude of 15 km a.s.l. during
GLE # 65 is presented in the Appendix (Fig.A.1).
    The computed ion production rate during GLE # 66 was considerably lower (Fig.2b), because
of softer SEP spectra compared to GLE # 65, the notably reduced SEP flux and the accompanying
deep Forbush decrease. The ion production rate during GLE # 66 was slightly variable throughout
the event with a tendency for diminishing. At polar and sub-polar region with rigidity cut-off Rc
≤ 1 GV, the ion production rate was still significant, however, in region with rigidity cut-off Rc
≈ 2 GV the contribution of SEPs was smaller than that due to GCRs (Fig.2e). Similarly to GLE
# 65, the time evolution of the ion production rate at an altitude of 15 km a.s.l. during GLE # 66
is presented in the supplementary material Appendix (Fig.A.2).
    The ion production rate during the last event - GLE # 67 was greater than GLE # 66, specifi-
cally during the initial and main phase of the event, but rapidly diminished during the late phase
(Fig.2c). In addition, because the softer SEP spectra compared to GLE # 65 the computed ion

                                                6
40000

                                                     A                                                 B                                               GCR                       C                     GCR
                                                                                     GCR

                                                                                     11:30                                                             22:00                                           17:35
                                         35000
                                                                                     12:00                                                                                                             18:00
                                                                                                                                                       22:30
                                                                                     12:30                                                                                                             18:30
                                                                                                                                                       23:00
                                         30000                                                                                                                                                         19:00
                                                                                     13:00
                                                                                                                                                       23:30

                  Altitude [m a.s.l. ]
                                                                                     14:00
                                                                                                                                                       00.00
                                         25000

                                         20000

                                         15000

                                         10000

                                          5000

                                                 0           100        200    300         400     0          50        100               150                200             0       50   100   150      200

                                                                                                                                                           -3       -1
                                                                                                            Ion production rate [ion pairs cm                   s        ]
                                         40000
                                                     D                                                 E                                                                         F
                                                                                     GCR                                                               GCR                                             GCR

                                                                                     11:30                                                             22:00                                           17:35
                                         35000
                                                                                     12:00                                                             22:30                                           18:00

                                                                                     12:30                                                                                                             18:30
                                                                                                                                                       23:00
                                         30000                                       13:00                                                                                                             19:00
                                                                                                                                                       23:30
                  Altitude [m a.s.l. ]

                                                                                     14:00
                                                                                                                                                       00.00
                                         25000

                                         20000

                                         15000

                                         10000

                                          5000

                                                 0       5         10     15   20     25           0          5          10               15                 20              0        5    10     15         20
                                                                                                                                     -3       -1
                                                                                                 Ion production rate [ion pairs cm        s        ]

Figure 2: Ion production rates due to CRs during Halloween GLEs on October-November 2003.
Panels a,b,c, and d,e,f, correspond to GLE # 65, 66, 67 respectively. The top panels correspond
to region with Rc ≤ 1 GV, the bottom panels correspond to region with Rc ≈ 2 GV.
                                               .

production rates were slightly below that the computed during the GLE # 65. In the region of mid-
latitudes with Rc ≈ 2 GV, the contribution of SEPs was smaller than that due to GCRs (Fig.2f).
The time evolution of the ion production rate at an altitude of 15 km a.s.l. during GLE # 67 is
presented in the Appendix (Fig.A.3).
     One can see that the computed ion production rates were greatly variable throughout the
events. The ion production was significant in the polar region and considerably diminished in
region with Rc ≈ 2 GV. The ion production rates were maximal during the strongest event - GLE
# 65. In all cases, the contribution to the ion production due to GCRs in the polar region was
smaller that that due to SEPs, but dominated at region with Rc ≈ 2–3 GV.

4.2 Integrated ionization effect in the atmosphere
In order to compute the ionization effect during GLEs, specifically for atmospheric physics and
chemistry purposes, it is more convenient to perform integration over selected time scale(s), cor-
responding to event duration and/or 24 hours. Here, using the computed ion production rates
during the Halloween GLEs, we computed the corresponding ionization effect. The ionization
effect represents the averaged over the event or 24 hours ion production rate during a GLE con-
sidering the SEP and actual GCR contributions versus averaged ion production rate due to GCR
prior to the event, assuming recombination model similarly to Krivolutsky et al. (2006).
    The results of those computations for 24 hours averaged ionization effect are shown in Figs.3–

                                                                                                                   7
[%]
                                90
                                                                                       200

                                                                                       180

                                60
                                                                                       160

                                                                                       140

                                30
               Latitude [deg]

                                                                                       120

                                                                                       100

                                 0
                                                                                       80.0

                                                                                       60.0

                                -30
                                                                                       40.0

                                                                                       20.0

                                -60
                                                                                       0.00

                                -90
                                      0   60   120      180       240   300    360

                                                     Longitude [deg]

Figure 3: Map of the 24h averaged ionization effect in the region of Regener-Pfotzer maximum
during GLE # 65 on 28 October 2003.
                                              .

5 for GLE # 65, GLE # 66 and GLE # 67, respectively. Note, that here we computed the cut-off
rigidity during the events, explicitly considering the complex goemagnetospheric conditions em-
ploying a combination of IGRF (Thébault et al., 2015) and Tsyganenko 89 (Tsyganenko, 1989)
models, as discussed above. This allowed us to perform realistic high-precision computations of
the global distribution of ion production over the globe, accordingly the corresponding ionization
effect.
    The 24 hours integrated ionization effect during GLE # 65 was significant in the high-latitude
region, where it ranged about 100-200 % in the region of Regener-Pfotzer maximum. The ioniza-
tion effect diminished at lower latitudes, it was negligible in lower-mid and equatorial latitudes
(Fig.3). This is due to softer SEP spectra comparing to GCRs. Therefore SEPs contributed sig-
nificantly in the polar region, but not at low latitudes. The ionization effect is also a function
of the altitude. It diminished significantly as a function of altitude. At lower altitudes, it was
considerably smaller than that at the region of the Regener-Pfotzer maximum. An illustration of
the altitude dependence of the event averaged ionization effect is given in Appendix (Fig.A.4).
Note that the event integrated ionization effect was considerably greater than 24 hours integrated,
since it accounted the SEPs contribution on a shorter time scale.
    As was mentioned above, GLE # 66 occurred during a deep Forbush decrease of GCRs and
complex magnetospheric conditions (e.g. Belov et al., 2005). This specific Forbush decrease was
one of the largest ever recorded. In particular, the amplitude of the decrease was ∼ 30% in 10
GV particles as reported by Belov (2009) in their Figure 2. This resulted in complicated interplay
of SEP contribution and significantly reduced GCR flux contribution on the ion production. The

                                                       8
[%]
                               90
                                                                                         10

                               60                                                        5.0

                                                                                         0.0
                               30
              Latitude [deg]

                                                                                         -5.0

                                0

                                                                                         -10

                               -30
                                                                                         -15

                               -60
                                                                                         -20

                               -90
                                     0   60   120         180         240   300   360

                                                    Longitude [deg]

Figure 4: Map of the 24h averaged ionization effect in the region of Regener-Pfotzer maximum
during GLE # 66 on 29 October 2003.
                                              .

                                                                                   [%]
                               90
                                                                                         50

                                                                                         45

                               60
                                                                                         40

                                                                                         35

                               30
              Latitude [deg]

                                                                                         30

                                                                                         25

                                0
                                                                                         20

                                                                                         15

                               -30
                                                                                         10

                                                                                         5.0

                               -60
                                                                                         0.0

                               -90
                                     0   60   120         180         240   300   360

                                                    Longitude [deg]

Figure 5: Map of the 24h averaged ionization effect in the region of Regener-Pfotzer maximum
during GLE # 67 on 2 November 2003.
                                              .

                                                         9
SEP spectra in this case were slightly softer and with reduced flux than that during GLE # 65.
While, the event integrated ionization effect was comparable to the previous event, the 24 hours
averaged ionization effect during GLE # 66 was marginal, even in the polar region it was of about
5 %. Moreover, it was negative in the equatorial region, due to the reduced GCR flux (Fig.4).
The altitude dependence of the event averaged ionization effect during GLE # 66 is given in the
Appendix (Fig.A.5).
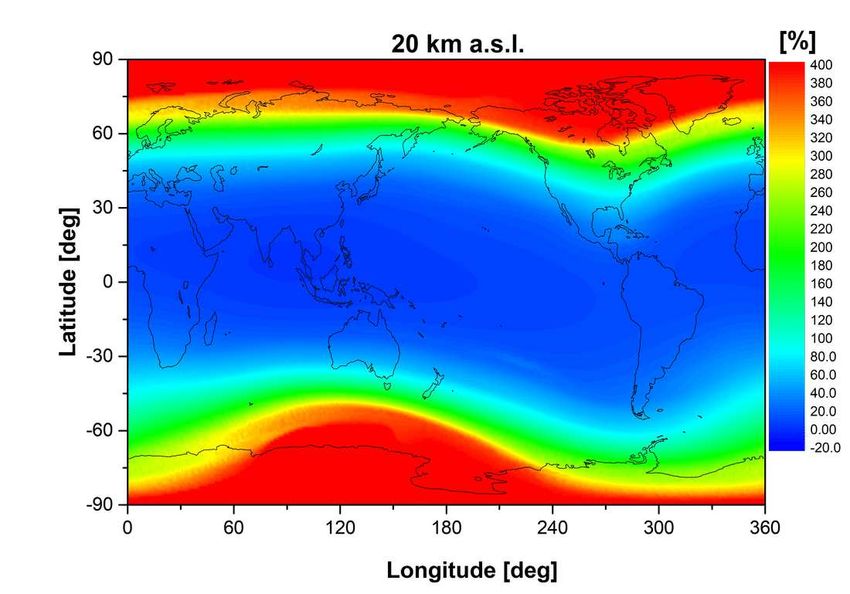
    Accordingly, the ionization effect during GLE # 67 was not significant in mid-latitudes and
it was marginal in the equatorial region (Fig.5). The last of the sequence of Halloween events,
GLE # 67, occurred during the recovery phase of a deep Forbush decrease. Therefore, the reduced
GCR flux within temporal evolution was explicitly considered for the computation of background
ion rate production. The 24 hours averaged ionization effect during GLE # 67 was of about 40
% in the polar region. It diminished to about 10 % at lower latitudes. Accordingly, the altitude
dependence of the event averaged ionization effect during GLE # 67 is given in the Appendix
(Fig.A.6).

5 Summary and Discussion
The effect of high-energy particles precipitation, specifically cosmic rays, via the induced ioniza-
tion on atmospheric chemistry and physics is subject to extensive scientific discussion (Mironova et al.,
2015). The sporadic rapid change of CR flux, e.g. Forbush decreases and/or GLEs provides an
unique possibility to study such possible effects on enhanced magnitude. The studied here se-
quence of three consecutive GLEs occurred in October-November 2003, the so-called Halloween
events, give a good basis to study the possible influence of precipitating energetic particles, con-
cerning also previous reports (e.g. Funke et al., 2011).
    It was recently pointed out that for observation of such effects, it is necessary an essential
increase of ion production in the atmosphere e.g. during major GLEs and winter season in order
to avoid the eventual influence of UV (Mironova and Usoskin, 2014). Therefore, the presented
here computed ionization effect during Halloween events gives the basis for similar studies (e.g.
Krivolutsky et al., 2005; Sinnhuber et al., 2018).
    The ion production during the GLEs is governed by SEP spectra. SEPs with harder spectra
impact also mid-latitude regions, while soft SEPs contribute mostly to the polar region. In ad-
dition, transients such as Forbushes play also an important role. This is clearly seen during the
Halloween events. The ion production during GLE # 65 was greater than the subsequent GLE
# 66 and GLE # 67. Accordingly, the ionization effect was highly dependent on the time-scale.
While, the event averaged ionization effect was in the same order for all the three events, the
24 hours integrated ionization effect was apparently different: during GLE # 65 it was signifi-
cant, marginal even negative in some regions during GLE # 66 and moderate during GLE # 67.
Besides, an apparent altitude dependence was observed.
    In the work presented here, we computed the ion production rate and the corresponding ion-
ization effect during the Halloween GLEs occurred on October-November 2003, assuming ex-
plicitly precisely the derived SEP spectra, their evolution throughout the events, and the corre-
sponding magnetospheric conditions and variable GCRs flux. The computed ion production rates
were significant during the main phase of the events, specifically at the polar region with rigidity
cut-off Rc ≤ 1 GV. At regions with Rc ≈ 2, the ion production was comparable to the average due

                                                10
to GCR, because of the rapidly falling SEP spectra. At mid-latitudes with rigidity cut-off Rc of
about 3 GV or greater, the ion production due to GCR dominated in the whole atmosphere during
all the events. The event averaged ionization effects were maximal at altitudes of about 15–18
km a.s.l..
     The presented here computation of ionization effect during the sequence of three Halloween
events give good basis to study the possible effect of precipitating high-energy particles in the
Earth’s atmosphere on a minor constituents, atmospheric physics and chemistry as well as studies
related to space weather and solar-terrestrial physics (Miroshnichenko, 2003; Mishev and Velinov,
2015b; Miroshnichenko, 2018).

Acknowledgements
This work was supported by the Academy of Finland (project 330063 QUASARE, 321882 ES-
PERA and 304435 CRIPA-X). The work benefited from discussions in the framework of the In-
ternational Space Science Institute International Team 441: High EneRgy sOlar partICle Events
Analysis (HEROIC). The NM records used in this study were retrieved from International GLE
database http://gle.oulu.fi and neutron monitor database www.NMDB.eu. The authors ac-
knowledge the anonymous reviewers for their useful comments and suggestions that helped us to
improve this paper.

                                               11
A Time and altitude evolution of ion production rate during
  the Halloween GLEs
                                                                                             -3        -1                                                                                         -3       -1
                                                                             [ion pairs cm        s         ]                                                                     [ion pairs cm        s        ]
                                                          11:30 UT                                                                                             12:30 UT
                                     90                                                                     300
                                                                                                                                          90                                                               300

                                                                                                            280                                                                                            280

                                                                                                            260                                                                                            260
                                     60                                                                                                   60
                                                                                                            240                                                                                            240

                                                                                                            220                                                                                            220

                                                                                                            200                                                                                            200
                                     30                                                                                                   30
                    Latitude [deg]

                                                                                                                         Latitude [deg]
                                                                                                            180                                                                                            180

                                                                                                            160                                                                                            160

                                      0                                                                     140                            0                                                               140

                                                                                                            120                                                                                            120

                                                                                                            100                                                                                            100

                                     -30                                                                                                  -30
                                                                                                            80.0                                                                                           80.0

                                                                                                            60.0                                                                                           60.0

                                                                                                            40.0                                                                                           40.0
                                     -60                                                                                                  -60
                                                                                                            20.0                                                                                           20.0

                                     -90                                                                                                  -90
                                           0   60   120      180       240      300      360                                                    0   60   120      180       240    300       360

                                                          Longitude [deg]                                                                                      Longitude [deg]

                                                                                                  -3       -1                                                                                     -3       -1
                                                          13:00 UT            [ion pairs cm            s        ]                                              14:00 UT           [ion pairs cm        s        ]
                                     90                                                                     300
                                                                                                                                          90                                                               300

                                                                                                            280                                                                                            280

                                                                                                            260                                                                                            260
                                     60                                                                                                   60
                                                                                                            240                                                                                            240

                                                                                                            220                                                                                            220

                                                                                                            200                                                                                            200
                                     30                                                                                                   30
                    Latitude [deg]

                                                                                                                         Latitude [deg]
                                                                                                            180                                                                                            180

                                                                                                            160                                                                                            160

                                      0                                                                     140                            0                                                               140

                                                                                                            120                                                                                            120

                                                                                                            100                                                                                            100

                                     -30                                                                                                  -30
                                                                                                            80.0                                                                                           80.0

                                                                                                            60.0                                                                                           60.0

                                                                                                            40.0                                                                                           40.0
                                     -60                                                                                                  -60
                                                                                                            20.0                                                                                           20.0

                                     -90                                                                                                  -90
                                           0   60   120      180       240      300      360                                                    0   60   120      180       240    300       360

                                                          Longitude [deg]                                                                                      Longitude [deg]

Figure A.1: Ion production rate at altitude of 15 km a.s.l. at selected stages of the event during
GLE # 65 on 28 October 2003.

                                                                                                                    12
-3       -1                                                                                     -3       -1
                                                          22:00 UT           [ion pairs cm        s        ]                                              23:00 UT           [ion pairs cm        s        ]
                                     90                                                                                              90
                                                                                                      160                                                                                             160

                                                                                                      140                                                                                             140
                                     60                                                                                              60

                                                                                                      120                                                                                             120

                                     30                                                                                              30

                    Latitude [deg]

                                                                                                                    Latitude [deg]
                                                                                                      100                                                                                             100

                                      0                                                               80.0                            0                                                               80.0

                                                                                                      60.0                                                                                            60.0

                                     -30                                                                                             -30

                                                                                                      40.0                                                                                            40.0

                                     -60                                                                                             -60
                                                                                                      20.0                                                                                            20.0

                                     -90                                                                                             -90
                                           0   60   120      180       240    300       360                                                0   60   120      180       240    300       360

                                                          Longitude [deg]                                                                                 Longitude [deg]

                                                                                             -3       -1                                                                                     -3       -1
                                                          23:30 UT           [ion pairs cm        s        ]                                              24:00 UT           [ion pairs cm        s        ]
                                     90                                                                                              90
                                                                                                      160                                                                                             160

                                                                                                      140                                                                                             140
                                     60                                                                                              60

                                                                                                      120                                                                                             120

                                     30                                                                                              30
                    Latitude [deg]

                                                                                                                    Latitude [deg]
                                                                                                      100                                                                                             100

                                      0                                                               80.0                            0                                                               80.0

                                                                                                      60.0                                                                                            60.0

                                     -30                                                                                             -30

                                                                                                      40.0                                                                                            40.0

                                     -60                                                                                             -60
                                                                                                      20.0                                                                                            20.0

                                     -90                                                                                             -90
                                           0   60   120      180       240    300       360                                                0   60   120      180       240    300       360

                                                          Longitude [deg]                                                                                 Longitude [deg]

Figure A.2: Ion production rate at altitude of 15 km a.s.l. at selected stages of the event during
GLE # 66 on 29 October 2003.

                                                                                             -3       -1                                                                                     -3       -1
                                                          17:30 UT           [ion pairs cm        s        ]                                              18:00 UT           [ion pairs cm        s        ]
                                     90                                                                                              90
                                                                                                      200                                                                                             200

                                                                                                      180                                                                                             180

                                     60                                                                                              60
                                                                                                      160                                                                                             160

                                                                                                      140                                                                                             140
                                     30                                                                                              30
                    Latitude [deg]

                                                                                                                    Latitude [deg]

                                                                                                      120                                                                                             120

                                                                                                      100                                                                                             100
                                      0                                                                                               0

                                                                                                      80.0                                                                                            80.0

                                     -30                                                              60.0                           -30                                                              60.0

                                                                                                      40.0                                                                                            40.0

                                     -60                                                                                             -60
                                                                                                      20.0                                                                                            20.0

                                     -90                                                                                             -90
                                           0   60   120      180       240    300       360                                                0   60   120      180       240    300       360

                                                          Longitude [deg]                                                                                 Longitude [deg]

                                                                                             -3       -1                                                                                     -3       -1
                                                          18:30 UT           [ion pairs cm        s        ]                                              19:00 UT           [ion pairs cm        s        ]
                                     90                                                                                              90
                                                                                                      200                                                                                             200

                                                                                                      180                                                                                             180

                                     60                                                                                              60
                                                                                                      160                                                                                             160

                                                                                                      140                                                                                             140
                                     30                                                                                              30
                    Latitude [deg]

                                                                                                                    Latitude [deg]

                                                                                                      120                                                                                             120

                                                                                                      100                                                                                             100
                                      0                                                                                               0

                                                                                                      80.0                                                                                            80.0

                                     -30                                                              60.0                           -30                                                              60.0

                                                                                                      40.0                                                                                            40.0

                                     -60                                                                                             -60
                                                                                                      20.0                                                                                            20.0

                                     -90                                                                                             -90
                                           0   60   120      180       240    300       360                                                0   60   120      180       240    300       360

                                                          Longitude [deg]                                                                                 Longitude [deg]

Figure A.3: Ion production rate at altitude of 15 km a.s.l. at selected stages of the event during
GLE # 67 on 2 November 2003.

                                                                                                               13
5 km a.s.l.                  [%]                                                     10 km a.s.l.                 [%]
                                    90                                                                                   90
                                                                                            390                                                                                  390

                                                                                            370                                                                                  370

                                                                                            350                                                                                  350

                                    60                                                      330                          60                                                      330

                                                                                            310                                                                                  310

                                                                                            290                                                                                  290

                                                                                            270                                                                                  270
                                    30                                                      250                          30                                                      250

                   Latitude [deg]

                                                                                                        Latitude [deg]
                                                                                            230                                                                                  230

                                                                                            210                                                                                  210

                                                                                            190                                                                                  190
                                     0                                                                                    0
                                                                                            170                                                                                  170

                                                                                            150                                                                                  150

                                                                                            130                                                                                  130

                                                                                            110                                                                                  110
                                    -30                                                                                  -30
                                                                                            90.0                                                                                 90.0

                                                                                            70.0                                                                                 70.0

                                                                                            50.0                                                                                 50.0

                                    -60                                                     30.0                         -60                                                     30.0

                                                                                            10.0                                                                                 10.0

                                    -90                                                                                  -90
                                          0   60   120      180         240   300   360                                        0   60   120      180         240   300   360

                                                         Longitude [deg]                                                                      Longitude [deg]

                                                                                     [%]                                                                                   [%]
                                                         15 km a.s.l.                                                                         20 km a.s.l.
                                    90                                                      400
                                                                                                                         90                                                      400

                                                                                            380                                                                                  380

                                                                                            360                                                                                  360

                                                                                            340                                                                                  340
                                    60                                                                                   60
                                                                                            320                                                                                  320

                                                                                            300                                                                                  300

                                                                                            280                                                                                  280

                                    30                                                      260                          30                                                      260
                   Latitude [deg]

                                                                                                        Latitude [deg]
                                                                                            240                                                                                  240

                                                                                            220                                                                                  220

                                                                                            200                                                                                  200
                                     0                                                      180                           0                                                      180

                                                                                            160                                                                                  160

                                                                                            140                                                                                  140

                                                                                            120                                                                                  120
                                    -30                                                                                  -30
                                                                                            100                                                                                  100

                                                                                            80.0                                                                                 80.0

                                                                                            60.0                                                                                 60.0

                                    -60                                                     40.0                         -60                                                     40.0

                                                                                            20.0                                                                                 20.0

                                    -90                                                                                  -90
                                          0   60   120      180         240   300   360                                        0   60   120      180         240   300   360

                                                         Longitude [deg]                                                                      Longitude [deg]

Figure A.4: Event integrated ionization effect as a function of altitude during GLE # 65 on 28
October 2003.

Figure A.5: Event integrated ionization effect as a function of altitude during GLE # 66 on 29
October 2003.

                                                                                                   14
5 km a.s.l.                   [%]                                                     10 km a.s.l.                 [%]
                                     90                                                                                    90
                                                                                              390                                                                                  390

                                                                                              370                                                                                  370

                                                                                              350                                                                                  350

                                     60                                                       330                          60                                                      330

                                                                                              310                                                                                  310

                                                                                              290                                                                                  290

                                                                                              270                                                                                  270
                                     30                                                       250                          30                                                      250

                    Latitude [deg]

                                                                                                          Latitude [deg]
                                                                                              230                                                                                  230

                                                                                              210                                                                                  210

                                                                                              190                                                                                  190
                                      0                                                                                     0
                                                                                              170                                                                                  170

                                                                                              150                                                                                  150

                                                                                              130                                                                                  130

                                                                                              110                                                                                  110
                                     -30                                                                                   -30
                                                                                              90.0                                                                                 90.0

                                                                                              70.0                                                                                 70.0

                                                                                              50.0                                                                                 50.0

                                     -60                                                      30.0                         -60                                                     30.0

                                                                                              10.0                                                                                 10.0

                                     -90                                                                                   -90
                                           0   60   120      180         240   300    360                                        0   60   120      180         240   300   360

                                                          Longitude [deg]                                                                       Longitude [deg]

                                                                                       [%]                                                                                   [%]
                                                          15 km a.s.l.                                                                          20 km a.s.l.
                                     90                                                       400
                                                                                                                           90                                                      400

                                                                                              380                                                                                  380

                                                                                              360                                                                                  360

                                                                                              340                                                                                  340
                                     60                                                                                    60
                                                                                              320                                                                                  320

                                                                                              300                                                                                  300

                                                                                              280                                                                                  280

                                     30                                                       260                          30                                                      260
                    Latitude [deg]

                                                                                                          Latitude [deg]
                                                                                              240                                                                                  240

                                                                                              220                                                                                  220

                                                                                              200                                                                                  200
                                      0                                                       180                           0                                                      180

                                                                                              160                                                                                  160

                                                                                              140                                                                                  140

                                                                                              120                                                                                  120
                                     -30                                                                                   -30
                                                                                              100                                                                                  100

                                                                                              80.0                                                                                 80.0

                                                                                              60.0                                                                                 60.0

                                     -60                                                      40.0                         -60                                                     40.0

                                                                                              20.0                                                                                 20.0

                                     -90                                                                                   -90
                                           0   60   120      180         240   300    360                                        0   60   120      180         240   300   360

                                                          Longitude [deg]                                                                       Longitude [deg]

Figure A.6: Event integrated ionization effect as a function of altitude during GLE # 67 on 2
November 2003.

References
Banjac, S., Herbst, K., Heber, B., 2019. The atmospheric radiation interaction simulator (ATRIS):
  Description and validation. Journal of Geophysical Research: Space Physics 124, 50–67.
  doi:10.1029/2018JA026042.

Bazilevskaya, G.A., Usoskin, I.G., Flückiger, E., Harrison, R., Desorgher, L., Bütikofer, B.,
  Krainev, M., Makhmutov, V., Stozhkov, Y., Svirzhevskaya, A., Svirzhevsky, N., Kovaltsov,
  G., 2008. Cosmic ray induced ion production in the atmosphere. Space Science Reviews 137,
  149–173.

Beatty, J., Matthews, J., Wakely, S., 2018. Cosmic rays, in: M. Tanabashi et al., Review of
  Particle Physics. Physical Review D 98, 030001, pp. 424–432.

Belov, A., 2009. Forbush effects and their connection with solar, interplanetary and geo-
  magnetic phenomena. Proceedings of the International Astronomical Union 4, 439–450.
  doi:10.1017/S1743921309029676.

Belov, A., Baisultanova, L., Eroshenko, E., Mavromichalaki, H., Yanke, V., Pchelkin, V.,
  Plainaki, C., Mariatos, G., 2005. Magnetospheric effects in cosmic rays during the unique
  magnetic storm on november 2003. Journal of Geophysical Research: Space Physics 110,
  A09S20. doi:10.1029/2005JA011067.

Burger, R., Potgieter, M., Heber, B., 2000. Rigidity dependence of cosmic ray proton latitudinal
  gradients measured by the Ulysses spacecraft: Implication for the diffusion tensor. Journal of
  Geophysical Research 105, 27447–27445.

Bütikofer, R., Flückiger, E., 2015.                                                What are the causes for the spread of GLE pa-

                                                                                                     15
rameters deduced from nm data?      Journal of Physics:                Conference Series 632.
  doi:10.1088/1742-6596/632/1/012053.
Desorgher, L., Flückiger, E., Gurtner, M., Moser, M., Bütikofer, R., 2005. A GEANT 4 code for
  computing the interaction of cosmic rays with the earth’s atmosphere. International Journal of
  Modern Physics A 20, 6802–6804.

Dorman, L., 2004. Cosmic Rays in the Earth’s Atmosphere and Underground. Kluwer Academic
  Publishers, Dordrecht.

Forbush, S., 1937. On the effects in cosmic-ray intensity observed during the recent magnetic
  storm. Physical Review 51, 1108–1109.

Forbush, S., 1958. Cosmic-ray intensity variations during two solar cycles. Journal of Geophysi-
  cal Research 63, 651–669.
Funke, B., Baumgaertner, A., Calisto, M., Egorova, T., Jackman, C., Kieser, J., Krivolutsky,
  A., López-Puertas, M., Marsh, D., Reddmann, T., Rozanov, E., Salmi S.-M., Sinnhuber, M.,
  Stiller, G., Verronen, P., Versick, S., Von Clarmann, T., Vyushkova, T., Wieters, N., Wissing, J.,
  2011. Composition changes after the ”Halloween” solar proton event: The high energy particle
  precipitation in the atmosphere (HEPPA) model versus MIPAS data intercomparison study.
  Atmospheric Chemistry and Physics 11, 9089–9139. doi:10.5194/acp-11-9089-2011.

Gleeson, L., Axford, W., 1968. Solar modulation of galactic cosmic rays. Astrophysical Journal
  154, 1011–1026.

Gopalswamy, N., Barbieri, L., Cliver, E., Lu, G., Plunkett, S., Skoug, R., 2005. Introduction
  to violent sun-earth connection events of October-November 2003. Journal of Geophysical
  Research: Space Physics 110, A09S00. doi:10.1029/2005JA011268.

Gopalswamy, N., Xie, H., Yashiro, S., Akiyama, S., Mäkelä, P., Usoskin, I., 2012. Properties
  of ground level enhancement events and the associated solar eruptions during solar cycle 23.
  Space Science Reviews 171, 23–60.

Grieder, P., 2011. Extensive Air Showers: High Energy Phenomena and Astrophysical Aspects -
  A Tutorial, Reference Manual and Data Book. Springer, Space Science Library (Book 1009).
Jackman, C., Fleming, E., Vitt, F., 2000. Influence of extremely large solar proton events in a
  changing stratosphere. Journal of Geophysical Research Atmospheres 105, 11659–11670.
Jackman, C., Marsh, D., Vitt, F., Garcia, R., Fleming, E., Labow, G., Randall, C., López-Puertas
  M., Funke, B., Von Clarmann, T., Stiller, G., 2008. Short- and medium-term atmospheric
  constituent effects of very large solar proton events. Atmospheric Chemistry and Physics 8,
  765–785.
Jackman, C., Marsh, D., Vitt, F., Roble, R., Randall, C., Bernath, P., Funke, B., López-Puertas,
  M., Versick, S., Stiller, G., Tylka, A., Fleming, E., 2011. Northern hemisphere atmospheric in-
  fluence of the solar proton events and ground level enhancement in January 2005. Atmospheric
  Chemistry and Physics 11, 6153–6166.

                                                16
Kocharov, L., Pohjolainen, S., Mishev, A., Reiner, M., Lee, J., Laitinen, T., Didkovsky, L., Pizzo,
  V., Kim, R., Klassen, A., Karlicky, M., Cho, K.S., Gary, D., Usoskin, I., Valtonen, E., Vainio,
  R., 2017. Investigating the origins of two extreme solar particle events: Proton source profile
  and associated electromagnetic emissions. Astrophysical Journal 839, 79.
Koldobskiy, S., Kovaltsov, G.A., Mishev, A., Usoskin, I.G., 2019. New Method of Assessment
  of the Integral Fluence of Solar Energetic (>1 GV Rigidity) Particles from Neutron Monitor
  Data. Solar Physics 294, 94. doi:10.1007/s11207-019-1485-8.
Krivolutsky, A., Klyuchnikova, A., Zakharov, G., Vyushkova, T., Kuminov, A., 2006.
  Dynamical response of the middle atmosphere to solar proton event of July 2000:
  Three-dimensional model simulations.   Advances in Space Research 37, 1602–1613.
  doi:10.1016/j.asr.2005.05.115.
Krivolutsky, A., Kuminov, A., Vyushkova, T., 2005. Ionization of the atmosphere caused by
  solar protons and its influence on ozonosphere of the earth during 1994-2003. Journal of
  Atmospheric and Solar-Terrestrial Physics 67, 105–117.
Kudela, K., Bučik, R., Bobik, P., 2008. On transmissivity of low energy cosmic rays in disturbed
  magnetosphere. Advances in Space Research 42, 1300–1306.
Kudela, K., Usoskin, I., 2004. On magnetospheric transmissivity of cosmic rays. Czechoslovak
  Journal of Physics 54, 239–254.
Liu, Y., Hayashi, K., 2006. The 2003 October-November fast halo coronal mass ejec-
  tions and the large-scale magnetic field structures. Astrophysical Journal 640, 1135–1141.
  doi:10.1086/500290.
Mavromichalaki, H., Papaioannou, A., Plainaki, C., Sarlanis, C., Souvatzoglou, G., Geronti-
 dou, M., Papailiou, M., Eroshenko, E., Belov, A., Yanke, V., Flückiger, E., Bütikofer, R.,
 Parisi, M., Storini, M., Klein, K.L., Fuller, N., Steigies, C., Rother, O., Heber, B., Wimmer-
 Schweingruber, R., Kudela, K., Strharsky, I., Langer, R., Usoskin, I., Ibragimov, A., Chilin-
 garyan, A., Hovsepyan, G., Reymers, A., Yeghikyan, A., Kryakunova, O., Dryn, E., Niko-
 layevskiy, N., Dorman, L., Pustil’Nik, L., 2011. Applications and usage of the real-time neu-
 tron monitor database. Advances in Space Research 47, 2210–2222.
Mironova, I., Aplin, K., Arnold, F., Bazilevskaya, G., Harrison, R., Krivolutsky, A., Nicoll, K.,
 Rozanov, E., Turunen, E., Usoskin, I., 2015. Energetic particle influence on the earth’s atmo-
 sphere. Space Science Reviews , 96.
Mironova, I., Usoskin, I., 2014. Possible effect of strong solar energetic particle events on polar
 stratospheric aerosol: A summary of observational results. Environmental Research Letters 9,
 015002.
Miroshnichenko, L., 2003. Radiation Hazards in Space, Astrophysics and Space Science Library
 297. Springer, Dordrecht.
Miroshnichenko, L., 2018. Retrospective analysis of GLEs and estimates of radiation risks. Jour-
 nal of Space Weather and Space Climate 8, A52. doi:10.1051/swsc/2018042.

                                                17
Miroshnichenko, L., Klein, K.L., Trottet, G., Lantos, P., Vashenyuk, E., Balabin, Y., Gvozdevsky,
 B., 2005. Relativistic nucleon and electron production in the 2003 October 28 solar event.
 Journal of Geophysical Research: Space Physics 110, A09S08. doi:10.1029/2004JA010936.

Mishev, A., Usoskin, I., 2016. Analysis of the ground level enhancements on 14 July 2000 and
 on 13 December 2006 using neutron monitor data. Solar Physics 291, 1225–1239.

Mishev, A., Usoskin, I., Raukunen, O., Paassilta, M., Valtonen, E., Kocharov, L., Vainio, R., 2018.
 First analysis of GLE 72 event on 10 september 2017: Spectral and anisotropy characteristics.
 Solar Physics 293, 136.

Mishev, A., Velinov, P., 2007. Atmosphere ionization due to cosmic ray protons estimated with
 CORSIKA code simulations. Comptes Rendus de L’Academie Bulgare des Sciences 60, 225–
 230.

Mishev, A., Velinov, P., 2010. The effect of model assumptions on computations of cosmic ray
 induced ionization in the atmosphere. Journal of Atmospheric and Solar-Terrestrial Physics 72,
 476–481.

Mishev, A., Velinov, P., 2011. Normalized ionization yield function for various nuclei obtained
 with full Monte Carlo simulations. Advances in Space Research 48, 19–24.

Mishev, A., Velinov, P., 2014. Influence of hadron and atmospheric models on computation of
 cosmic ray ionization in the atmosphere-extension to heavy nuclei. Journal of Atmospheric
 and Solar-Terrestrial Physics 120, 111–120.

Mishev, A., Velinov, P., 2015a. Determination of medium time scale ionization effects at various
 altitudes in the stratosphere and troposphere during ground level enhancement due to solar
 cosmic rays on 13.12.2006 (GLE 70). Comptes Rendus de L’Academie Bulgare des Sciences
 68, 1425–1430.

Mishev, A., Velinov, P., 2015b. Ionzation rate profiles due to solar and galactic cosmic rays during
 GLE 59 on Bastille day 14 July 2000. Comptes Rendus de L’Academie Bulgare des Sciences
 68, 359–366.

Mishev, A., Velinov, P., 2015c. Time evolution of ionization effect due to cosmic rays in terrestrial
 atmosphere during GLE 70. Journal of Atmospheric and Solar-Terrestrial Physics 129, 78–86.

Mishev, A., Velinov, P., 2018a. Ion production and ionization effect in the atmosphere during
 the Bastille day GLE 59 due to high energy SEPs. Advances in Space Research 61, 316–325.
 doi:10.1016/j.asr.2017.10.023.

Mishev, A., Velinov, P., 2018b. Ionization effects in the middle stratosphere due to cosmic rays
 during strong GLE events. Comptes Rendus de L’Academie Bulgare des Sciences 71, 523–528.

Mishev, A., Velinov, P., 2020. Ionization effect in the region of regener–pfotzer maximum due
 to cosmic rays during halloween gle events in october–november 2003. Comptes Rendus de
 L’Academie Bulgare des Sciences 73, 244–251.

                                                 18
Mishev, A., Velinov, P., Mateev, L., Tassev, Y., 2011. Ionization effect of solar protons in the
 earth atmosphere - case study of the 20 January 2005 SEP event. Advances in Space Research
 48, 1232–1237.

Mitthumsiri, W., Seripienlert, A., Tortermpun, U., Mangeard, P.S., Sáiz, A., Ruffolo, D.,
 Macatangay, R., 2017. Modeling polar region atmospheric ionization induced by the giant
 solar storm on 20 January 2005. Journal of Geophysical Research: Space Physics 122, 7946–
 7955. doi:10.1002/2017JA024125.

Moraal, H., McCracken, K., 2012. The time structure of ground level enhancements in solar cycle
 23. Space Science Reviews 171, 85–95.

Nevalainen, J., Usoskin, I., Mishev, A., 2013. Eccentric dipole approximation of the geomagnetic
  field: Application to cosmic ray computations. Advances in Space Research 52, 22–29.

Nicoll, K., Harrison, R., 2014. Detection of lower tropospheric responses to solar energetic
  particles at mid-latitudes. Physical Review Letters 112, 225001.

O’Brien, K., 1970. Calculated cosmic ray ionization in the lower atmosphere. Journal of Geo-
  physical Research 75, 4357–4359.

Paschalis, P., Mavromichalaki, H., Dorman, L., Plainaki, C., Tsirigkas, D., 2014. GEANT 4
  software application for the simulation of cosmic ray showers in the earth’s atmosphere. New
  Astronomy 33, 26–37. doi:10.1016/j.newast.2014.04.009.

Picone, J., Hedin, A., Drob, D., Aikin, A., 2002. NRLMSISE-00 empirical model of the atmo-
  sphere: Statistical comparisons and scientific issues. Journal of Geophysical Research: Space
  Physics 107, 1468.

Poluianov, S., Usoskin, I., Mishev, A., Shea, M., Smart, D., 2017. GLE and sub-GLE re-
  definition in the light of high-altitude polar neutron monitors. Solar Physics 292, 176.
  doi:10.1007/s11207-017-1202-4.

Porter, H., Jackman, C., Green, A., 1976. Efficiencies for production of atomic nitrogen and
  oxygen by relativistic proton impact in air. The Journal of Chemical Physics 65, 154–167.

Potgieter, M., 2013. Solar modulation of cosmic rays. Living Reviews in Solar Physics 10.

Randall, C., Harvey, V., Singleton, C., Bailey, S., Bernath, P., Codrescu, M., Nakajima, H., Rus-
  sell, J., 2007. Energetic particle precipitation effects on the southern hemisphere stratosphere
  in 1992-2005. Journal of Geophysical Research Atmospheres 112, D08308.

Regener, E., Pfotzer, G., 1935. Vertical intensity of cosmic rays by threefold coincidences in the
  stratosphere. Nature 136, 718–719.

Rozanov, E., Calisto, M., Egorova, T., Peter, T., Schmutz, W., 2012. Influence of the precipitating
  energetic particles on atmospheric chemistry and climate. Surveys in Geophysics 33, 483–501.

                                                19
Sinnhuber, M., Berger, U., Funke, B., Nieder, H., Reddmann, T., Stiller, G., Versick, S., Von Clar-
  mann, T., Wissing, J., 2018. Noy production, ozone loss and changes in net radiative heating
  due to energetic particle precipitation in 2002-2010. Atmospheric Chemistry and Physics 18,
  1115–1147. doi:10.5194/acp-18-1115-2018.
Thébault, E., Finlay, C.C., Beggan, C.D., Alken, P., Aubert, J., Barrois, O., Bertrand, F., Bondar,
  T., Boness, A., Brocco, L., Canet, E., Chambodut, A., Chulliat, A., Coı̈sson, P., Civet, F., Du,
  A., Fournier, A., Fratter, I., Gillet, N., Hamilton, B., Hamoudi, M., Hulot, G., Jager, T., Korte,
  M., Kuang, W., Lalanne, X., Langlais, B., Léger, J.M., Lesur, V., Lowes, F.J., Macmillan, S.,
  Mandea, M., Manoj, C., Maus, S., Olsen, N., Petrov, V., Ridley, V., Rother, M., Sabaka, T.J.,
  Saturnino, D., Schachtschneider, R., Sirol, O., Tangborn, A., Thomson, A., Tøffner-Clausen,
  L., Vigneron, P., Wardinski, I., Zvereva, T., 2015. International geomagnetic reference field:
  the 12th generation. Earth, Planets and Space 67, 79. doi:10.1186/s40623-015-0228-9.
Tsyganenko, N., 1989. A magnetospheric magnetic field model with a warped tail current sheet.
  Planetary and Space Science 37, 5–20.
Tsyganenko, N., 1995. Modeling the earth’s magnetospheric magnetic field confined within
  a realistic magnetopause. Journal of Geophysical Research:Space Physics 100, 5599–5612.
  doi:110.1029/94JA03193.
Tsyganenko, N., 2002. A model of the near magnetosphere with a dawn-dusk asymmetry. Journal
  of Geophysical Research: Space Physics 107. doi:10.1029/2001JA000219.
Usoskin, I., Bazilevskaya, G., Kovaltsov, G., 2011a. Solar modulation parameter for cosmic
  rays since 1936 reconstructed from ground-based neutron monitors and ionization chambers.
  Journal of Geophysical Research 116, A02104.
Usoskin, I., Gil, A., Kovaltsov, G., Mishev, A., Mikhailov, V., 2017. Heliospheric modulation
  of cosmic rays during the neutron monitor era: Calibration usingpamela data for 2006-2010.
  Journal of Geophysical Research 122, 3875–3887.
Usoskin, I., Kovaltsov, G., 2006. Cosmic ray induced ionization in the atmosphere: Full modeling
  and practical applications. Journal of Geophysical Research 111.
Usoskin, I., Kovaltsov, G., Mironova, I., Tylka, A., Dietrich, W., 2011b. Ionization effect of solar
  particle gle events in low and middle atmosphere. Atmospheric Chemistry and Physics 11,
  1979–1988.
Vainio, R., Desorgher, L., Heynderickx, D., Storini, M., Flückiger, E., Horne, R., Kovaltsov, G.,
  Kudela, K., Laurenza, M., McKenna-Lawlor, S., Rothkaehl, H., Usoskin, I., 2009. Dynamics
  of the earth’s particle radiation environment. Space Science Reviews 147, 187–231.
Velinov, P., Asenovski, S., Kudela, K., Lastovička, J., Mateev, L., Mishev, A., Tonev, P., 2013.
  Impact of cosmic rays and solar energetic particles on the earth’s ionosphere and atmosphere.
  Journal of Space Weather and Space Climate 3, A14.
Velinov, P., Mishev, A., Mateev, L., 2009. Model for induced ionization by galactic cosmic rays
  in the earth atmosphere and ionosphere. Advances in Space Research 44, 1002–1007.

                                                20
Verronen, P., Andersson, M., Kero, A., Enell, C.F., Wissing, J., Talaat, E., Kauristie, K., Palmroth,
  M., Sarris, T., Armandillo, E., 2015. Contribution of proton and electron precipitation to the
  observed electron concentration in October-November 2003 and September 2005. Annales
  Geophysicae 33, 381–394.

Vitt, F., Jackman, C., 1996. A comparison of sources of odd nitrogen production from 1974
  through 1993 in the earth’s middle atmosphere as calculated using a two-dimensional model.
  Journal of Geophysical Research Atmospheres 101, 6729–6739.

                                                 21
You can also read