Multifrequency Impedance Method Based on Neural Network for Root Canal Length Measurement - MDPI
←
→
Page content transcription
If your browser does not render page correctly, please read the page content below
applied
           sciences
Article
Multifrequency Impedance Method Based on Neural
Network for Root Canal Length Measurement
Xiaoyue Qiao , Zheng Zhang and Xin Chen *
 School of Electronic Information and Electrical Engineering, Shanghai Jiao Tong University, Shanghai 200240, China;
 xy1121@sjtu.edu.cn (X.Q.); zhangzheng123@sjtu.edu.cn (Z.Z.)
 * Correspondence: xchen.ie@sjtu.edu.cn

 Received: 3 September 2020; Accepted: 20 October 2020; Published: 22 October 2020

 Abstract: Root canal therapy is the most fundamental and effective approach for treating endodontics
 and periapicalitis. The length of the root canal must be accurately measured to clean the pathogenic
 substances in it. This study aims to present a multifrequency impedance method based on a neural
 network for root canal length measurement. A circuit system was designed which generates a current
 of frequencies from 100 Hz to 20 kHz in order to augment the data of impedance ratios with different
 combinations of frequencies. Several impedance ratios and other quantified characteristics, such as the
 type of tooth and file, were selected as features to train a neural network model that could predict the
 distance between the file and apical foramen. The model uses leave-one-out cross-validation, adopts the
 Adam optimizer and regularization, and has two hidden layers with nine and five nodes, respectively.
 The neural network-based multifrequency impedance method exhibits nearly 95% accuracy, compared
 with the dual-frequency impedance ratio method (which demonstrated no more than 85% accuracy
 in some situations). This method may eliminate the influence of human and environmental factors on
 measurement of the root canal length, thereby increasing measurement robustness.

 Keywords: root canal measurement; multifrequency impedance; data augmentation; neural network

1. Introduction
     At present, root canal therapy is the most effective treatment for pulpal and periapical diseases.
The keys to the process include thoroughly cleaning the root canal system, removing the source of
infection, and reducing the damage to the root tip and periapical tissue [1,2]. Thus, root canal therapy
requires accurate measurement of the length of root canals [3]. Three approaches exist for measurement of
root canal length: the hand feeling method, radiographic determination [4], and the use of an electronic
apex locator (EAL). The EAL, which is most commonly used for measuring root canal length in clinical
settings, has been developed over a long period using different methods [5].
     Root canal measurement was initially based on a resistance model, according to the phenomenon that
the direct current resistance between the apical foramen and oral mucosa is almost constant, although
the ages, tooth types, and root canal shapes of patients differ widely. The performance of this model
has generally been considered unsatisfactory, as the measurement does not reflect a simple resistance
model but, rather, a complex model with capacitor characteristics [6,7]. Then, root canal measurement was
carried out by a voltage gradient method, which was more accurate than before but still unstable [8,9].
A method based on dual-frequency impedance ratios was proposed in the 1990s. This method uses the
relative quantity instead of absolute quantity to make the results universal and reduce the effect of the

Appl. Sci. 2020, 10, 7430; doi:10.3390/app10217430                                    www.mdpi.com/journal/applsci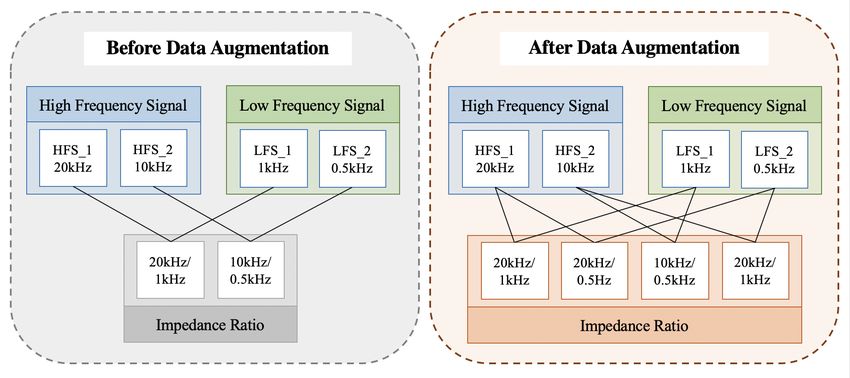
Appl. Sci. 2020, 10, 7430                                                                               2 of 13

measuring environment on the results [10]. Several EALs using the dual-frequency impedance ratios
method have demonstrated exceptional clinical performance [11,12]. The multifrequency impedance
method has been employed, based on the success of dual-frequency methods [13]; however, the EALs
found on the market using the multifrequency impedance method cannot measure the length of root canal
very precisely [14,15]. The reason for such low accuracy is that the measurement environment in the root
canal is extremely complex with infective substances and infected biological tissue. Deep learning methods
have superior ability to cope with challenging environmental noises, so it was considered appropriate
to apply a neural network for canal root length measurement. Data augmentation is also employed, as
the data are limited by the scarce signals at confined frequencies, which prevents the ability to train an
excellent neural network.
     Given the inadequacy of the current methodologies, this paper proposes a method for precisely
locating the position of the apical foramen using a multifrequency impedance method based on a neural
network, which is trained (after data augmentation) by distinct combinations of multifrequency signals
generated from the designed circuit system. The method is experimentally verified, demonstrating that
the proposed approach can promote accuracy and stability when measuring the length of root canals.

2. Material and Methods
     The dual-impedance ratio method selects the impedance ratio of one high frequency and one low
frequency as the criteria for locating the apical foramen; however, the level of accuracy is not ideal and the
method may be greatly affected by the measurement conditions. The multifrequency impedance method
proposed in this paper requires multiple impedance ratios of multiple frequency combinations and utilizes
the relationships between them to increase the reliability of the results. A large number of impedance
ratios of different frequency combinations are essential for high accuracy of measurement. With the data
augmentation of impedance ratios, a nonlinear regression model with the distance between the file and the
apical foramen as the prediction result is constructed based on deep learning methods. Neural networks
are the most widely used type of deep learning model, which exhibit excellent performance in solving
complex nonlinear regression problems [16,17]. Considering the delicate electrical properties of organisms,
deep learning plays a major role in detecting and processing bio-electric signals [18,19]. In a concrete
situation, the structure of the network can be targeted, designed, and optimized, making the model more
flexible and efficient. It is crucial to select appropriate features to improve the multifrequency impedance
method for root canal length measurement.

2.1. Multifrequency Impedance Measurement
     All of the measurement instruments and measuring methods used for the experiments were designed
and prepared to meet the research requirements. The impedance was measured on 21 extracted teeth that
had been treated and cleaned using a variable frequency voltage signal generated by a programmable
digital frequency synthesizer. The signal varied from 100 Hz to 20 kHz, and the impedances at different
frequencies were collected using automatic data collection (ADC) and stored in a computer. Figure 1
presents a schematic of the whole measurement process.
     Figure 2 illustrates the physical diagram of the measurement process and its constituent parts.
The 21 tooth samples were single root canal teeth from 21 adults of different ages, including incisors,
canines, and molars. The teeth were preprocessed in vitro by soaking them in a 2.5% sodium hypochlorite
solution and removing the periodontal tissues and attachments, such as dental calculus. The root canal
was washed after opening and removing the pulp. The crown of the tooth was polished as a reference
plane. A tooth fixation device was used to keep the relative position of the tooth constant during the
experiment, ensuring the consistency of the data. A precise file translation device was used to strictly
Appl. Sci. 2020, 10, 7430                                                                               3 of 13

control the change of distance by increments of 0.5 mm with an accuracy of 1 µm. One of the files of types
#15, #25, and #40 was fixed on the file translation to be located in the root canal. The root canal length
measurement prototype was designed to generate sine sweep signals with multiple frequencies and select
the impedance values. The impedance ratios of different frequency combinations could then be obtained
through data processing in the prototype.

                                Figure 1. Diagram of the measurement process.

     For each tooth, we changed the file distance from the root tip by +5 mm to −1 mm (where + denotes
that the file does not reach the apical foramen and − denotes that the file exceeds the apical foramen).

                                      Figure 2. Experimental equipment.

     Two theoretical tests were verified during this process: the impedance decreased with increasing
frequencies when the file was in the same position; the closer the file was to the apical foramen, the smaller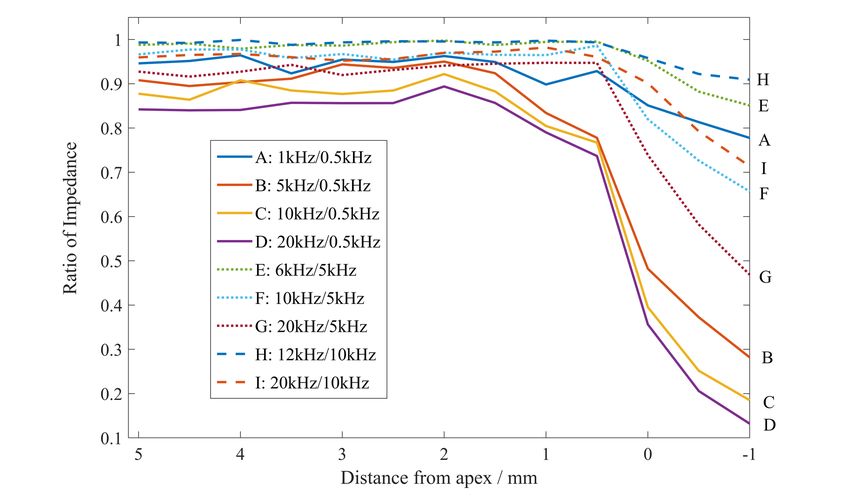
Appl. Sci. 2020, 10, 7430                                                                                   4 of 13

the impedance ratio, and the larger the frequency difference, the smaller the ratio. The detailed verification
is explained in the following results section (pre-verification).

2.2. Data Augmentation
     The impedance ratio was the software-processed output of the circuit system, as well as the critical
data in root canal length measurement. Its expression is as follows:

                                                               Z ( f high )
                                         Impedance Ratio =                  ,                                  (1)
                                                               Z ( f low )

where Z ( f high ) and Z ( f low ) are the impedances with the signal at high and low frequency separately. In the
circuit system, the ratio of impedance was calibrated with the impedance obtained by the detection of
signals through the root canal. Figure 3 shows the time domain diagram of an input signal and the signal
after it had passed through the root canal.

                             Figure 3. Time domain diagram of the acquisition signal.

     The signal input to channel A then passed through the measured root canal and was detected in
channel B. The frequency of the signal in Figure 3 exhibits a periodic variation with time (i.e., in the time
domain). The energy of the signal in the frequency domain after carrying out a fast Fourier transform was
uniformly distributed over this particular frequency. Other signals at different frequencies all exhibited
the same time and frequency domain characteristics. It was verified that the circuit system could generate
sine sweep signals meeting the measurement requirements. The output sine sweep signal was processed
to deduce the impedance of the root canal with this signal at a particular frequency.
     The circuit system emitted the sine sweep signals at different frequencies, corresponding to different
impedance values at the frequency. Two impedance values were combined together to calculate the
impedance ratio, which was used as the deep learning training data.
     The goal of the multifrequency impedance method based on deep learning is to train an advanced
neural network; therefore, the data had to be augmented before their substitution into the model.
The impedance ratio related to the root canal length is the ratio of impedance with a high and a low
frequency signal. The circuit can generate a current of frequencies from 100 Hz to 20 kHz, in which
an arbitrary high frequency signal and an arbitrary low frequency signal were combined to obtain the
impedance ratio, as shown in Figure 4.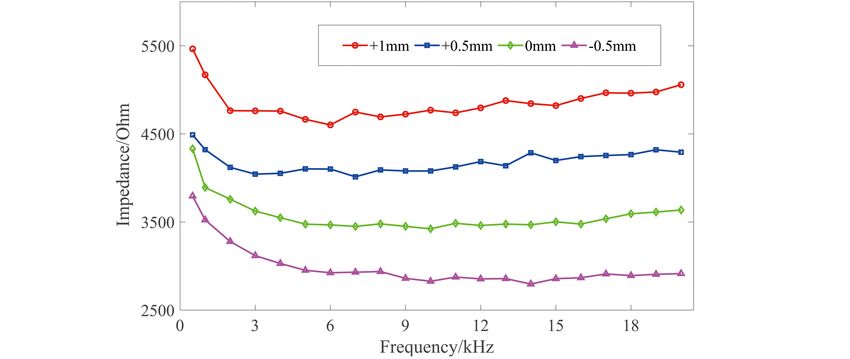
Appl. Sci. 2020, 10, 7430 5 of 13
Figure 4. Diagram of the data augmentation.
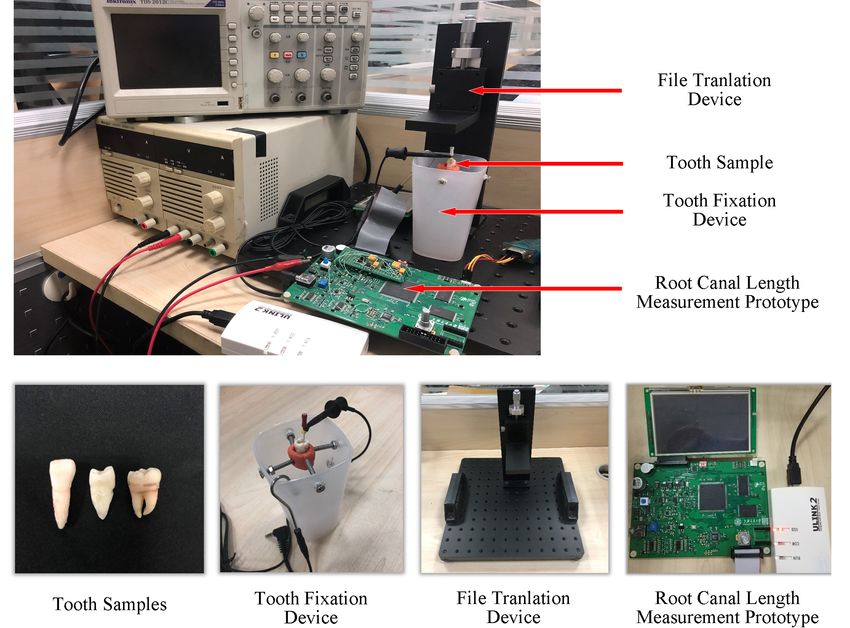
The multifrequency method utilizes the signals of more frequencies than the traditional
dual-frequency method. The impedance ratio data set was augmented by using arbitrary combinations of
high and low frequency signals. An example of data augmentation is shown in Figure 5.
Figure 5. An example of data augmentation.
For the two high frequency signals at 20 kHz and 10 kHz and the two low frequency signals at 0.5 kHz
and 1 kHz, the number of the impedance ratio can rise from two to four. It is obvious that the number of
data can be considerably increased through data augmentation. Moreover, the combinations containing
all the signals had an utmost use in the measurements in order to avoid exceptions. The accuracy of the
proposed multifrequency impedance method based on deep learning could be improved significantly by
training the neural network with the augmented data.
2.3. Feature Selection
The data were augmented using combinations of multiple frequencies. The accuracy of root canal
length measurement could be increased after the sufficient impedance ratios were available. Features were
selected according to the divergence and correlation between features and goals [20]. Filtering is one of the
most commonly used methods for feature selection in deep learning in order to develop a rule to measure
each feature and sort all features by their importance with respect to the target attribute. The first step was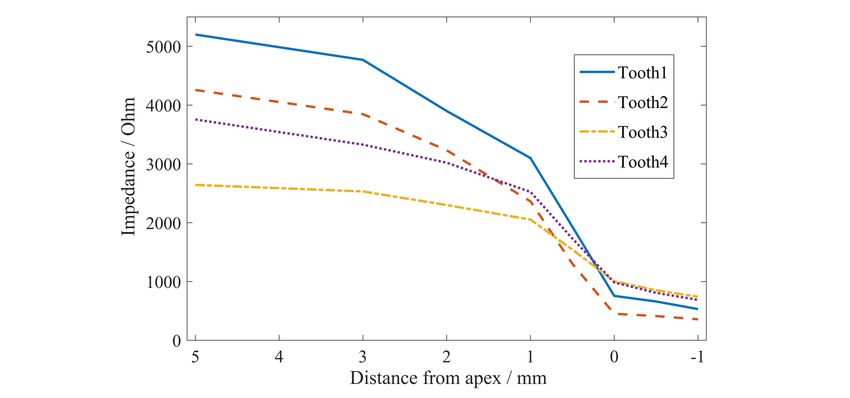
Appl. Sci. 2020, 10, 7430                                                                                6 of 13

to calculate the variance of each feature, where features with variance below the threshold were deleted.
The next step was to calculate the correlation coefficient of each remaining feature to the label. In addition,
the features for the training model also required the numerical characteristics of the measuring conditions,
such as tooth and file types. We used one-hot encoding to convert these non-numerical attributes into
numerical features, as shown in Table 1.

                                   Table 1. One-hot encoding for tooth types.

                                   Tooth Type    Incisor    Canine    Molar
                                    Sample 1        1          0        0
                                    Sample 2        0          1        0
                                    Sample 3        0          0        1

     Among the large amount of augmented data (i.e., impedance ratios), based on the model performance
and convenience of calculation, the top ten groups of impedance ratios—as ranked by the correlation
coefficient—were selected (5 kHz/0.5 kHz, 8 kHz/0.5 kHz, 10 kHz/0.5 kHz, 12 kHz/0.5 kHz,
15 kHz/0.5 kHz, 20 kHz/0.5 kHz, 8 kHz/1 kHz, 10 kHz/1 kHz, 15 kHz/1 kHz, and 20 kHz/1 kHz),
together with tooth type and file type, as the features for the model.

2.4. Neural Network Model
     The neural network model used in this study is presented in Figure 6. The input layer takes the
selected features as inputs, the output of the output layer is the distance between the file and apical
foramen predicted by the model, and the hidden layer is used to enhance the nonlinearity of the model.
The activation function used is the sigmoid function.

                                Figure 6. Schematic of neural network structure.

     One of the Momentum, Adam [21], and SGD optimizers is selected as an optimum optimizer to
accelerate the training of a neural network model. Considering that the small data set used increased
the risk of overfitting, some noise was added to the training set during the training phase [22] and
regularization was applied in the training process to enhance the generalization ability [23].

3. Results

3.1. Pre-Verification
    Before the training of the neural network for root canal length measurement, the experimental results
were discussed through the relationships between impedance values and different variables in order to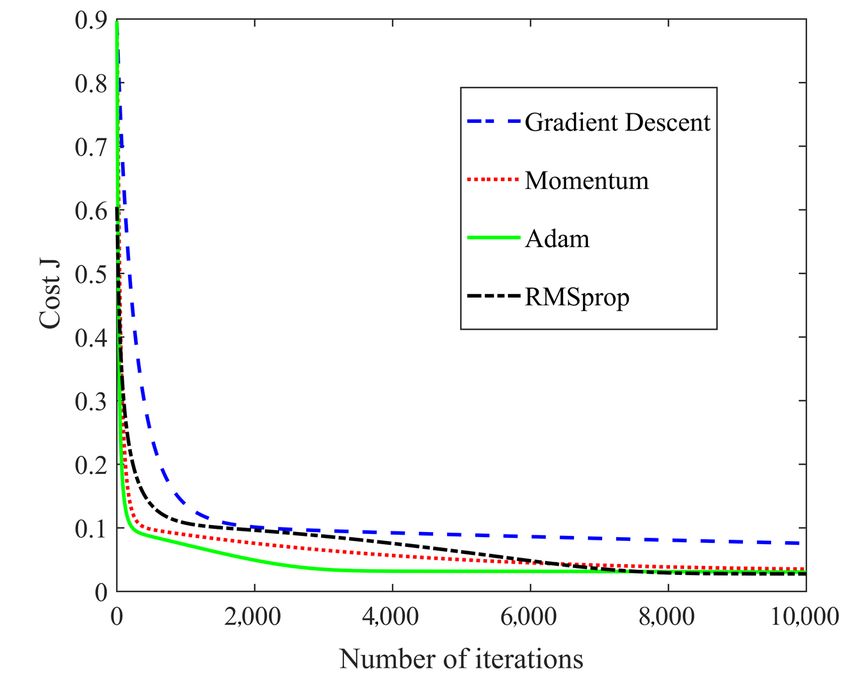
Appl. Sci. 2020, 10, 7430                                                                                   7 of 13

determine that the theories about the impedance characteristics of teeth are correct, which can verify the
feasibility of the method in this study.

3.1.1. Impedance Verification
     The impedance of the root canal is related to the tooth type, input signal frequency, and the distance
from file to apical foramen. We took these three factors in turn as independent variables in order to observe
their effects on the dependent variable of impedance.
     First, some different tooth samples were selected to observe the root canal impedance.
     Figure 7 illustrates the impedances of four kinds of selected teeth with several input signals.
The selected teeth differed in terms of type and age, but the impedance trends of each tooth type were
similar. The impedance of all the teeth decreased with the increase of frequency, thus guaranteeing that
the impedance ratio method is reasonable.
     For these four selected teeth, the relationships between the impedance of different teeth and the
position of file are presented in Figure 8. The frequency was fixed.
     It was found that the impedance changed smoothly when the file was far away from the apical
foramen, while the impedance decreased rapidly when the file was close to the apical foramen. In particular,
the impedance varied the most within 1 mm of the file from the apical foramen. Moreover, when the
distance from apex was 0 mm (i.e., the file was at the position of the apical foramen), there was not much
difference among the impedances of different tooth samples. The results in Figure 8 provide a theoretical
basis for the multifrequency impedance ratio method for root canal length measurement.

               Figure 7. The impedance of different input signal frequencies varying with the tooth type.

     In the next step, the tooth type was kept constant. The impedance of the file at various positions from
the apical foramen varying with frequency was explored.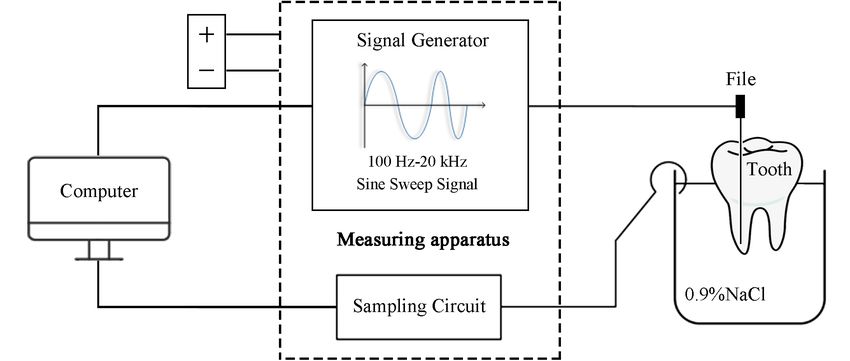
Appl. Sci. 2020, 10, 7430                                                                                        8 of 13

    Figure 8. The impedance of different teeth varying with the distance between the file and the apical foramen.

     As shown in Figure 9, the impedance decreased as the frequency increased, regardless of the distance
between the file and apical foramen. These phenomena verified the correctness of the early methods for
root canal length measurement, as well as the reliability of the proposed measurement system.
     When the frequency increased to approximately 20 kHz, the impedance almost stopped increasing.
Therefore, setting the highest frequency as 20 kHz barely affects the subsequent analysis of experimental
results when the impedance ratios of different frequency combinations were calculated. It was considered
sufficient to conclude the experiments with the frequency ranging up to 20 kHz.

         Figure 9. The impedance of the file at different position from apical foramen varying with frequency.

3.1.2. Frequency Ratio Verification
     The impedance ratios were calculated with multiple combinations of frequencies in order to
find out the optimal frequency ratio. It is possible to compare the performance in these subsequent
experiments with the neural network-based multifrequency impedance method for root canal length
measurement. In addition, frequency ratio verification provided a reference for the following feature
selection and evaluation.
     The impedance ratio results, according to the frequency combinations, are illustrated in Figure 10.
The tooth type and the file were kept constant.
Appl. Sci. 2020, 10, 7430 9 of 13
Figure 10. The impedance ratios of nine groups of frequency combinations varying with the distance
between the file and the apical foramen (molar, #15).
In Figure 10, the impedance ratios did not change significantly when the file was far from the apical
foramen. When it was close to the apical foramen (especially when the distance was less than 1 mm),
the impedance ratio dropped rapidly, while the gradient was steepest at the apical foramen. Moreover,
the larger the difference between the high and low frequencies, the more significantly the impedance
decreased when the file was close to the apical foramen; in contrast, it was not beneficial to determine the
position of the file. The data for Figure 10 were obtained under the conditions of a molar tooth type and
file #15; the curve trend was similar for other conditions.
The aforementioned phenomena correspond with feature selection. The impedance ratios selected
as features with large variances were the impedance ratios of substantially divergent high and
low frequencies.
3.2. Neural Network Training
The sample set was taken from numerous measurements of 21 teeth with multifrequency signals
combinations. Due to the lack of tooth samples, leave-one-out (LOO) cross-validation was used to
evaluate the performance of the neural network and to prevent overfitting [24]. For the 21 tooth samples,
the LOO-based validation was performed with 21 iterations. In each iteration, the neural network was
trained with the data set of 20 samples and tested on the remaining sample. According to the loss curve in
Figure 11, a suitable optimizer was selected. The mean values of accuracy of the training and test sets after
all iterations were calculated as indicators to assess the generalizability of the model. The performance
of the neural network model with different structures using the LOO method is depicted in Figure 12.
It should be noted that a large number of structures with different layers and nodes were verified, while a
few of these results were selected to display. A highly effective model should possess both low bias and low
variance. High performance on the training set reflects low bias but can cause overfitting, which suggests
high variance. Therefore, point E represented the best structure.Appl. Sci. 2020, 10, 7430 10 of 13
Figure 11. Loss curves with different optimizers.
As evident from Figures 11 and 12, the neural network model eventually developed had two hidden
layers, where the numbers of nodes in the hidden layers were nine and five, respectively. A neural
network with no more than three layers was sufficient for the uncomplicated data set of impedance, tooth
type, and file type, while it was identified that the performance with three layers was not good enough
(especially point K). More layers can make the training process more complicated and can prevent the
model from converging, leading to overfitting. The optimization method used for training was Adam;
furthermore, regularization was added.
Figure 12. Performances of neural network models with different structures.
The 21 teeth were divided into three groups, according to the types of tooth and file: Group 1—molar,
#15(6); Group 2—molar, #25(6); and Group 3—canine, #15(9). Table 2 presents a comparison of theAppl. Sci. 2020, 10, 7430 11 of 13
performance of the dual-impedance ratio method and the neural network-based multifrequency method.
Four pairs of frequencies were selected for the impedance ratios: 5 kHz/0.5 kHz, 10 kHz/0.5 kHz,
10 kHz/1 kHz, and 20 kHz/1 kHz.
For the dual-frequency impedance ratio method, using the average impedance ratio of 21 teeth to
determine the apical foramen was not appropriate for Group 1. This was because there were three teeth
in Group 1 for which the dual-frequency impedance ratio at the 0 mm position was quite different from
the average impedance ratio. By contrast, the neural network-based multifrequency method could solve
this problem, had a high accuracy rate, was less affected by changes in tooth and file type, and exhibited
decent robustness.
Table 2. Performances of the impedance ratio method and neural network-based multifrequency method.
Frequency Combination (kHz) Group 1 Group 2 Group 3 Total
5/0.5 66.67% 83.33% 100.00% 85.71%
10/0.5 50.00% 83.33% 100.00% 80.95%
10/1 50.00% 83.33% 89.89% 76.19%
Multifrequency 83.33% 100.00% 100.00% 95.24%
The experimental results indicated that the proposed measurement method is relatively robust and
improved the effects of measuring factors on the results. The experiments in this study may not have been
perfect, however. Further improvements in accuracy can be considered, based on the following aspects:
improving the neural network structure, using different judgment strategies, using different optimization
methods and, most importantly, expanding the data set.
3.3. Discussions Compared with EALs
The development of EALs has been a long and continual process, which seems to lag behind the rapid
development of modern medical technology. After the impedance ratio method was established, only
a few studies researched means by which to select two proper frequencies to enhance the performance
of third-generation EALs [25–27]; however, no landmark improvement has emerged in the field of root
canal length measurement until the present study. Although the measurements of fourth-generation EALs
seem to be more accurate, their actual performance does not present a great improvement, compared
with the benchmark of the third-generation product—Root ZX—according to product comparison
experiments [28,29]. In addition, in actual surveys, many dentists have provided feedback that they
are more inclined to use third-generation products (e.g., Root ZX) as, in clinical settings, the third- and
fourth-generation EALs differ little in accuracy; furthermore, the older models are more stable and cheaper.
Root ZX is an excellent product, but it is not perfect; doctors often must use radiography as an aid to
obtain accurate results when employing RootZX [30].
Obviously, much room still exists for improvement in the development of EALs. Machine learning is a
popular subject, which has been widely used in the medical field and has promoted the rapid development
of medical technology [31]. The method proposed in this paper combines the multifrequency impedance
ratio method and neural networks. In fact, an EAL can be regarded as a prediction system or nonlinear
regression model, considering that the measuring conditions have a critical influence on the results.
Therefore, the impedance ratios remaining after feature selection and the numerical measuring factors can
be used as the features. Neural networks possess great advantages in formulating such prediction models.
The experimental results indicated that the proposed measurement method is relatively robust and
can improve the effects of measuring factors on the results. The experiments in this study may not have
been perfect, however. Further improvements in accuracy can be considered based on the followingAppl. Sci. 2020, 10, 7430 12 of 13
aspects: improving the neural network structure, using different judgment strategies, using different
optimization methods and, most importantly, expanding the data set.
4. Conclusions
The method proposed in this paper combined the multifrequency impedance ratio method and
neural networks. To increase the accuracy of the model, the impedance ratio data were augmented
with different combinations of currents at various frequencies generated by the designed circuit system.
The pre-verification of impedance was performed to provide theoretical support for training the neural
network. Impedance, tooth type, and file type were selected as features in the model. Leave-one-out
cross-validation was used during the training process due to the limited tooth samples. An optimal
neural network was determined according to the performances of neural network models with different
structures. Compared with the dual-frequency impedance ratio method, the proposed approach can
reduce the influence of measuring factors on the measurement results, increase the measurement accuracy,
and enhance the robustness.
Author Contributions: Conceptualization, X.Q., Z.Z., and X.C.; methodology, Z.Z. and X.C.; software, Z.Z.; validation,
Z.Z.; formal analysis, X.Q. and Z.Z.; investigation, X.Q.; resources, X.C.; data curation, X.Q.; writing—original
draft preparation, Z.Z.; writing—review and editing, X.Q.; supervision, X.C.; project administration, X.C.; funding
acquisition, X.C. All authors have read and agreed to the published version of the manuscript.
Funding: This research was funded by the National Key Research and Development Program of China
(No. 2019YFF0216401) and the Major projects of Science and Technology Commission of Shanghai (No. 17JC1400800).
Conflicts of Interest: The authors declare no conflict of interest.
References
1. Gordon, M.; Chandler, N.T. Electronic apex locators. Int. Endod. J. 2004, 37, 425–437. [CrossRef] [PubMed]
2. Minetti, E.; Palermo, A.; Ferrante, F.; Schmitz, J.H.; Lung Ho, H.K.; Hann, D.; Ng, S.; Giacometti, E.; Gambardella,
U.; Contessi, M.; et al. Autologous Tooth Graft after Endodontical Treated Used for Socket Preservation:
A Multicenter Clinical Study. Appl. Sci. 2019, 9, 5396. [CrossRef]
3. Razumova, S.; Brago, A.; Howijieh, A.; Barakat, H.; Kozlova, Y.; Baykulova, M. Evaluation of Cross-Sectional Root
Canal Shape and Presentation of New Classification of Its Changes Using Cone-Beam Computed Tomography
Scanning. Appl. Sci. 2020, 10, 4495. [CrossRef]
4. Lee, J.; Lee, S.H.; Hong, J.R.; Kum, K.Y.; Oh, S.; Al-Ghamdi, A.S.; Al-Ghamdi, F.A.; Mandorah, A.O.; Jang, J.H.;
Chang, S.W. Three-Dimensional Analysis of Root Anatomy and Root Canal Curvature in Mandibular Incisors
Using Micro-Computed Tomography with Novel Software. Appl. Sci. 2020, 10, 4385. [CrossRef]
5. Yildirim, C.; Aktan, A.M.; Karataslioglu, E.; Aksoy, F.; Isman, O.; Culha, E. Performance of theWorking
Length Determination using Cone Beam Computed Tomography, Radiography and Electronic Apex Locator, in
Comparisons to Actual Length. Iran. J. Radiol. 2017, 14, 1.
6. Marjanović, T.; Lacković, I.; Stare, Z. Comparison of electrical equivalent circuits of human tooth used for
measuring the root canal length. Automatika 2011, 52, 39–48. [CrossRef]
7. Meredith, N.; Gulabivala, K. Electrical impedance measurements of root canal length. Dent. Traumatol. 1997, 13,
126–131. [CrossRef]
8. Ushiyama, J. New principle and method for measuring the root canal length. J. Endod. 1983, 9, 97–104. [CrossRef]
9. Kobayashi, C. Electronic canal length measurement. Oral Surg. Oral Med. Oral Pathol. Oral Radiol. Endod. 1995,
79, 226–231. [CrossRef]
10. Kobayashi, C.; Suda, H. New electronic canal measuring device based on the ratio method. J. Endod. 1994, 20,
111–114. [CrossRef]
11. Ali, R.; Okechukwu, N.C.; Brunton, P.; Nattress, B. An overview of electronic apex locators: Part 2. Br. Dent. J.
2013, 214, 227–231. [CrossRef]Appl. Sci. 2020, 10, 7430 13 of 13
12. Üstün, Y.; Aslan, T.; Şekerci, A.E.; Sağsen, B. Evaluation of the reliability of cone-beam computed tomography
scanning and electronic apex locator measurements in working length determination of teeth with large periapical
lesions. J. Endod. 2016, 42, 1334–1337. [CrossRef]
13. Nekoofar, M.H.; Ghandi, M.M.; Hayes, S.J.; Dummer, P.M. The fundamental operating principles of electronic
root canal length measurement devices. Int. Endod. J. 2016, 37, 595–609. [CrossRef]
14. Stober, E.K.; Duran-Sindreu, F.; Mercade, M.; Vera, J.; Bueno, R.; Roig, M. An evaluation of root ZX and iPex apex
locators: an in vivo study. J. Endod. 2011, 37, 608–610. [CrossRef] [PubMed]
15. Welk, A.R.; Baumgartner, J.C.; Marshall, J.G. An in vivo comparison of two frequency-based electronic apex
locators. J. Endod. 2003, 29, 497–500. [CrossRef] [PubMed]
16. Specht, D.F. A general regression neural network. IEEE Trans. Neural Netw. 1991, 2, 568–576. [CrossRef] [PubMed]
17. Goldberg, Y. Neural network methods for natural language processing. Synth. Lect. Hum. Lang. Technol. 2017, 10,
1–309. [CrossRef]
18. Duan, F.; Dai, L. Recognizing the gradual changes in sEMG characteristics based on incremental learning of
wavelet neural network ensemble. IEEE Trans. Ind. Electron. 2017, 64, 4276–4286. [CrossRef]
19. Zhang, Z.; Duan, F.; Sole-Casals, J.; Dinares-Ferran, J.; Cichocki, A.; Yang, Z.; Sun, Z. A novel deep learning
approach with data augmentation to classify motor imagery signals. IEEE Access 2019, 7, 15945–15954. [CrossRef]
20. Guyon, I.; Elisseeff, A. An introduction to variable and feature selection. J. Mach. Learn. Res. 2003, 3, 1157–1182.
21. Ruder, S. An overview of gradient descent optimization algorithms. arXiv 2016, arXiv:1609.04747.
22. Tanner, M.A.; Wong, W.H. The calculation of posterior distributions by data augmentation. J. Am. Stat. Assoc.
1987, 82, 528–540. [CrossRef]
23. Zou, H.; Hastie, T. Regularization and variable selection via the elastic net. J. R. Stat. Soc. Ser. B Stat. Methodol.
2015, 67, 301–320. [CrossRef]
24. Wong, T.T. Performance evaluation of classification algorithms by k-fold and leave-one-out cross validation.
Pattern Recognit. 2015, 48, 2839–2846. [CrossRef]
25. Jan, J.; Krizaj, D. Accuracy of root canal length determination with the impedance ratio method. Int. Endod. J.
2009, 42, 819–826. [CrossRef] [PubMed]
26. Kim, D.W.; Nam, K.C.; Lee, S.J. Development of a frequency-dependent-type apex locator with automatic
compensation. Crit. Rev.TM Biomed. Eng. 2000, 28, 473–479. [CrossRef]
27. Nam, K.C.; Kim, S.C.; Lee, S.J.; Kim, Y.J.; Kim, N.G.; Kim, D.W. Root canal length measurement in teeth with
electrolyte compensation. Med. Biol. Eng. Comput. 2002, 40, 200. [CrossRef]
28. Martins, J.N.; Marques, D.; Mata, A.; Carames, J. Clinical efficacy of electronic apex locators: Systematic review.
J. Endod. 2014, 40, 759–777. [CrossRef]
29. Vasconcelos, B.C.; Bueno Mde, M.; Luna-Cruz, S.M.; Duarte, M.A.; Fernandes, C.A. Accuracy of five electronic
foramen locators with different operating systems: An ex vivo study. J. Appl. Oral Sci. 2013, 21, 132–137.
[CrossRef]
30. Nawab, S.; Rana, M.J.A.; Yar, A. Comparative evaluation of working length with digital radiography and third
generation electronic apex locator. Pak. Oral Dent. J. 2016, 36, 308–311.
31. Deo, R.C. Machine Learning in Medicine. Circulation 2015, 132, 1920–1930. [CrossRef] [PubMed]
Publisher’s Note: MDPI stays neutral with regard to jurisdictional claims in published maps and institutional
affiliations.
c 2020 by the authors. Licensee MDPI, Basel, Switzerland. This article is an open access
article distributed under the terms and conditions of the Creative Commons Attribution
(CC BY) license (http://creativecommons.org/licenses/by/4.0/).You can also read