In-depth Benchmarking of Deep Neural Network Architectures for ECG Diagnosis
←
→
Page content transcription
If your browser does not render page correctly, please read the page content below
Proceedings of Machine Learning Research 126:1–19, 2021               Machine Learning for Healthcare

          In-depth Benchmarking of Deep Neural Network
                  Architectures for ECG Diagnosis

Naoki Nonaka                                                            naoki.nonaka@riken.jp

Jun Seita                                                                    jun.seita@riken.jp
Advanced Data Science Project,
RIKEN Information R&D and Strategy Headquarters,
Tokyo, Japan

Editor: Editor’s name

                                                Abstract
     The electrocardiogram (ECG) is a widely used device to monitor the electrical activity
     of the heart. To diagnose various heart abnormalities, ECG diagnosis algorithms have
     been developed and deep neural networks (DNN) have been shown to achieve significant
     performance. Most of the DNN architectures used for ECG diagnosis models are adopted
     from architectures developed for image or natural language domain, and their performances
     have improved year by year in the original domains. In this work, we conduct in-depth
     benchmarking of DNN architectures for ECG diagnosis. Using three datasets, we compared
     nine DNN architectures for both multi-label classification settings evaluated with ROC-
     AUC score and multi-class classification settings evaluated with F1 scores. The results
     showed that one of classical architectures, ResNet-18, performed consistently better over
     most of architectures, suggesting there is room for developing DNN architecture tailored
     for ECG domain.

1. Introduction
The electrocardiogram (ECG) is a widely used device to monitor the electrical activity of the
heart and is essential in the diagnosis of cardiovascular disease. In order to diagnose cardiac
abnormalities, ECG signals must be reviewed by a physician with specialized knowledge.
It is a burdensome task for the physician to keep monitoring the signals that change over
time. In order to reduce this burden, models that automatically classify ECG abnormalities
have been developed and are being used as automatic diagnosis systems.
    Among the models for automatic diagnosis of ECG abnormalities, models based on deep
neural networks (DNN) have shown significant performance. DNNs have outperformed
conventional methods in areas such as image classification, natural language processing,
and speech recognition (Szegedy et al., 2015; He et al., 2016; Bahdanau et al., 2014; Devlin
et al., 2018; Graves et al., 2013). For the task of image classification, the ImageNet dataset,
CIFAR-10, CIFAR-100, and other datasets have been used as benchmarks to compare the
performance of different architectures. Although ECG classification models using DNNs
show strong performance in each case, suitable DNN architectures for ECG data is unknown.

© 2021 N. Nonaka & J. Seita.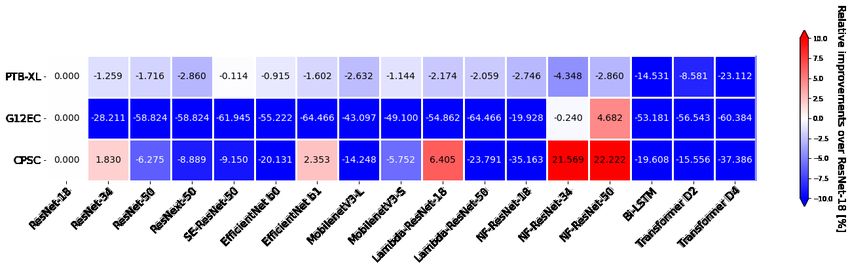
In-depth Benchmarking of Deep Neural Network Architectures for ECG Diagnosis
Many models for classifying ECG data have been proposed through competitions. The
effectiveness of models using ResNet (Hannun et al., 2019), which is used for image classifi-
cation, and models using SE-ResNet has been reported (Zhu et al., 2020; Zhao et al., 2020).
Additionally, models using a Transformer architecture, which were originally introduced in
machine translation tasks, have also shown significant performance when combined with
hand-crafted features (Natarajan et al., 2020). Models proposed at competitions combine
DNNs and hand crafted features (Hong et al., 2017; Teijeiro et al., 2017), thus making it
difficult to compare and investigate pure DNN architecture suitable for ECG classification.
In this work, we compared the performance of nine DNN architectures for ECG diagno-
sis with three datasets. First, we searched hyperparameters for each DNN architecture to
determine the optimal training setting. Subsequently, we conducted multiple experiments
under different data splits and compared the average values of the test set scores. We tested
two types of tasks, namely multi-label classification and multi-class classification. In the
multi-label classification setting, models were trained to predict multiple labels simultane-
ously and evaluated with macro averaged ROC-AUC score. In the multi-class classification
setting, we selected atrial fibrillation (AF), first-degree atrioventricular block (I-AVB), left
bundle branch block (LBBB) and right bundle branch block (RBBB) as target diagnoses.
We evaluated the result of multi-class classification with macro average of F 1.
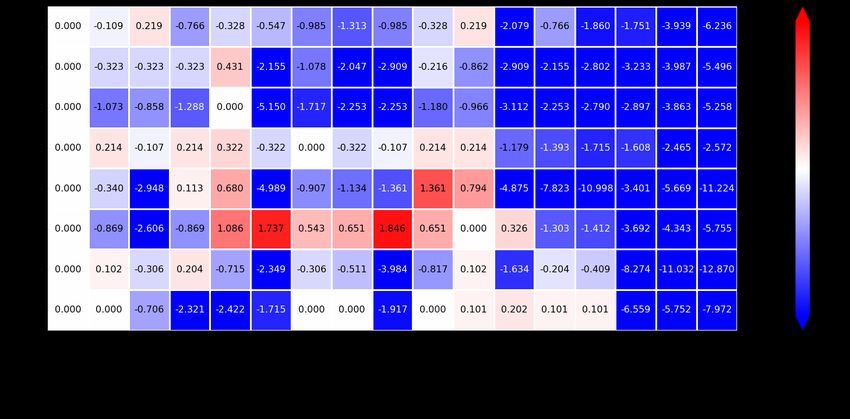
Figure 1: Box plot of relative improvements of macro averaged ROC-AUC score over
ResNet-18 model on multi-label classification tasks. Box plot summarizes eight multi-label
classification tasks. Each classification task is conducted five times. Hyperparameters were
optimized for each architecture individually.
Generalizable Insights about Machine Learning in the Context of Healthcare
DNNs have driven substantial advances and demonstrated dramatic improvement of state
of the art in tasks like image recognition, machine translation and speech recognition. In the
2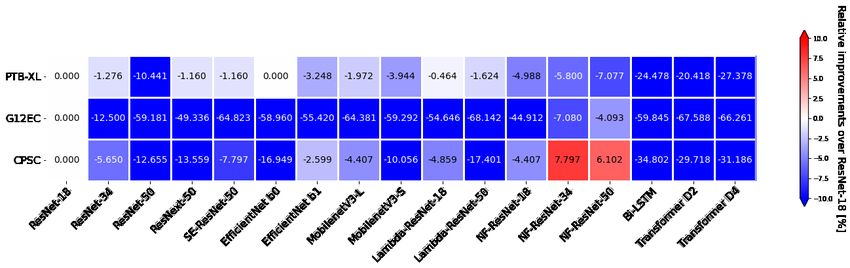
In-depth Benchmarking of Deep Neural Network Architectures for ECG Diagnosis

image domain, where most of the architectures experimented were originally proposed, their
performances have improved year by year. However, as shown in Figure 1, we observed lim-
ited improvements of classification accuracy over ResNet-18, shallow and simple architecture
compared to other convolutional neural network based architectures. This result indicates
performance of DNN architectures in the ECG domain does not necessarily correlate with
that of the image domain. Hence, suggesting a necessity of exploring and developing an
architecture suitable for target data domain, rather than just adapting architecture from
image or natural language domain.

2. Related Work
DNN architectures have been developed mainly in domains such as images and natural
language, where the amount of available data is abundant. In image classification, the Im-
ageNet dataset is used as a measure of the classification performance of an architecture.
ImageNet is a task to classify approximately 1.2 million images into 1, 000 classes (Rus-
sakovsky et al., 2015). For image classification architectures, such as ResNet (He et al.,
2016) and EfficientNet (Tan and Le, 2019), the classification accuracy on ImageNet dataset
is used to compare the performance under the same condition. As a benchmark for natural
language processing, datasets such as SQuAD (Rajpurkar et al., 2016) and WMT are used
to compare performance of various DNN architectures. On the other hand, the DNN archi-
tectures used for ECG classification adopts architectures used in image classification tasks
without comparison in ECG datasets.
    Various DNN models to classify ECG data have been proposed, and Hannun et al. (2019)
have shown DNN models efficacy by comparing them to human cardiologists. Some of the
proposed DNN models for ECG classification have been proposed through data analysis
competitions, such as PhysioNet/Computing in Cardiology Challenge (PhysioNet)(Clifford
et al., 2017; Alday et al., 2020). However, the main focus of these models are to improve the
classification accuracy, thus proposed models were combined with various techniques such
as use of hand crafted features (Hong et al., 2017; Teijeiro et al., 2017; Natarajan et al.,
2020). As a result, it is difficult to compare the performance of the DNN architecture alone.
    In an attempt to compare classification performance of DNN architectures on ECG
data, Strodthoff et al. (2020) have compared several DNN architectures using PTB-XL
dataset (Wagner et al., 2020). Strodthoff et al. (2020) have compared DNN architectures
like ResNet, bidirectional LSTM (Hochreiter and Schmidhuber, 1997) and Inception (Fawaz
et al., 2020) model for ECG data. In this study, we extend the work of Strodthoff et al.
(2020) in two directions: adding datasets and adding architectures.

3. Dataset
In this study, we compared DNN architectures in ECG classification tasks. Three datasets,
PTB-XL, G12EC and CPSC, were used for validation. Summary of the datasets are shown
in Table 1. The models were compared in two tasks: the multi-label classification task,
which uses the same model to classify multiple labels simultaneously, and the multi-class
classification task, which focuses on a specific diagnostic class. In this section, we describe
the brief overview of the datasets and preprocessing procedures applied to the dataset.

                                              3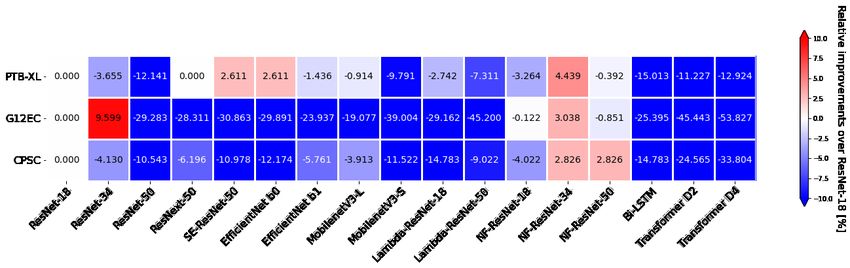
In-depth Benchmarking of Deep Neural Network Architectures for ECG Diagnosis

                     Table 1: Summary of dataset used in experiments.

                                            PTB-XL      G12EC       CPSC
                 Number of leads              12          12           12
                 Location of collection    Germany       USA        China
                 Number of samples          21, 837     10, 344      6, 877
                 Length of samples          10 sec      10 sec    6 − 60 sec
                 Number of classes            50          64            9
                 Sampling frequency         500 Hz      500 Hz      500 Hz

3.1. PTB-XL dataset
The PTB-XL dataset (Wagner et al., 2020) is a 12-lead ECG dataset collected in Germany.
The dataset contains 21, 837 ECGs of 10 seconds in length recorded at 500 Hz. The label
information assigned to each sample belongs to one of the categories diagnostic, form, or
rhythm, and there are 50 labels in total. In addition, labels belonging to the diagnostic
categories are assigned information on the sub-diagnostic class, which summarizes similar
classes, and the super-diagnostic class, which further summarizes them. We constructed
sub-datasets for the multi-label classification task and the multi-class classification task
based on the label information assigned to the dataset.
    In this study, for a multi-label classification task, we followed the settings of a previous
study (Strodthoff et al., 2020), and prepared six sub-datasets (all, diagnostic, sub-diagnostic,
super-diagnostic, rhythm, and form) for the experiment. For the multi-class classification
task, we used “all” sub-dataset and reassigned one of normal, target diagnostic class, or
other class labels to each sample. For each sub-dataset, we split the train, valid, and test
sets into a size of 8:1:1 based on the stratified split index originally assigned to the dataset.
After splitting, we calculated the mean and variance for each lead based on the samples in
the train set, and normalized all samples in the train, valid, and test sets based on these
values.

3.2. Georgia 12-Lead ECG Challenge Database
The Georgia 12-Lead ECG Challenge Database (G12EC) (G12, 2020) is a dataset of 12-
lead ECGs collected in the US, consisting of 10, 344 samples. The ECGs collected were
recorded at 500 Hz with a length of 10 seconds. There are 64 different labels in the G12EC
dataset, and unlike PTB-XL, there is no categorization of labels. In this study, we used 30
labels that were assigned to more than 1% of the total 10, 344 samples in both multi-label
classification and multi-class classification tasks.
    Preprocessing for G12EC was performed in the same way as for PTB-XL. To split the
data into train, valid, and test sets, we used multi-label stratification to evenly split the 30
class labels. The size of the split was set to 8:1:1 as in the case of PTB-XL. After splitting
the dataset, we calculated the mean and variance of each lead based on the samples in the
train set as in the case of the PTB-XL dataset, and normalized all samples in the train,
valid, and test based on these values.

                                               4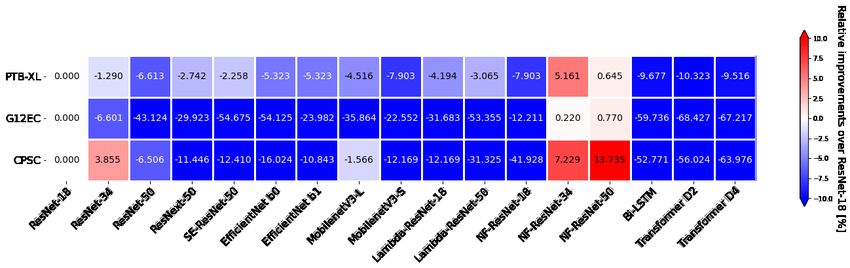
In-depth Benchmarking of Deep Neural Network Architectures for ECG Diagnosis

3.3. The China Physiological Signal Challenge 2018 dataset
The China Physiological Signal Challenge 2018 (CPSC) dataset (Liu et al., 2018) is a dataset
containing 12-lead ECGs of 6 to 60 second long, collected in the intensive care unit. The
dataset has 9 labels, including normal and atrial fibrillation, with a maximum of three labels
assigned to each sample. We used publicly available 6, 877 data in our experiments.
    The same preprocessing is applied to the CPSC dataset as for PTBXL and G12EC. We
use all 9 class labels in both multi-label classification and multi-class classification tasks.
We apply multi-label stratification to split the dataset into train, valid and test sets. The
size of the split was set to 8:1:1 as in the case of PTB-XL and G12EC. After splitting the
dataset, we calculated the mean and variance of each lead based on the samples in the train
set, and normalized all samples in the train, valid, and test based on these values, as in
PTB-XL and G12EC dataset.

4. Experiment
In order to compare the classification performance of DNN architectures on ECG data,
we conducted multi-label classification and multi-class classification on three datasets with
different collected regions, PTB-XL, G12EC and CPSC, and compared the performance
among the architectures1 . In this section, after explaining the evaluation metrics used
in multi-label and multi-class classification respectively, we describe the structure of the
classification model and the training procedure of the model.

4.1. Evaluation metrics
In this study, we compared the performance of DNN architectures for ECG classification in
two problem settings: multilabel classification and multi class classification.
     First, we explain the evaluation criteria for the multi-label classification task. In the
multi-label classification task, where a single model predicts multiple binary class labels,
we followed Strodthoff et al. (2020) and used the macro averaged value of area under
the receiver operator characteristic curve (ROC-AUC). The ROC-AUC for each class was
calculated using the predicted values for each class output by the model and ground truth
label.
     For multi-class classification task, we followed evaluation criteria of PhysioNet/Computing
in Cardiology Challenge 2017 (Clifford et al., 2017), which evaluate accuracy of atrial fib-
rillation classification with three other classes. We denote F 1 of the model for class c by
F 1c , calculated by following equation.

                                                2 × Ncc
                                      F 1c =                                               (1)
                                               Ncx + Nxc
where, c = 1, 2, 3 for normal, target diagnosis and samples with other class labels respec-
tively. Ncc corresponds to a number of samples with predicted class of c and ground truth
label of c. Ncx and Nxc correspond to a number of samples with ground truth labels of c and
predicted class of c respectively. The final score of the model for multi-class classification
was calculated by averaging F 1 of three classes.
1. https://github.com/seitalab/dnn_ecg_comparison

                                                5
In-depth Benchmarking of Deep Neural Network Architectures for ECG Diagnosis
F 11 + F 12 + F 13
score = (2)
3
We prepared five different splits of train, validation and test dataset and conducted five
independent trials for each training setting. After five independent training, we calculated
the mean and variance of prediction by each model and reported those values as a final
result. We applied Welch’s t-test (Welch, 1947) to test the statistical significance of each
training setting compared to baseline with p-value of 0.05 across all experiments. To correct
the p-values for multiple tests we applied (Benjamini and Hochberg, 1995). We excluded
settings with decrease of relative improvement from statistical testing.
4.2. Model and training
Figure 2: Overview of model used for our experiments. Backbone part corresponds to
various architectures. Output of backbone was given to prediction head. Both backbone
and prediction head are jointly trained.
For the purpose of comparing the different structures of DNNs, we divided the DNN
into two parts, backbone and prediction head module, for both multi-label and multi-class
classification tasks. The structural overview of the DNN model is shown in Figure 2.
The backbone module receives 12 lead ECG data and outputs vectors of a predeter-
mined number of dimensions. The structure of the backbone architecture is based on
LSTM (Hochreiter and Schmidhuber, 1997) and Transformer (Vaswani et al., 2017), which
are typical models for handling time series data, and ResNet (He et al., 2016), ResNeXt
(Xie et al., 2017), Squeeze-Excitation ResNet (SE-ResNet) (Hu et al., 2018), MobileNetV3
(Howard et al., 2019), EfficientNet (Tan and Le, 2019), Lambda ResNet (Bello, 2021), and
Normalizer-Free ResNet (Brock et al., 2021a), which are typical architectures used in image
classification. DNN architectures used in image classification were modified to handle one
dimensional ECG data.
The prediction head receives the vectors output by the backbone and outputs vec-
tors with the number of dimensions corresponding to the number of classes in each task.
The model consists of a fully connected layer, ReLU, batch normalization layer (Ioffe and
Szegedy, 2015), dropout layer (Srivastava et al., 2014), and fully connected layer. For each
model and each task, we jointly trained backbone and prediction heads.
The details of the training setting is as follows. First, we conducted grid search to find
optimal batch size and learning rate for each backbone model. We used PTB-XL dataset
with “all” labels subset to conduct grid search. We examined batch size of 64, 128, 256 and
6In-depth Benchmarking of Deep Neural Network Architectures for ECG Diagnosis
learning rate of 0.01, 0.001, 0.0001 for all backbone architectures and selected the best test
set ROC-AUC score setting for subsequent experiments. The results of all grid searches are
shown in Appendix A.
For each training setting, five independent experiments were conducted with different
splits of the data. We trained each model for maximum 250 epochs with early stopping
with a patience value of 5 for every dataset and tasks. We set output size of all backbone
module to 256. We evaluated the validation set score for every 5 epochs and picked the
model with the best validation score, subsequently applied trained model on a test set to
calculate score. Final score for each setting was calculated by averaging five independent
trials. We use Adam optimizer (Kingma and Ba, 2014) with the fixed learning rate selected
by grid search for each model. Following the training setting of Strodthoff et al. (2020), we
randomly subsample 2.5 seconds length data during training. During evaluation, we split the
input into segments of 2.5 second window size that overlap by half of the window size. After
obtaining segments we applied the model to all segments and aggregated predictions for each
segment by taking maximum values for each class predictions. In multi-class classification
tasks, in order to mitigate class imbalance problems, we computed the proportion of normal
classes in each train set for target diagnosis class and other label class, and took the inverse
of the value as the weight of the class.
5. Results
5.1. Multi-label classification
Figure 3: Result of multi-label classification with eight tasks from three datasets. Values
are relative improvements of macro averaged ROC-AUC score averaged of five independent
experiments, over ResNet-18 model. “diag”, “sub.” and “super.” indicate “diagnosis”, “sub-
diagnosis” and “super-diagnosis” category from PTB-XL dataset respectively.
7In-depth Benchmarking of Deep Neural Network Architectures for ECG Diagnosis
First, we compared the DNN architectures in a multi-label classification task. We used
eight datasets for comparison: six datasets generated from PTB-XL and datasets from
G12EC and CPSC datasets. As an evaluation criteria, macro average of the ROC-AUC
scores for each class in the datasets were used. The relative improvement of the mean
values of five independent trials with different data splits over ResNet-18 are shown in
Figure. 3. Among the eight tasks, SE-ResNet showed the highest score in three of them:
“diag”, “sub-diagnosis”, and “super-diagnosis”. For other tasks, ResNet-50 performed best
on “all”, Lambda-ResNet on “form”, MobileNetV3 on “rhythm”, ResNeXt on the G12EC
dataset, and NF-ResNet-18 on CPSC showed the highest accuracy. However, no significant
improvement over ResNet-18 was observed for any of the architectures experimented.
5.2. Multi-class classification
Table 2: Number of normal and overlapping diagnostic labels contained in each dataset
used in multi-class classification tasks.
PTB-XL G12EC CPSC
9, 528 1, 752 918
Normal
(43.63%) (16.94%) (13.35%)
1, 514 570 1, 221
Atrial fibrillation (AF)
(6.93%) (5.51%) (17.75%)
797 769 722
First-degree atrioventricular block (I-AVB)
(3.65%) (7.43%) (10.50%)
536 231 236
Left bundle branch block (LBBB)
(2.45%) (2.23%) (3.43%)
542 542 1, 857
Right bundle branch block (RBBB)
(2.48%) (5.24%) (27.00%)
Subsequently, we conducted multi-class classification to examine if there were any dif-
ferences in the performance of the architectures for the different diagnostic classes. Ex-
periments were conducted on four diagnostic labels: atrial fibrillation (AF), first-degree
atrioventricular block (I-AVB), left bundle branch block (LBBB), and right bundle branch
block (RBBB), which overlapped in the three datasets PTB-XL, G12EC and CPSC. Table
2 shows the number and percentage of normal and targeted diagnostic labels in each data
set. In each experimental setting, we trained a classification model by assigning one of three
labels, normal, targeted diagnostic, and other non-normal classes, to each datum contained
in the dataset.
First, we conducted multi-class classification to predict atrial fibrillation (AF). The
results are shown in Figure 4. For the two datasets PTB-XL and G12EC, ResNet-18
showed the best performance. In the CPSC dataset, only NF-ResNet outperformed the
score of ResNet-18. However, the results of statistical hypothesis testing showed there were
no significant improvements over ResNet-18 for all architectures tested.
Subsequently, we classified the first degree AV block (I-AVB) class. The results of rela-
tive improvements over ResNet-18 architecture are shown on Figure 5. NF-ResNet-34 and
8In-depth Benchmarking of Deep Neural Network Architectures for ECG Diagnosis
Figure 4: Result of multi-class classification (target diagnosis: atrial fibrillation). Values
are a relative improvement of macro averaged F 1 averaged of five independent experiments
over ResNet-18 architecture.
Figure 5: Result of multi-class classification (target diagnosis: first-degree atrioventricular
block; I-AVB). Values are a relative improvement of macro averaged F 1 averaged of five
independent experiments over ResNet-18 architecture.
9In-depth Benchmarking of Deep Neural Network Architectures for ECG Diagnosis
NF-ResNet-50 outperformed ResNet-18 in all data sets. On the other hand, architectures
other than NF-ResNet were all below the score of ResNet18, except for ResNet-34 on the
CPSC dataset. We conducted statistical hypothesis testing to the obtained results, and we
did not observe any statistically significant improvements over ResNet-18 architecture.
Figure 6: Result of multi-class classification (target diagnosis: left bundle branch block;
LBBB). Values are a relative improvement of macro averaged F 1 averaged of five indepen-
dent experiments over ResNet-18 architecture.
After the experiment of I-AVB, we selected left bundle branch block (LBBB) and con-
ducted multi-class classification. The results are shown in Figure 6. We obtained similar
results to I-AVB, where we observed improvements over ResNet-18 on NF-ResNet-34 and
NF-ResNet-50 for CPSC dataset. For other architectures, we observed improvements on
ResNet-34, EfficientNet b0 and Lambda-ResNet18 on CPSC dataset. The results of statis-
tical hypothesis test showed no significant improvements over ResNet-18 architecture.
Figure 7: Result of multi-class classification (target diagnosis: right bundle branch block;
RBBB). Values are relative improvement of macro averaged F 1 averaged of five independent
experiments over ResNet-18 architecture.
Consecutively, we experimented multi-class classification with the right bundle branch
block (RBBB) class. The obtained results are shown in Figure 7. We observed improvement
of SE-ResNet-50, EfficientNet b0 and NF-ResNet-34 on PTB-XL dataset, and improvement
of ResNet-34 and NF-ResNet-34 on G12EC dataset over ResNet-18. On CPSC dataset, sim-
10In-depth Benchmarking of Deep Neural Network Architectures for ECG Diagnosis
ilar to previous three diagnostic classes, we observed improvement over ResNet-18 on NF-
ResNet-34 and NF-ResNet-50. We also conducted statistical hypothesis testing for RBBB
classification task, and as in the previous results, no statistically significant differences were
observed in any of the cases.
6. Discussion
In this study, we examined the difference in classification accuracy of DNN architectures in
ECG diagnosis. We used three 12 lead ECG datasets and tested nine DNN architectures in
two types of task: multi-label classification and multi-class classification. The results of the
experiment showed that among the nine DNN architectures tested in our experiment, there
was no architecture that statistically significantly outperformed ResNet-18 in the multi-label
classification task. In the multi-class classification task, NF-ResNet outperformed ResNet-
18 only on the CPSC dataset for all four diseases tested, and the other architectures only
outperformed ResNet-18 in some conditions.
The obtained result, the shallowest convolutional neural network based architecture
ResNet-18 performing consistently better compared to other architectures, is different from
the results in the image domain using the ImageNet dataset as a benchmark. One of the
differences between ECG data and image data is the size of the data. The ECG data is given
as a matrix of product of the series length and number of leads, and in our experiment, a
matrix of 1250 × 12 dimensions was given as an input. On the other hand, in the image
domain, for instance in ImageNet dataset, the size of the input is a 256 × 256 × 3 tensor,
and the size of data is very different. This difference may result in a difference of suitable
DNN architectures between ECG and image. The results obtained in this study suggest the
need to consider the size and architecture of the model appropriate for the data of interest.
Limitations In this work we examined the DNN architectures for ECG classification and
showed only NF-ResNet on CPSC dataset outperforms ResNet-18 architecture. As for a
hyper parameter, we determined batch size and learning rate for each training by grid
searching on the “all” label setting of PTB-XL dataset and other parameters such as type
of optimizer and output dimension of backbone architecture was fixed to predetermined
value. Searching for hyperparameters for each individual task may improve the score for
each architecture. Also, for the LSTM, performance may be improved by adding more
layers, and for the Transformer, performance may be improved by changing the structure
of the encoder. Thus, there is a possibility of obtaining results different from the conclusion
of this work by extending the search range of hyperparameters.
Additionally, in our experiment, we did not use any sophisticated training techniques
such as data augmentation or scheduling of learning rate. Although various data augmenta-
tion techniques are used in training ImageNet dataset, only augmentation by sub-sampling
was applied in our experiment. For example, Brock et al. (2021b) have shown NF-ResNet
trained with huge batch size and strong augmentation improves performance, but in this
experiment, the maximum batch size is 256. Thus, exploring the performance of each
architecture combined with various training techniques remains as a future issue.
11In-depth Benchmarking of Deep Neural Network Architectures for ECG Diagnosis
Acknowledgments
We thank all members of the RIKEN pioneering project “Prediction for Science” for in-
sightful discussion.
References
Georgia 12-lead ecg challenge database. https://www.kaggle.com/bjoernjostein/
georgia-12lead-ecg-challenge-database/metadata, 2020. Accessed: 2021-03-17.
Erick A Perez Alday, Annie Gu, Amit J Shah, Chad Robichaux, An-Kwok Ian Wong,
Chengyu Liu, Feifei Liu, Ali Bahrami Rad, Andoni Elola, Salman Seyedi, et al. Classifica-
tion of 12-lead ecgs: the physionet/computing in cardiology challenge 2020. Physiological
measurement, 41(12):124003, 2020.
Dzmitry Bahdanau, Kyunghyun Cho, and Yoshua Bengio. Neural machine translation by
jointly learning to align and translate. arXiv preprint arXiv:1409.0473, 2014.
Irwan Bello. Lambdanetworks: Modeling long-range interactions without attention. arXiv
preprint arXiv:2102.08602, 2021.
Yoav Benjamini and Yosef Hochberg. Controlling the false discovery rate: a practical and
powerful approach to multiple testing. Journal of the Royal statistical society: series B
(Methodological), 57(1):289–300, 1995.
Andrew Brock, Soham De, and Samuel L Smith. Characterizing signal propagation to close
the performance gap in unnormalized resnets. arXiv preprint arXiv:2101.08692, 2021a.
Andrew Brock, Soham De, Samuel L Smith, and Karen Simonyan. High-performance large-
scale image recognition without normalization. arXiv preprint arXiv:2102.06171, 2021b.
Gari D Clifford, Chengyu Liu, Benjamin Moody, H Lehman Li-wei, Ikaro Silva, Qiao Li,
AE Johnson, and Roger G Mark. Af classification from a short single lead ecg recording:
the physionet/computing in cardiology challenge 2017. In 2017 Computing in Cardiology
(CinC), pages 1–4. IEEE, 2017.
Jacob Devlin, Ming-Wei Chang, Kenton Lee, and Kristina Toutanova. Bert: Pre-
training of deep bidirectional transformers for language understanding. arXiv preprint
arXiv:1810.04805, 2018.
Hassan Ismail Fawaz, Benjamin Lucas, Germain Forestier, Charlotte Pelletier, Daniel F
Schmidt, Jonathan Weber, Geoffrey I Webb, Lhassane Idoumghar, Pierre-Alain Muller,
and François Petitjean. Inceptiontime: Finding alexnet for time series classification. Data
Mining and Knowledge Discovery, 34(6):1936–1962, 2020.
Alex Graves, Abdel-rahman Mohamed, and Geoffrey Hinton. Speech recognition with deep
recurrent neural networks. In 2013 IEEE international conference on acoustics, speech
and signal processing, pages 6645–6649. IEEE, 2013.
12In-depth Benchmarking of Deep Neural Network Architectures for ECG Diagnosis
Awni Y Hannun, Pranav Rajpurkar, Masoumeh Haghpanahi, Geoffrey H Tison, Codie
Bourn, Mintu P Turakhia, and Andrew Y Ng. Cardiologist-level arrhythmia detection
and classification in ambulatory electrocardiograms using a deep neural network. Nature
medicine, 25(1):65, 2019.
Kaiming He, Xiangyu Zhang, Shaoqing Ren, and Jian Sun. Deep residual learning for
image recognition. In Proceedings of the IEEE conference on computer vision and pattern
recognition, pages 770–778, 2016.
Sepp Hochreiter and Jürgen Schmidhuber. Long short-term memory. Neural computation,
9(8):1735–1780, 1997.
Shenda Hong, Meng Wu, Yuxi Zhou, Qingyun Wang, Junyuan Shang, Hongyan Li, and
Junqing Xie. Encase: An ensemble classifier for ecg classification using expert features
and deep neural networks. In 2017 Computing in Cardiology (CinC), pages 1–4. IEEE,
2017.
Andrew Howard, Mark Sandler, Grace Chu, Liang-Chieh Chen, Bo Chen, Mingxing Tan,
Weijun Wang, Yukun Zhu, Ruoming Pang, Vijay Vasudevan, et al. Searching for mo-
bilenetv3. In Proceedings of the IEEE/CVF International Conference on Computer Vi-
sion, pages 1314–1324, 2019.
Jie Hu, Li Shen, and Gang Sun. Squeeze-and-excitation networks. In Proceedings of the
IEEE conference on computer vision and pattern recognition, pages 7132–7141, 2018.
Sergey Ioffe and Christian Szegedy. Batch normalization: Accelerating deep network train-
ing by reducing internal covariate shift. arXiv preprint arXiv:1502.03167, 2015.
Diederik P Kingma and Jimmy Ba. Adam: A method for stochastic optimization. arXiv
preprint arXiv:1412.6980, 2014.
Feifei Liu, Chengyu Liu, Lina Zhao, Xiangyu Zhang, Xiaoling Wu, Xiaoyan Xu, Yulin Liu,
Caiyun Ma, Shoushui Wei, Zhiqiang He, et al. An open access database for evaluating the
algorithms of electrocardiogram rhythm and morphology abnormality detection. Journal
of Medical Imaging and Health Informatics, 8(7):1368–1373, 2018.
A. Natarajan, Y. Chang, S. Mariani, A. Rahman, G. Boverman, S. Vij, and J. Rubin. A wide
and deep transformer neural network for 12-lead ecg classification. In 2020 Computing
in Cardiology, pages 1–4, 2020. doi: 10.22489/CinC.2020.107.
Pranav Rajpurkar, Jian Zhang, Konstantin Lopyrev, and Percy Liang. Squad: 100,000+
questions for machine comprehension of text. arXiv preprint arXiv:1606.05250, 2016.
Olga Russakovsky, Jia Deng, Hao Su, Jonathan Krause, Sanjeev Satheesh, Sean Ma, Zhi-
heng Huang, Andrej Karpathy, Aditya Khosla, Michael Bernstein, et al. Imagenet large
scale visual recognition challenge. International journal of computer vision, 115(3):211–
252, 2015.
13In-depth Benchmarking of Deep Neural Network Architectures for ECG Diagnosis
Nitish Srivastava, Geoffrey Hinton, Alex Krizhevsky, Ilya Sutskever, and Ruslan Salakhut-
dinov. Dropout: a simple way to prevent neural networks from overfitting. The journal
of machine learning research, 15(1):1929–1958, 2014.
Nils Strodthoff, Patrick Wagner, Tobias Schaeffter, and Wojciech Samek. Deep learning
for ecg analysis: Benchmarks and insights from ptb-xl. arXiv preprint arXiv:2004.13701,
2020.
Christian Szegedy, Wei Liu, Yangqing Jia, Pierre Sermanet, Scott Reed, Dragomir
Anguelov, Dumitru Erhan, Vincent Vanhoucke, and Andrew Rabinovich. Going deeper
with convolutions. In Proceedings of the IEEE conference on computer vision and pattern
recognition, pages 1–9, 2015.
Mingxing Tan and Quoc Le. Efficientnet: Rethinking model scaling for convolutional neural
networks. In International Conference on Machine Learning, pages 6105–6114. PMLR,
2019.
Tomás Teijeiro, Constantino A Garcı́a, Daniel Castro, and Paulo Félix. Arrhythmia clas-
sification from the abductive interpretation of short single-lead ecg records. In 2017
Computing in Cardiology (CinC), pages 1–4. IEEE, 2017.
Ashish Vaswani, Noam Shazeer, Niki Parmar, Jakob Uszkoreit, Llion Jones, Aidan N
Gomez, Lukasz Kaiser, and Illia Polosukhin. Attention is all you need. arXiv preprint
arXiv:1706.03762, 2017.
Patrick Wagner, Nils Strodthoff, Ralf-Dieter Bousseljot, Dieter Kreiseler, Fatima I Lunze,
Wojciech Samek, and Tobias Schaeffter. Ptb-xl, a large publicly available electrocardio-
graphy dataset. Scientific data, 7(1):1–15, 2020.
Bernard L Welch. The generalization of student’s’ problem when several different population
variances are involved. Biometrika, 34(1/2):28–35, 1947.
Saining Xie, Ross Girshick, Piotr Dollár, Zhuowen Tu, and Kaiming He. Aggregated residual
transformations for deep neural networks. In Proceedings of the IEEE conference on
computer vision and pattern recognition, pages 1492–1500, 2017.
Zhibin Zhao, Hui Fang, Samuel D Relton, Ruqiang Yan, Yuhong Liu, Zhijing Li, Jing Qin,
and David C Wong. Adaptive lead weighted resnet trained with different duration signals
for classifying 12-lead ecgs. In 2020 Computing in Cardiology, pages 1–4. IEEE, 2020.
Zhaowei Zhu, Han Wang, Tingting Zhao, Yangming Guo, Zhuoyang Xu, Zhuo Liu, Siqi Liu,
Xiang Lan, Xingzhi Sun, and Mengling Feng. Classification of cardiac abnormalities from
ecg signals using se-resnet. In 2020 Computing in Cardiology, pages 1–4. IEEE, 2020.
Appendix A.
In this section, we describe details of implementation and grid search results of DNN archi-
tectures tested in our experiments.
14In-depth Benchmarking of Deep Neural Network Architectures for ECG Diagnosis
A.1 ResNet
Table 3: Result of grid search on ResNet architectures.
(a) ResNet-18 (b) ResNet-34
Learning rate Learning rate
0.01 0.001 0.0001 0.01 0.001 0.0001
64 0.8929 0.9059 0.8871 64 0.8972 0.9004 0.8971
Batch Batch
size 128 0.8918 0.8922 0.8898 size 128 0.8952 0.8930 0.8967
256 0.8946 0.8941 0.8796 256 0.8988 0.8946 0.8810
(c) ResNet-50. (d) ResNet-101.
Learning rate Learning rate
0.01 0.001 0.0001 0.01 0.001 0.0001
64 0.8972 0.8987 0.8900 64 0.8944 0.8902 0.8800
Batch Batch
size 128 0.9057 0.8909 0.8877 size 128 0.8880 0.8998 0.8878
256 0.8760 0.8956 0.8860 256 0.9027 0.8928 0.8829
ResNet (He et al., 2016) is an architecture which utilizes skip connections to enable
training of deeper models. ResNet has several variants with different numbers of residual
blocks used inside. We follow standard parameters and layer structure of ResNet applied to
image classification tasks, except we replace all 2d convolution layer and batch normalization
layer to 1d counterpart. In this work, we applied grid search on ResNet-18, ResNet-34,
ResNet-50 and ResNet-101. The results are shown in Table 3.
A.2 ResNeXt
Table 4: Result of grid search on ResNeXt architectures.
(a) ResNeXt-50. (b) ResNeXt-101.
Learning rate Learning rate
0.01 0.001 0.0001 0.01 0.001 0.0001
64 0.9073 0.8960 0.8922 64 0.9030 0.9003 0.8927
Batch Batch
size 128 0.9003 0.8969 0.8932 size 128 0.8988 0.8959 0.8873
256 0.9002 0.8914 0.8794 256 0.8807 0.8808 0.8850
ResNeXt (Xie et al., 2017) is an architecture extending ResNet, consisting of multiple
paths in each block. Same as in ResNet, we implemented the standard layer structure of the
ResNeXt architecture, except switching convolutional layers and batch normalization layers.
In this work, we conducted grid search on ResNeXt-50 and ResNeXt-101, and conducted
15In-depth Benchmarking of Deep Neural Network Architectures for ECG Diagnosis
multi-label and multi-class classification tasks with ResNeXt-50 architecture. Results of
grid search are shown in Table 4.
A.3 SE-ResNet
Table 5: Result of grid search on SE-ResNet architectures.
(a) SE-ResNet-50 (b) SE-ResNet-101
Learning rate Learning rate
0.01 0.001 0.0001 0.01 0.001 0.0001
64 0.9082 0.8977 0.8966 64 0.9066 0.8971 0.9013
Batch Batch
size 128 0.8994 0.9055 0.9000 size 128 0.9098 0.9089 0.9077
256 0.9007 0.9068 0.8757 256 0.8979 0.9041 0.8996
SE-ResNet is a ResNet with Squeeze-Excitation module (Hu et al., 2018). Akin to
ResNet and ResNeXt architecture, we implemented the same structure to architecture used
for image classification and replaced convolution and batch normalization layer to 1d. We
conducted grid search with SE-ResNet-50 and SE-ResNet-101, and SE-ResNet-50 was used
in subsequent experiments. The results of grid search is shown on Table 5.
A.4 MobileNetV3
Table 6: Result of grid search on MobileNetV3 architectures.
(a) MobilenetV3-Small (b) MobilenetV3-Large
Learning rate Learning rate
0.01 0.001 0.0001 0.01 0.001 0.0001
64 0.8980 0.8894 0.8777 64 0.8934 0.8984 0.8883
Batch Batch
size 128 0.8964 0.8965 0.8918 size 128 0.8856 0.8884 0.8547
256 0.8778 0.8942 0.8851 256 0.8902 0.8890 0.8624
MobileNetsV3 (Howard et al., 2019) is an architecture developed for mobile phone CPUs,
designed by neural architecture search. Two types of architecture, MobileNetV3-large and
MobileNetV3-small, exist and we conducted grid search and subsequent classification ex-
periments on both architecture. Similar to previous architectures stated above, we switched
convolution and normalizing layers to 1d and other parameters were used as is in 2d. Table
6 shows the results of grid search.
A.5 EfficientNet
EfficientNet is an architecture which uses a scaling method that uniformly scales all di-
mensions of depth,width and resolution (Tan and Le, 2019). We tested two small types
16In-depth Benchmarking of Deep Neural Network Architectures for ECG Diagnosis
Table 7: Result of grid search on EfficientNet architectures.
(a) EfficientNet b0 (b) EfficientNet b1
Learning rate Learning rate
0.01 0.001 0.0001 0.01 0.001 0.0001
64 0.8936 0.8923 0.8966 64 0.8891 0.8902 0.9004
Batch Batch
size 128 0.8977 0.8913 0.8878 size 128 0.8909 0.9028 0.8986
256 0.8835 0.8962 0.8885 256 0.8833 0.8987 0.8911
of EfficientNet architectures, b0 and b1, converted to treat ECG data. The results of grid
search is shown in Table 7
A.6 Lambda Network
Table 8: Result of grid search on Lambda ResNet architectures.
(a) Lambda-ResNet-18 (b) Lambda-ResNet-50
Learning rate Learning rate
0.01 0.001 0.0001 0.01 0.001 0.0001
64 0.9051 0.8986 0.8880 64 0.9089 0.8962 0.8729
Batch Batch
size 128 0.9086 0.8805 0.8790 size 128 0.9129 0.8820 0.8935
256 0.8895 0.8935 0.8724 256 0.8906 0.8896 0.8768
Lambda Networks is an architecture with lambda layers which is an alternative frame-
work to self-attention (Bello, 2021). We implemented ResNet with lambda layers converted
for 1 dimensional ECG data in our experiments. To avoid explosion of passed values, clamp-
ing with absolute value of 20 was introduced after every block of residual connection. For
lambda convolution parameters, we used 7, 4, 16 for context spatial dimension m, embed-
ding dimension u and query/key depth k respectively. As a number of heads we chose 4.
The results of grid search is shown on Table 8.
A.7 Normalizer Free Networks
Normalization-Free network is an architectures proposed to alleviate negative aspects of
batch normalization (Brock et al., 2021b). Brock et al. (2021b) introduces multiple training
techniques such as adaptive gradient clipping for NF-ResNet. Howereve, in this work, we
only implement ResNet with convolution layers with scaled weight standardizations (Brock
et al., 2021a) converted for 1 dimensional data. The results of grid search is shown on Table
9
17In-depth Benchmarking of Deep Neural Network Architectures for ECG Diagnosis
Table 9: Result of grid search on Normalizer Free ResNet architectures.
(a) NF-ResNet-18 (b) NF-ResNet-34
Learning rate Learning rate
0.01 0.001 0.0001 0.01 0.001 0.0001
64 0.8828 0.8907 0.8884 64 0.5000 0.8816 0.8913
Batch Batch
size 128 0.8882 0.9007 0.8823 size 128 0.5000 0.8733 0.8837
256 0.8846 0.8890 0.8778 256 0.5000 0.8767 0.8766
(c) NF-ResNet-50 (d) NF-ResNet-101
Learning rate Learning rate
0.01 0.001 0.0001 0.01 0.001 0.0001
64 0.5000 0.7190 0.8770 64 0.5000 0.5000 0.8779
Batch Batch
size 128 0.5000 0.7871 0.8749 size 128 0.5000 0.5659 0.8691
256 0.5000 0.7700 0.8619 256 0.5000 0.7216 0.8624
Table 10: Result of grid search on Bidirectional-LSTM architecture.
Learning rate
0.01 0.001 0.0001
64 0.8087 0.8824 0.8587
Batch
size 128 0.8436 0.8741 0.8490
256 0.8511 0.8798 0.8430
18In-depth Benchmarking of Deep Neural Network Architectures for ECG Diagnosis
A.8 Bidirectional LSTM
Long short term memory (LSTM) is an architecture used on sequence modeling tasks
(Hochreiter and Schmidhuber, 1997). We tested a single layer bidirectional LSTM with
a hidden size of 64 in our experiments. The result of grid search is shown on Table 10.
A.9 Transformer
Table 11: Result of grid search on Transformer architectures.
(a) Transformer D2 (b) Transformer D4
Learning rate Learning rate
0.01 0.001 0.0001 0.01 0.001 0.0001
64 0.6091 0.8735 0.8245 64 0.5705 0.8501 0.8207
Batch Batch
size 128 0.6155 0.8440 0.8322 size 128 0.5628 0.8543 0.8068
256 0.5877 0.8306 0.7950 256 0.5722 0.8563 0.6633
Transformer is an architectures which utilizes self-attention originally applied to natural
language processing tasks (Vaswani et al., 2017). In this work, we split input sequence data
into 50 time step chunks and applied a linear embedding layer to each chunk. After adding
positional encoder values to output of linear layer we applied transformer encoder. Number
of attention heads for each layer was set to 4, dimension of the input and output of the
encoder was set to 32, output of feed forward layer inside the transformer encoder was set
to 64. We tested 2 and 4 for the number of layers to stack, which we call “Transformer D2”
and “Transformer D4”. The results of grid search is shown on Table 11
Appendix B.
In this section we show details of experimental results mentioned in our experiments.
B.1 Multi-label classification
Table 12 and 13 shows mean values of five independent trials for multi-label classification
tasks.
B.2 Multi-class classification
Table 14, 15, 16, 17 shows results of multi-class classification tasks for AF, I-AVB, LBBB
and RBBB respectively.
19In-depth Benchmarking of Deep Neural Network Architectures for ECG Diagnosis
Table 12: Result of multi-label classification with 6 tasks from PTB-XL dataset. Values
are macro averaged ROC-AUC score averaged of five independent trials. Values inside
the bracket are standard deviation of five independent trials. “diag”, “sub.” and “super.”
indicate “diagnosis”, “sub-diagnosis” and “super-diagnosis” category respectively.
PTB-XL
all diag. sub. super. form rhythm
0.914 0.928 0.932 0.933 0.882 0.921
ResNet-18
(±0.011) (±0.007) (±0.013) (±0.006) (±0.011) (±0.022)
0.913 0.925 0.922 0.935 0.879 0.913
ResNet-34
(±0.008) (±0.005) (±0.008) (±0.007) (±0.018) (±0.027)
0.916 0.925 0.924 0.932 0.856 0.897
ResNet-50
(±0.007) (±0.008) (±0.011) (±0.007) (±0.028) (±0.026)
0.907 0.925 0.92 0.935 0.883 0.913
ResNext-50
(±0.004) (±0.003) (±0.016) (±0.008) (±0.011) (±0.026)
0.911 0.932 0.932 0.936 0.888 0.931
SE-ResNet-50
(±0.005) (±0.002) (±0.013) (±0.004) (±0.016) (±0.017)
0.909 0.908 0.884 0.93 0.838 0.937
EfficientNet b0
(±0.006) (±0.007) (±0.047) (±0.007) (±0.033) (±0.007)
0.905 0.918 0.916 0.933 0.874 0.926
EfficientNet b1
(±0.006) (±0.01) (±0.008) (±0.007) (±0.012) (±0.029)
0.902 0.909 0.911 0.93 0.872 0.927
MobilenetV3-Large
(±0.013) (±0.014) (±0.009) (±0.007) (±0.02) (±0.008)
0.905 0.901 0.911 0.932 0.87 0.938
MobilenetV3-Small
(±0.008) (±0.009) (±0.015) (±0.007) (±0.011) (±0.018)
0.911 0.926 0.921 0.935 0.894 0.927
Lambda-ResNet-18
(±0.006) (±0.006) (±0.009) (±0.006) (±0.012) (±0.017)
0.916 0.92 0.923 0.935 0.889 0.921
Lambda-ResNet-50
(±0.01) (±0.01) (±0.011) (±0.006) (±0.022) (±0.012)
0.895 0.901 0.903 0.922 0.839 0.924
NF-ResNet-18
(±0.015) (±0.007) (±0.013) (±0.007) (±0.028) (±0.018)
0.907 0.908 0.911 0.92 0.813 0.909
NF-ResNet-34
(±0.012) (±0.007) (±0.015) (±0.006) (±0.023) (±0.029)
0.897 0.902 0.906 0.917 0.785 0.908
NF-ResNet-50
(±0.009) (±0.01) (±0.016) (±0.008) (±0.024) (±0.025)
0.898 0.898 0.905 0.918 0.852 0.887
Bi-LSTM
(±0.008) (±0.002) (±0.022) (±0.009) (±0.024) (±0.016)
0.878 0.891 0.896 0.91 0.832 0.881
Transformer D2
(±0.015) (±0.006) (±0.009) (±0.008) (±0.016) (±0.02)
0.857 0.877 0.883 0.909 0.783 0.868
Transformer D4
(±0.025) (±0.013) (±0.016) (±0.005) (±0.032) (±0.033)
20In-depth Benchmarking of Deep Neural Network Architectures for ECG Diagnosis
Table 13: Result of multi-label classification with G12EC and CPSC dataset. Values are
macro averaged ROC-AUC score averaged of five independent trials. Values inside the
bracket are standard deviation of five independent trials.
G12EC CPSC
ResNet-18 0.979 (±0.002) 0.991 (±0.001)
ResNet-34 0.98 (±0.002) 0.991 (±0.003)
ResNet-50 0.976 (±0.007) 0.984 (±0.015)
ResNext-50 0.981 (±0.002) 0.968 (±0.03)
SE-ResNet-50 0.972 (±0.012) 0.967 (±0.021)
EfficientNet b0 0.956 (±0.008) 0.974 (±0.015)
EfficientNet b1 0.976 (±0.003) 0.991 (±0.003)
MobilenetV3-Large 0.974 (±0.003) 0.991 (±0.002)
MobilenetV3-Small 0.94 (±0.017) 0.972 (±0.005)
Lambda-ResNet-18 0.971 (±0.017) 0.991 (±0.004)
Lambda-ResNet-50 0.98 (±0.003) 0.992 (±0.002)
NF-ResNet-18 0.963 (±0.027) 0.993 (±0.001)
NF-ResNet-34 0.977 (±0.002) 0.992 (±0.002)
NF-ResNet-50 0.975 (±0.002) 0.992 (±0.003)
Bi-LSTM 0.898 (±0.01) 0.926 (±0.033)
Transformer D2 0.871 (±0.009) 0.934 (±0.008)
Transformer D4 0.853 (±0.008) 0.912 (±0.016)
21In-depth Benchmarking of Deep Neural Network Architectures for ECG Diagnosis
Table 14: Result of multi-class classification (target diagnosis: atrial fibrillation). Values
are macro averaged F 1 averaged of five independent trials. Values inside the bracket are
standard deviation of five independent trials.
PTB-XL G12EC CPSC
ResNet-18 0.862 (±0.013) 0.904 (±0.007) 0.885 (±0.044)
ResNet-34 0.851 (±0.013) 0.791 (±0.173) 0.835 (±0.107)
ResNet-50 0.772 (±0.113) 0.369 (±0.105) 0.773 (±0.038)
ResNext-50 0.852 (±0.009) 0.458 (±0.2) 0.765 (±0.053)
SE-ResNet-50 0.852 (±0.018) 0.318 (±0.044) 0.816 (±0.067)
EfficientNet b0 0.862 (±0.012) 0.371 (±0.101) 0.735 (±0.055)
EfficientNet b1 0.834 (±0.036) 0.403 (±0.174) 0.862 (±0.056)
MobilenetV3-L 0.845 (±0.021) 0.322 (±0.045) 0.846 (±0.054)
MobilenetV3-S 0.828 (±0.023) 0.368 (±0.076) 0.796 (±0.03)
Lambda-ResNet-18 0.858 (±0.016) 0.41 (±0.134) 0.842 (±0.01)
Lambda-ResNet-50 0.848 (±0.017) 0.288 (±0.001) 0.731 (±0.056)
NF-ResNet-18 0.819 (±0.02) 0.498 (±0.238) 0.846 (±0.099)
NF-ResNet-34 0.812 (±0.014) 0.84 (±0.062) 0.954 (±0.008)
NF-ResNet-50 0.801 (±0.02) 0.867 (±0.059) 0.939 (±0.017)
Bi-LSTM 0.651 (±0.043) 0.363 (±0.064) 0.577 (±0.053)
Transformer D2 0.686 (±0.071) 0.293 (±0.006) 0.622 (±0.046)
Transformer D4 0.626 (±0.074) 0.305 (±0.035) 0.609 (±0.045)
22In-depth Benchmarking of Deep Neural Network Architectures for ECG Diagnosis
Table 15: Result of multi-class classification (target diagnosis: I-AVB). Values are macro
averaged F 1 averaged of five independent trials. Values inside the bracket are standard
deviation of five independent trials.
PTB-XL G12EC CPSC
ResNet-18 0.62 (±0.029) 0.909 (±0.013) 0.83 (±0.081)
ResNet-34 0.612 (±0.028) 0.849 (±0.091) 0.862 (±0.057)
ResNet-50 0.579 (±0.014) 0.517 (±0.17) 0.776 (±0.038)
ResNext-50 0.603 (±0.041) 0.637 (±0.186) 0.735 (±0.053)
SE-ResNet-50 0.606 (±0.053) 0.412 (±0.251) 0.727 (±0.056)
EfficientNet b0 0.587 (±0.023) 0.417 (±0.111) 0.697 (±0.028)
EfficientNet b1 0.587 (±0.009) 0.691 (±0.209) 0.74 (±0.105)
MobilenetV3-L 0.592 (±0.038) 0.583 (±0.172) 0.817 (±0.048)
MobilenetV3-S 0.571 (±0.009) 0.704 (±0.06) 0.729 (±0.057)
Lambda-ResNet-18 0.594 (±0.032) 0.621 (±0.25) 0.729 (±0.049)
Lambda-ResNet-50 0.601 (±0.024) 0.424 (±0.125) 0.57 (±0.161)
NF-ResNet-18 0.571 (±0.007) 0.798 (±0.183) 0.482 (±0.233)
NF-ResNet-34 0.652 (±0.069) 0.911 (±0.02) 0.89 (±0.11)
NF-ResNet-50 0.624 (±0.046) 0.916 (±0.012) 0.944 (±0.01)
Bi-LSTM 0.56 (±0.011) 0.366 (±0.108) 0.392 (±0.049)
Transformer D2 0.556 (±0.007) 0.287 (±0.002) 0.365 (±0.051)
Transformer D4 0.561 (±0.009) 0.298 (±0.014) 0.299 (±0.017)
23In-depth Benchmarking of Deep Neural Network Architectures for ECG Diagnosis
Table 16: Result of multi-class classification (LBBB). Values are macro averaged F 1 av-
eraged of five independent trials. Values inside the bracket are standard deviation of five
independent trials.
PTB-XL G12EC CPSC
ResNet-18 0.874 (±0.023) 0.833 (±0.047) 0.765 (±0.117)
ResNet-34 0.863 (±0.029) 0.598 (±0.179) 0.779 (±0.078)
ResNet-50 0.859 (±0.031) 0.343 (±0.042) 0.717 (±0.115)
ResNext-50 0.849 (±0.03) 0.343 (±0.081) 0.697 (±0.09)
SE-ResNet-50 0.873 (±0.019) 0.317 (±0.041) 0.695 (±0.044)
EfficientNet b0 0.866 (±0.022) 0.373 (±0.111) 0.611 (±0.182)
EfficientNet b1 0.86 (±0.027) 0.296 (±0.001) 0.783 (±0.029)
MobilenetV3-L 0.851 (±0.02) 0.474 (±0.116) 0.656 (±0.223)
MobilenetV3-S 0.864 (±0.018) 0.424 (±0.047) 0.721 (±0.07)
Lambda-ResNet-18 0.855 (±0.03) 0.376 (±0.111) 0.814 (±0.066)
Lambda-ResNet-50 0.856 (±0.023) 0.296 (±0.001) 0.583 (±0.227)
NF-ResNet-18 0.85 (±0.025) 0.667 (±0.131) 0.496 (±0.244)
NF-ResNet-34 0.836 (±0.032) 0.831 (±0.097) 0.93 (±0.039)
NF-ResNet-50 0.849 (±0.017) 0.872 (±0.052) 0.935 (±0.017)
Bi-LSTM 0.747 (±0.064) 0.39 (±0.069) 0.615 (±0.061)
Transformer D2 0.799 (±0.026) 0.362 (±0.084) 0.646 (±0.05)
Transformer D4 0.672 (±0.107) 0.33 (±0.056) 0.479 (±0.061)
24In-depth Benchmarking of Deep Neural Network Architectures for ECG Diagnosis
Table 17: Result of multi-class classification (RBBB). Values are macro averaged F 1 av-
eraged of five independent trials. Values inside the bracket are standard deviation of five
independent trials.
PTB-XL G12EC CPSC
ResNet-18 0.766 (±0.039) 0.823 (±0.105) 0.92 (±0.028)
ResNet-34 0.738 (±0.065) 0.902 (±0.033) 0.882 (±0.053)
ResNet-50 0.673 (±0.089) 0.582 (±0.195) 0.823 (±0.047)
ResNext-50 0.766 (±0.047) 0.59 (±0.165) 0.863 (±0.047)
SE-ResNet-50 0.786 (±0.038) 0.569 (±0.191) 0.819 (±0.02)
EfficientNet b0 0.786 (±0.042) 0.577 (±0.076) 0.808 (±0.04)
EfficientNet b1 0.755 (±0.062) 0.626 (±0.223) 0.867 (±0.044)
MobilenetV3-L 0.759 (±0.084) 0.666 (±0.091) 0.884 (±0.026)
MobilenetV3-S 0.691 (±0.08) 0.502 (±0.064) 0.814 (±0.021)
Lambda-ResNet-18 0.745 (±0.061) 0.583 (±0.152) 0.784 (±0.038)
Lambda-ResNet-50 0.71 (±0.07) 0.451 (±0.165) 0.837 (±0.019)
NF-ResNet-18 0.741 (±0.063) 0.822 (±0.139) 0.883 (±0.049)
NF-ResNet-34 0.8 (±0.017) 0.848 (±0.13) 0.946 (±0.008)
NF-ResNet-50 0.763 (±0.051) 0.816 (±0.145) 0.946 (±0.014)
Bi-LSTM 0.651 (±0.04) 0.614 (±0.167) 0.784 (±0.043)
Transformer D2 0.68 (±0.046) 0.449 (±0.041) 0.694 (±0.042)
Transformer D4 0.667 (±0.085) 0.38 (±0.062) 0.609 (±0.065)
25You can also read