Full optical SESAM characterization methods in the 1.9 to 3-µm wavelength regime - ETH Zürich
←
→
Page content transcription
If your browser does not render page correctly, please read the page content below
Research Article                                        Vol. 29, No. 5 / 1 March 2021 / Optics Express   6647

Full optical SESAM characterization methods in
the 1.9 to 3-µm wavelength regime
J ONAS H EIDRICH , * M ARCO G AULKE , B EHCET O ZGUR
A LAYDIN , M ATTHIAS G OLLING , A JANTA B ARH , AND U RSULA
K ELLER
Department of Physics, Institute for Quantum Electronics, ETH Zürich, 8093 Zürich, Switzerland
* hejonas@phys.ethz.ch

Abstract: Semiconductor saturable absorber mirrors (SESAMs) are widely used for mode-
locking of various ultrafast lasers. The growing interest for SESAM-modelocked lasers in
the short-wave infrared and mid-infrared regime requires precise characterization of SESAM
parameters. Here, we present two SESAM characterization setups for a wavelength range of 1.9
to 3 µm to precisely measure both nonlinear reflectivity and time-resolved recovery dynamics.
For the nonlinear reflectivity measurement, a high accuracy (
Research Article Vol. 29, No. 5 / 1 March 2021 / Optics Express 6648
1%. Such SESAMs are required for example for modelocking optically pumped semiconductor
lasers (i.e. VECSELs and MIXSELs) [19,20], dual-comb modelocked solid-state lasers [21]
and high repetition rate lasers [22]. The high dynamic fluence range of more than three orders
of magnitude allows for a reliable measurement of the rollover parameter. The pump-probe
setup, tunable over the same wavelength range, determines the recovery times of the SESAM.
The recovery time of 2-µm SESAMs have been measured before [23], but to our knowledge the
required high-precision nonlinear reflectivity measurements have been missing.
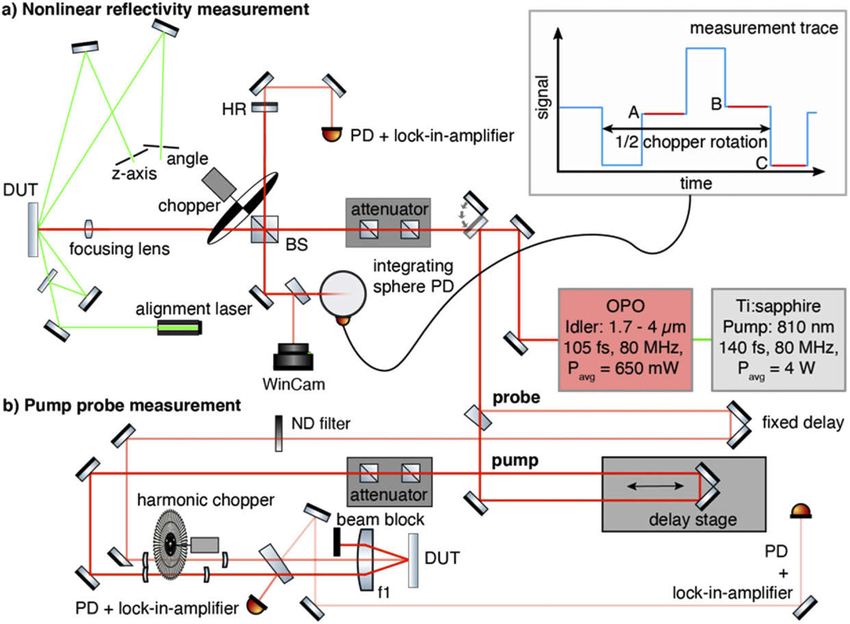
Fig. 1. Full SESAM characterization for an infrared wavelength range of 1.9–3 µm: a)
nonlinear reflectivity and b) recovery dynamics. The SWIR/mid-IR laser source is a tunable
femtosecond optical parametric oscillator (OPO) pumped by a modelocked Ti:sapphire laser.
The full power of the idler beam is used either for the nonlinear reflectivity or the pump-probe
measurement using a flip mirror for guiding the beam accordingly. DUT: device under test
(e.g. SESAM to be characterized), BS: beam splitter, PD: photodetector, HR: high reflector.
In section 2 we describe the measurement setups as shown in Fig. 1 with the alignment and
calibration procedure required for high-precision measurements. In section 3 we describe the
2–µm SESAM structures and the obtained characterization results.
2. Measurement setups
For both, the nonlinear reflectivity and time-resolved measurement setup, we use a commercial
broadband femtosecond (fs) optical parametric oscillator (OPO) (i.e. Radiantis Oria IR XT)
pumped by a femtosecond Ti:sapphire laser operating at 810 nm as shown in Fig. 1. The OPO
idler beam can be tuned from 1.7 – 4 µm with around 100-fs pulse duration at a repetition rate of
80 MHz and a maximum average output power of 650 mW. Broadband SWIR optics are used in
both setups such as metallic mirrors, broadband polarizers, mid-IR coated calcium fluoride lenses
and beam splitters. In addition, we use exchangeable extended InGaAs or InAsSb photodetectors.
Due to the OPO’s robustness against back-reflections, no optical isolator is needed in contrast to
prior approaches in the near-IR regime [15,16]. Isolators typically have the disadvantage of high
losses, high dispersion, a narrow bandwidth of transmission and high cost. Our selection of optics
enables a broadband characterization of SESAMs from 1.9 µm to 3 µm operating wavelength.
The effect of dispersive pulse broadening within the two setups are negligible. At the device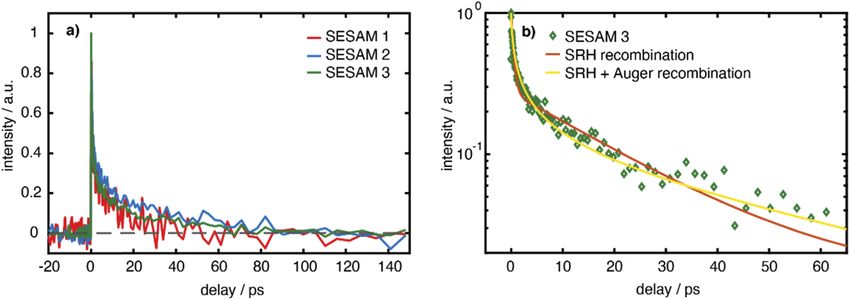
Research Article                                 Vol. 29, No. 5 / 1 March 2021 / Optics Express   6649

under test (DUT) position a pulse duration below 120 fs is estimated for both setups with a
high-dynamic fluence range over more than 3 orders of magnitude and an upper limit exceeding
intracavity conditions for SESAM modelocking. A flip mirror right after the OPO allows for
directing the beam with full power either into the nonlinear reflectivity or the pump-probe setup.
Further details on the setups are discussed in the following sub-sections.

2.1.     Nonlinear reflectivity measurement setup
The nonlinear reflectivity measurement setup (Fig. 1(a)) is designed to measure the nonlinear
reflectivity of SESAMs and is based on the principle given by Maas et al. [16]. The OPO has
sufficient output power (max. 650 mW) to operate the setup over a wavelength range from 1.9
to 3 µm. The optics are chosen carefully to cover a high dynamic fluence measurement range
of more than 103 . The power of the OPO beam, which determines the fluence on the DUT, is
adjusted during the measurement using a variable and a fixed wire grid polarizer. The variable
polarizer is mounted in a high-precision (60 µrad) stepper-motor stage. Wire grid polarizers have
the advantage of a high extinction ratio of 105 :1 over the full wavelength range and excellent
beam pointing stability when rotated. The subsequent reflection measurement part of the setup
has a Michelson-interferometer geometry where the beam is split into a probe and a reference
arm.
   We use a broadband (1–6 µm) coated calcium fluoride beam splitter to divide the OPO beam
into two parts that are sequentially blocked with a 2-slot chopper blade at a frequency of 110 Hz.
One part is reflected by a high reflecting (HR) reference mirror with a reflectivity > 99.5%. The
leakage of the reference mirror is focused onto a reference photodiode. The signal is measured
with a lock-in amplifier locked at 110 Hz and used for fluence monitoring. The SESAM under
test is probed with the focused sample beam. By selecting an appropriate focusing lens, both low
fluences down to 0.1 µJ/cm2 and high fluences up to 1500 µJ/cm2 can be obtained. These fluences
are sufficient to probe both the linear reflectivity (at low fluence level) and the inverse saturable
absorption regime (at high fluence level) of the GaSb-SESAMs under test. The reflected beams
from the reference mirror (HR) and the sample are recombined at the beam splitter and sent
into an integrating sphere photodetector with the advantage of being independent from beam
pointing instabilities and spatial inhomogeneities of the photodetector. A small part of the signal
beam (reflected from a flip-wedge) can be directed towards a microbolometer based mid-IR
camera (DataRay WinCamD-IR-BB), for imaging the reference and sample beam, which helps to
improve alignment.
   The recorded signal is dynamically amplified using a low-noise current amplifier (from 20 nA/V
to 1 mA/V) together with a 24-bit analog-to-digital converter sampling at 50 kS/s. An algorithm
sets the number of recorded measurement cycles (see measurement trace in Fig. 1(a)) depending
on the noise level of a pre-measurement. In order to achieve a similar error for every measurement
point, between 200 (low-noise case) to 500 (high-noise case) measurement cycles are chosen.
The SESAM reflectivity for each cycle R = (A − C)/(B − C) is calculated by synchronously
measuring the signal from the sample and the reference arm, referred as level A and B. The
subtraction of level C removes the photodiode offset. Averaging over the sampling points of each
level minimizes the detector and amplifier noise, whereas averaging over the reflectivity value of
each cycle reduces the influence of power fluctuations of the OPO, which typically happen on
a timescale of seconds. Using this method with an optimized algorithm, a precise reflectivity
measurement for 30 fluence values is performed in just 7 minutes.

2.1.1.    Alignment and calibration
The setup is calibrated prior to a set of nonlinear measurements of SESAMs. The rotation angle
of the polarizer is referenced to the power at the DUT position and the power at the reference
photodiode. To precisely determine the fluence on the DUT, the focal spot size is measured at the
Research Article                                 Vol. 29, No. 5 / 1 March 2021 / Optics Express   6650

DUT position by using a scanning slit profiler (DataRay Beam’R2). Subsequently, an absolute
reflectivity calibration is performed using a second dielectric HR mirror placed at the focal
position of the focusing lens. This HR mirror has a flat reflectivity of R = 99.9% over the entire
spectrum of the OPO (Fig. 3(b)), and we can calibrate the setup to obtain the absolute reflectivity
over the targeted fluence range. A sanity check is performed by measuring the reflectivity of
the same HR (instead of a SESAM) using the reference reflectivity. This should result in a flat
response over the full fluence range at the DUT. The result of this high precision measurement
reveals a reflectivity of R = 99.95% with a standard deviation of σ ≤ 0.04%. It is shown together
with the SESAM measurement results in section 3 Fig. 3(b) (yellow dotted). To briefly emphasize
this high accuracy is only achieved by minimizing beam pointing fluctuations due to moving
parts, low-noise amplification of robust integrating sphere photodetectors and a sophisticated
averaging method.
   To maintain this level of precision when placing a SESAM at the focal spot of the beam,
a three-step alignment procedure is performed. First, a rough alignment of the angular and
z-position of the sample is done with a green alignment laser (see Fig. 1(a)) [16]. In a second step,
the camera is used to match the beam profiles of the sample and reference arm by adjusting the
focus position of the SESAM. With this approach the SESAM can be placed exactly in the beam
waist after the focusing lens when the reflected beam from the sample matches the collimated
beam from the reference mirror. For a final fine adjustment step of the DUT position, the incident
fluence is set (by using the variable attenuator) slightly below the saturation fluence on the rising
reflectivity slope of the nonlinear reflectivity curve (as shown in Fig. 3(b)) such that any increase
in fluence should result in a higher value of reflectivity. A live SESAM reflectivity readout is
then used to maximize the reflectivity by fine tuning the DUT position in the focus.

2.2.    Time resolved measurement setup
Absorber recovery dynamics of a SESAM is an important characteristic and plays a crucial role in
stabilizing SESAM modelocking. We have developed a mid-IR pump-probe setup with the same
polarization using the femtosecond OPO for measuring the recovery times of our GaSb-SESAMs.
The OPO beam is guided into the pump-probe measurement setup using a flip mirror as it is
shown in Fig. 1(b). The fraction of reflected beam from an uncoated calcium fluoride wedge is
used as the probe and the transmitted higher intensity beam serves as the pump. While the probe
beam has a fixed path length, the pump beam is aligned to a retro reflector mounted on a 204 mm
long high-precision linear encoder stage (PI M-521). This enables for a long delay scanning
window of up to 680 ps. Since the stage has a spatial resolution of 0.1 µm corresponding to a
temporal resolution of 0.66 fs, it is well suited for pump-probe experiments with 100-fs pulses.
A variable attenuator (cross-polarizer) is used to control the pump fluence on the DUT, whereas
a filter wheel containing various neutral-density (ND) filters is used to control the probe fluence.
   We have used a single 42/30-slit harmonic chopper wheel to modulate the pump and probe
beam at different frequencies. Both beams are focused at the position of the chopper blade to
achieve a clear modulation. Afterwards, the probe beam is collimated with a lens of longer focal
length, resulting in a larger beam diameter for the probe beam compared to the collimated pump
beam.
   The pump and probe beam are aligned parallel to each other throughout this part of the setup,
so that one single aspheric lens (f1, in Fig. 1(b)) can be used for focusing both beams on the
DUT. This has the advantage that both beams precisely overlap at the focal position. Prior to
this focusing lens, a calcium fluoride wedge is used to partially reflect the pump beam to control
the pump fluence and monitor the OPO power. The focusing lens is placed such that the probe
beam passes exactly through its center whereas the pump beam is horizontally shifted and passes
through a peripheral region. This ensures an excellent beam pointing stability of the reflected
probe signal from the DUT while adjusting its position at the focus. Moreover, this geometry
Research Article Vol. 29, No. 5 / 1 March 2021 / Optics Express 6651
facilitates a clear separation of the reflected pump light. The larger size of the probe beam
compared to the pump beam at the input of the lens (f1) ensures a smaller focused spot size for
the probe beam and a complete spatial overlap with the pump spot at the focus position on the
DUT. The reflected probe light of a SESAM under test is detected using a self-assembled large
area extended InGaAs photodiode with a lock-in amplifier.
2.2.1. Alignment and measurement
In order to characterize the SESAMs, the wavelength of OPO is set to 2050 nm (see SESAM
details in section 3). A scanning slit profiler (DataRay Beam’R2) is used to separately measure
the spot size of the pump and probe beam, and to optimize their spatial overlap. The focus
of the probe beam has a diameter of 40 µm at the DUT position and is overlapped with the
elliptical pump beam of dimension 62 µm x 93 µm. The pump and probe fluences are calculated
by measuring their respective powers at the focal position. The fluence ratio between the pump
and probe beam is adjusted according to the saturation behavior of the SESAM, which is at least
100:1 for our case in order to prevent any saturation originating from the probe. These fluences
are controlled using the attenuator and ND filter as mentioned earlier.
The pump-probe signal is the direct reflectivity change ∆R/R of the SESAM. As the reflectivity
change is caused by a pump pulse and detected with a probe pulse, the pump-probe signal is found
in the frequency beating of the two beams. Generally, this signal intensity is much smaller than
the incoming probe intensity. As a consequence, the signal is measured with lock-in detection.
The harmonic chopper modulates the amplitude of the pump beam at a frequency of 2.55 kHz and
the probe beam at 1.821 kHz. The signal is detected at the difference frequency of 729 Hz rather
than at the higher sum frequency of the beating, as the difference frequency spans more octaves
with the probe modulation frequency of 1.821 kHz. This enables a more effective electronic
filtering.
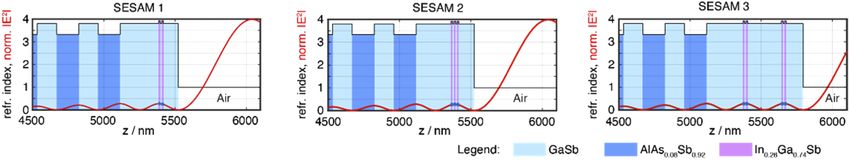
3. Results and discussion of 2.05-µm SESAMs
We have fully characterized three new GaSb SESAMs fabricated in the FIRST clean room facility
of ETH Zürich. The antiresonant SESAM designs used in this work are shown Fig. 2. All
samples are grown with molecular beam epitaxy (MBE) on (100) n-type GaSb substrates. A
GaSb buffer layer is followed by a 20 pair GaSb/AlAs0.08 Sb0.92 lattice matched DBR grown at
525 °C. The 11.5 nm thick In0.27 Ga0.73 Sb QWs are grown at 455 °C and embedded in a GaSb
barrier layer with a QW spacing of 10 nm.
Fig. 2. Three different 2.05-µm InGaSb/GaSb quantum well (QW) SESAM designs. The
refractive index variation (black) and the electric field intensity standing wave pattern
normalized to 4 in air (red) are plotted over the thickness of the structures. The position
of the QWs is marked with blue dots on the antinodes of the electric field intensity. Two,
three and four QWs are grown in SESAM 1, SESAM 2 and SESAM 3, respectively. The
semiconductor compounds are labeled with different colors (see Legend) for each area of
refractive index.
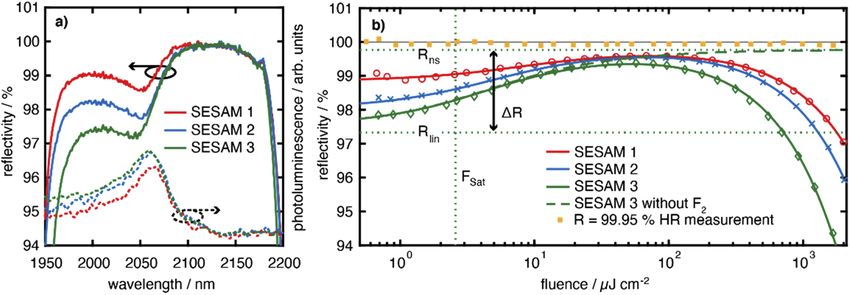
At first a low intensity spectral reflectivity measurement (Varian Cary 5E) over the stop band
of the SESAMs is carried out and shown in Fig. 3(a). The stop band is defined by the lowerResearch Article Vol. 29, No. 5 / 1 March 2021 / Optics Express 6652
high-reflecting GaSb/AlAs0.08 Sb0.92 DBR and reveals a broad stop-band bandwidth of around
200 nm. Based on the spectral position of the absorption dip around 2.05 µm, the nonlinear
reflectivity and pump-probe characterization is performed at a center wavelength of 2.05 µm. In
addition, Fig. 3(a) reveals the photoluminescence (PL) spectrum (Bruker Vertex 80 PL II) over
the identical wavelength range. The peaks of the PL signal originating from the QWs in the
SESAM structure match the absorption band edge at 2.05 µm. This PL peak intensity is about
two orders of magnitude lower than the PL signal originating from the GaSb substrate at 1.7 µm,
which indicates strong non-radiative decay mechanisms of excited carriers within the QWs.
Fig. 3. (a) Low intensity spectral reflectivity and photoluminescence (PL) measurement
of the investigated SESAMs. The reflectivity is plotted over the wavelength range of the
stop-band of the lower DBR. The PL intensity peak matches the QW absorption dip of
the spectral reflectivity measurement. (b) Nonlinear reflectivity measurement results. The
reflectivity is plotted over the fluence on the SESAM. Measurement results are plotted with
a fit for all three SESAMs according to Eq. (2). The green dashed line shows the fit for
SESAM 3 for no inverse saturable absorption e.g. F2 → ∞. The green dotted lines indicate
the reflectivity Rlin and Rns as well as the saturation fluence FSat for SESAM 3. The sanity
check measurement of the HR mirror (yellow squares) used for the calibration gives a high
precision reflectivity of R = 99.95% ± 0.04% over the full dynamic range.
The nonlinear reflectivity measurement of the three different SESAMs is shown in Fig. 3(b),
where the reflectivity is plotted as a function of incident fluence on the DUT. It increases with
fluence up to a point where induced absorption processes set in. Hence, the reflectivity decreases
again at higher fluence values. The model function for the nonlinear reflectivity of a SESAM
using a rate equation model for a two-level system is given as follows [15]:
(︂ (︂ )︂ )︂
ln 1 + RRlin
ns
(exp(F/F Sat ) − 1) (︃
F
)︃
RFlatTop
(F) = Rns · exp − . (1)
F/FSat F2
This determines the nonlinear reflectivity as a function of fluence (F) of a SESAM probed with a
flat top beam, with FSat the saturation fluence, Rlin the unsaturated reflectivity in the linear regime,
Rns the highest reflectivity limited by nonsaturable losses and F2 the rollover parameter. FSat is
determined as the fluence where the reflectivity reduces to 1/e of its maximum. The nonsaturable
losses originate from any linear absorption and scattering at impurities in the semiconductor.
Thus, the maximum reachable reflectivity of a SESAM is lower than the theoretical reflectivity
of 100%. Beyond that, induced absorption causes an inverse saturable absorption resulting in a
strong decrease in reflectivity at higher fluences [24]. This rollover becomes more important
with shorter pulses due to two-photon absorption and is quantified using the rollover parameter.
When applying this model, we assume that no considerable relaxation takes place over a pulse
duration and we neglect standing wave effects. Equation (1) has an additional modification for aResearch Article Vol. 29, No. 5 / 1 March 2021 / Optics Express 6653
Gaussian beam profile [15]
1 2FP FlatTop
RGauss (FP ) = ∫ R (F)dF, (2)
2FP 0
where the pulse fluence FP = EP /(πw2 ) is calculated from the pulse energy EP and the beam
waist w.
Table 1 shows the key parameters obtained from fitting the reflectivity function RGauss (FP ) with
the measurement data of each SESAM. The low saturation fluence between 2.6 and 5.0 µJ/cm2
is expected from a SESAM design with QWs placed in the antinodes of the standing wave
profile. It is possible to achieve higher saturation fluences for a SESAM by adapting the material
and structural design [5,25]. The modulation depth increases with the number of QWs due to
the higher number of carriers excited to saturate the SESAM. This is also found in the linear
reflectivity curve in Fig. 3(a). The investigated GaSb SESAMs show low non-saturable losses
of around 0.2%, which indicates excellent growth quality of the semiconductor epilayers. The
crystalline quality is confirmed using structural analysis like XRD rocking curve and differential
interference contrast microscopy. Since the rollover occurs at lower fluences for an increasing
number of QWs, there is significant induced higher order absorption in the QW layers of the
structure [26]. This can be explained with the inverse dependence of F2 on the two photon
absorption (TPA) coefficient [15] which becomes more dominant in the fs-regime [24]. The
TPA coefficient for GaSb and In0.27 Ga0.73 Sb can be estimated as 125 cm/GW and 775 cm/GW,
respectively [27,28]. The high bandgap material AlAs0.08 Sb0.92 results in negligible TPA in these
layers. Hence, the presence of more material with a high TPA coefficient shifts the rollover to
lower fluences.
Table 1. SESAM parameters obtained from the nonlinear reflectivity measurement at 2.05 µm
SESAM 1 SESAM 2 SESAM 3
QWs 2 3 4
Saturation fluence (µJ/cm2 ) 5.0 2.9 2.6
Modulation depth (%) 1.0 1.8 2.4
Non-saturable losses (%) 0.18 0.15 0.23
Rollover parameter (mJ/cm2 ) 70.6 50.8 29.3
The recovery dynamics of the SESAMs are investigated using the demonstrated pump-probe
setup with a pump fluence set to 32.2 µJ/cm2 . Since the pump-probe signal is determined by
the change in reflectivity, the pump fluence is set to a value below the SESAM rollover point.
This is also the condition where a saturable absorber is ideally operated in the laser cavity [14].
The fluence of the probe beam is set to a small value of 0.13 µJ/cm2 in order to prevent any
saturation effects from the probe pulse. The pump-probe measurements of the SESAMs are
plotted in Fig. 4(a). Time zero is set for the pump and probe pulse overlap. We subtract the small
background by averaging the signal before the temporal overlap and normalize the signal to its
maximum value. A trend towards a better signal-to-noise ratio is found for a SESAM with higher
modulation depth (e.g. for SESAM 3, green solid line). The pump-probe response shows a large
fast component, which drops to ∼ 30% of its initial value, and a subsequent slow component
> 10 ps.
In order to quantify the temporal response of the SESAMs, we apply the model for the total
recombination rate according to section 10.10 in [29]. The first order term in the model describes
non-radiative Shockley-Read-Hall (SRH) recombination (also called trap-assisted recombination),
the second order term describes the radiative bi-molecular recombination mechanism and the
third order term describes Auger recombination. In the subsequent analysis, we neglect theResearch Article Vol. 29, No. 5 / 1 March 2021 / Optics Express 6654
Fig. 4. (a) Pump-probe measurement results of the investigated SESAMs. (b) Different
models fitted to the pump-probe data of SESAM 3. The orange curve contains only
non-radiative band impurity Shockley-Read-Hall (SRH) recombination. The yellow curve
includes an additional Auger recombination channel.
radiative bi-molecular recombination mechanism as the measured PL signal (Fig. 3(a)) from the
QWs is strongly reduced as discussed above.
When considering only SRH recombination the conventional bi-exponential decay function
∆R(τ) = A e−τ/τ1 + (1 − A) e−τ/τ2 , (3)
is deducted as it used e.g. in [30]. Here A is the weighting factor between the two time constants
τ1 and τ2 . Equation (3) is fitted with the measurement data shown in Fig. 4(a). The obtained fit
parameters are given in Table 2.
Table 2. SESAM parameters measured using the pump-probe
setup at 2.05 µm
SESAM 1 SESAM 2 SESAM 3
A (%) 71 71 74
τ1 (ps) 0.56 0.73 0.47
τ2 (ps) 16 32 20
All samples exhibit a large weighting factor A > 70% together with a very short time constant
τ1 < 1 ps. This faster relaxation relies on intraband thermalization of exited carriers, whereas
the second slower relaxation happens due to the trap-assisted recombination in the QWs [1]. In
comparison to 1-µm SESAMs the measured second time constant can be considered fast. Thus,
our SESAMs reveal recovery timescales suitable for ultra-short pulse generation [12,31].
Although, Eq. (3) provides a satisfactory fit to the measured data and the obtained time scales
are sufficiently accurate with regards to modelocking, the additional effect of Auger recombination
on the recovery dynamics can be investigated as well. The Auger recombination is expected to be
enhanced in low-bandgap materials like GaSb and InGaSb [32]. Thus, we use the pump-probe
data of SESAM 3 for a comparison of a pure SRH band impurity recombination with a model
considering an additional Auger recombination channel.
The result of this comparison is shown in Fig. 4(b). The decay mechanism considering
both SRH and Auger recombination reveals a better fit (yellow solid) for the slow recovery
dynamics with a 10% smaller squared norm of the residual compared to pure SRH band impurity
recombination. Thus, we can conclude that Auger-recombination is present in GaSb-SESAM
structures but this decay channel remains difficult to be quantified.Research Article Vol. 29, No. 5 / 1 March 2021 / Optics Express 6655
4. Conclusion and outlook
We have demonstrated full SESAM characterization with an unprecedented accuracy in the
spectral region of 1.9 µm to 3 µm. It consists of a nonlinear reflectivity measurement setup
reaching an accuracy < 0.04% over a high dynamic fluence range of more than 103 , and a time
resolved measurement setup, both operated with a broadband femtosecond OPO system.
A full characterization of newly grown SESAMs for a center wavelength of 2.05 µm show
excellent performance for passive modelocking of diode-pumped solid-state and semiconductor
lasers: low saturation fluences of a few µJ/cm2 and extremely low nonsaturable losses (∼ 0.2%).
The number of QWs, can be used to adjust the modulation depth from 1 to 2.4%. The recovery
times between 10 and 30 ps are ideally suited for self-starting soliton modelocking [12]. The
contribution of Auger-recombination for GaSb based SESAMs could be demonstrated. Such a
full characterization of SESAMs is key for the development of state-of-the-art ultrafast lasers in
the SWIR and mid-IR regime.
Funding. H2020 European Research Council (787097).
Acknowledgements. We thank FIRST clean room facility at ETH Zurich.
Disclosures. The authors declare that there are no conflicts of interest related to this article.
References
1. U. Keller, K. J. Weingarten, F. X. Kartner, D. Kopf, B. Braun, I. D. Jung, R. Fluck, C. Honninger, N. Matuschek,
and J. Aus der Au, “Semiconductor saturable absorber mirrors (SESAM’s) for femtosecond to nanosecond pulse
generation in solid-state lasers,” IEEE J. Sel. Top. Quantum Electron. 2(3), 435–453 (1996).
2. U. Keller, “Ultrafast solid-state laser oscillators: A success story for the last 20 years with no end in sight,” Appl.
Phys. B 100(1), 15–28 (2010).
3. I. T. Sorokina and K. L. Vodopyanov, Solid-State Mid-Infrared Laser Sources (Springer, 2003).
4. A. Godard, “Infrared (2-12 µm) solid-state laser sources: a review,” Comptes Rendus Phys. 8(10), 1100–1128 (2007).
5. S. Kivistö, T. Hakulinen, M. Guina, and O. G. Okhotnikov, “Tunable Raman soliton source using mode-locked
Tm-Ho fiber laser,” IEEE Photonics Technol. Lett. 19(12), 934–936 (2007).
6. M. Guina, A. Härkönen, J. Paajaste, J.-P. Alanko, S. Suomalainen, C. Grebing, and G. Steinmeyer, “Passively
mode-locked GaSb-based VECSELs emitting sub-400-fs pulses at 2 µm,” Proc. SPIE 8242, 824204 (2012).
7. J. Ma, Z. Qin, G. Xie, L. Qian, and D. Tang, “Review of mid-infrared mode-locked laser sources in the 2.0 µm - 3.5
µm spectral region,” Appl. Phys. Rev. 6(2), 021317 (2019).
8. S. M. Link, A. Klenner, M. Mangold, M. Golling, B. W. Tilma, and U. Keller, “Dual-comb modelocked lasers,” Opt.
Express 23(5), 5521–5531 (2015).
9. S. M. Link, D. J. H. C. Maas, D. Waldburger, and U. Keller, “Dual-comb spectroscopy of water vapor with a
free-running semiconductor disk laser,” Science 356(6343), 1164–1168 (2017).
10. J. Yu, M. Petros, U. N. Singh, T. F. Refaat, K. Reithmaier, R. G. Remus, and W. Johnson, “An airborne 2-µm
double-pulsed direct-detection lidar instrument for atmospheric CO2 column measurements,” J. Atmos. Ocean.
Technol. 34(2), 385–400 (2017).
11. I. E. Gordon, L. S. Rothman, C. Hill, R. V. Kochanov, Y. Tan, P. F. Bernath, M. Birk, V. Boudon, A. Campargue, K.
V. Chance, B. J. Drouin, J. M. Flaud, R. R. Gamache, J. T. Hodges, D. Jacquemart, V. I. Perevalov, A. Perrin, K.
P. Shine, M. A. H. Smith, J. Tennyson, G. C. Toon, H. Tran, V. G. Tyuterev, A. Barbe, A. G. Császár, V. M. Devi,
T. Furtenbacher, J. J. Harrison, J. M. Hartmann, A. Jolly, T. J. Johnson, T. Karman, I. Kleiner, A. A. Kyuberis, J.
Loos, O. M. Lyulin, S. T. Massie, S. N. Mikhailenko, N. Moazzen-Ahmadi, H. S. P. Müller, O. V. Naumenko, A. V.
Nikitin, O. L. Polyansky, M. Rey, M. Rotger, S. W. Sharpe, K. Sung, E. Starikova, S. A. Tashkun, J. Vander Auwera,
G. Wagner, J. Wilzewski, P. Wcisło, S. Yu, and E. J. Zak, “The HITRAN2016 molecular spectroscopic database,”,” J.
Quant. Spectrosc. Radiat. Transfer 203, 3–69 (2017).
12. F. X. Kärtner, I. D. Jung, and U. Keller, “Soliton mode-locking with saturable absorbers,” IEEE J. Sel. Top. Quantum
Electron. 2(3), 540–556 (1996).
13. F. X. Kärtner, J. Aus Der Au, and U. Keller, “Mode-locking with slow and fast saturable absorbers - What’s the
difference?” IEEE J. Sel. Top. Quantum Electron. 4(2), 159–168 (1998).
14. R. Paschotta and U. Keller, “Passive mode locking with slow saturable absorbers,” Appl. Phys. B: Lasers Opt. 73(7),
653–662 (2001).
15. M. Haiml, R. Grange, and U. Keller, “Optical characterization of semiconductor saturable absorbers,” Appl. Phys. B
79(3), 331–339 (2004).
16. D. J. Maas, B. Rudin, A.-R. Bellancourt, D. Iwaniuk, S. V. Marchese, T. Südmeyer, and U. Keller, “High precision
optical characterization of semiconductor saturable absorber mirrors,” Opt. Express 16(10), 7571–7579 (2008).Research Article Vol. 29, No. 5 / 1 March 2021 / Optics Express 6656
17. L. Orsila, A. Härkönen, J. Hyyti, M. Guina, and G. Steinmeyer, “Ultrahigh precision nonlinear reflectivity measurement
system for saturable absorber mirrors with self-referenced fluence characterization,” Opt. Lett. 39(15), 4384–4387
(2014).
18. K. Viskontas and N. Rusteika, “All-fiber wavelength-tunable picosecond nonlinear reflectivity measurement setup for
characterization of semiconductor saturable absorber mirrors,” Opt. Fiber Technol. 31, 74–82 (2016).
19. A. Härkönen, J. Paajaste, S. Suomalainen, J.-P. Alanko, C. Grebing, R. Koskinen, G. Steinmeyer, and M. Guina,
“Picosecond passively mode-locked GaSb-based semiconductor disk laser operating at 2µm,” Opt. Lett. 35(24),
4090–4092 (2010).
20. B. W. Tilma, M. Mangold, C. A. Zaugg, S. M. Link, D. Waldburger, A. Klenner, A. S. Mayer, E. Gini, M. Golling,
and U. Keller, “Recent advances in ultrafast semiconductor disk lasers,” Light: Sci. Appl. 4(7), e310 (2015).
21. B. Willenberg, J. Pupeikis, L. M. Krüger, F. Koch, C. R. Phillips, and U. Keller, “Femtosecond dual-comb Yb:CaF 2
laser from a single free-running polarization-multiplexed cavity for optical sampling applications,” Opt. Express
28(20), 30275–30288 (2020).
22. L. M. Krüger, A. S. Mayer, Y. Okawachi, X. Ji, A. Klenner, A. R. Johnson, C. Langrock, M. M. Fejer, M. Lipson, A.
L. Gaeta, V. J. Wittwer, T. Südmeyer, C. R. Phillips, and U. Keller, “Performance scaling of a 10-GHz solid-state laser
enabling self-referenced CEO frequency detection without amplification,” Opt. Express 28(9), 12755–12770 (2020).
23. J. Paajaste, S. Suomalainen, A. Härkönen, U. Griebner, G. Steinmeyer, and M. Guina, “Absorption recovery dynamics
in 2 m GaSb-based SESAMs,” J. Phys. D: Appl. Phys. 47(6), 065102 (2014).
24. R. Grange, M. Haiml, R. Paschotta, G. J. Spühler, L. Krainer, M. Golling, O. Ostinelli, and U. Keller, “New regime of
inverse saturable absorption for self-stabilizing passively mode-locked lasers,” Appl. Phys. B 80(2), 151–158 (2005).
25. C. J. Saraceno, C. Schriber, M. Mangold, M. Hoffmann, O. H. Heckl, C. R. E. Baer, M. Golling, T. Südmeyer, and U.
Keller, “SESAMs for high-power oscillators: Design guidelines and damage thresholds,” IEEE J. Sel. Top. Quantum
Electron. 18(1), 29–41 (2012).
26. I. J. Graumann, “Novel Approaches to Power Scale Ultrafast Thin-Disk Lasers at Short Pulse Durations,” PhD thesis,
ETH Zurich (2020).
27. E. W. Van Stryland, M. A. Woodall, H. Vanherzeele, and M. J. Soileau, “Energy band-gap dependence of two-photon
absorption,” Opt. Lett. 10(10), 490–492 (1985).
28. M. D. Turner, W. B. Roh, and K. L. Schepler, “Nonlinear optical properties of GaSb and GaInAsSb and their
application for phase conjugation in degenerate four-wave mixing,” J. Opt. Soc. Am. B 17(5), 790–804 (2000).
29. M. Grundmann, The Physics of Semiconductors (Springer International Publishing, 2016, p. 374).
30. D. J. H. C. Maas, A. R. Bellancourt, M. Hoffmann, B. Rudin, Y. Barbarin, M. Golling, T. Südmeyer, and U. Keller,
“Growth parameter optimization for fast quantum dot SESAMs,” Opt. Express 16(23), 18646–18656 (2008).
31. R. Paschotta, R. Häring, A. Garnache, S. Hoogland, A. C. Tropper, and U. Keller, “Soliton-like pulse-shaping
mechanism in passively mode-locked surface-emitting semiconductor lasers,” Appl. Phys. B: Lasers Opt. 75(4-5),
445–451 (2002).
32. P. C. Findlay, C. R. Pidgeon, H. Pellemans, R. Kotitschke, B. N. Murdin, T. Ashley, A. D. Johnson, A. M. White, and
C. T. Elliott, “Auger recombination dynamics of InxGa1-xSb,” Semicond. Sci. Technol. 14(12), 1026–1030 (1999).You can also read