Potential of Megathrust Earthquakes Along the Southern Ryukyu Trench Inferred from GNSS Data
←
→
Page content transcription
If your browser does not render page correctly, please read the page content below
Potential of Megathrust Earthquakes Along the
Southern Ryukyu Trench Inferred from GNSS Data
Masayuki Kano ( masayuki.kano.a3@tohoku.ac.jp )
Tohoku university https://orcid.org/0000-0002-7288-4760
Aoi Ikeuchi
Tohoku University
Takuya Nishimura
Kyoto University
Shin'ichi Miyazaki
Kyoto University
Takeshi Matsushima
Kyushu University
Express Letter
Keywords: Ryukyu subduction zone, GNSS, interplate coupling, slow slip events, low-frequency
earthquakes
Posted Date: August 10th, 2021
DOI: https://doi.org/10.21203/rs.3.rs-779185/v1
License: This work is licensed under a Creative Commons Attribution 4.0 International License.
Read Full License
Page 1/17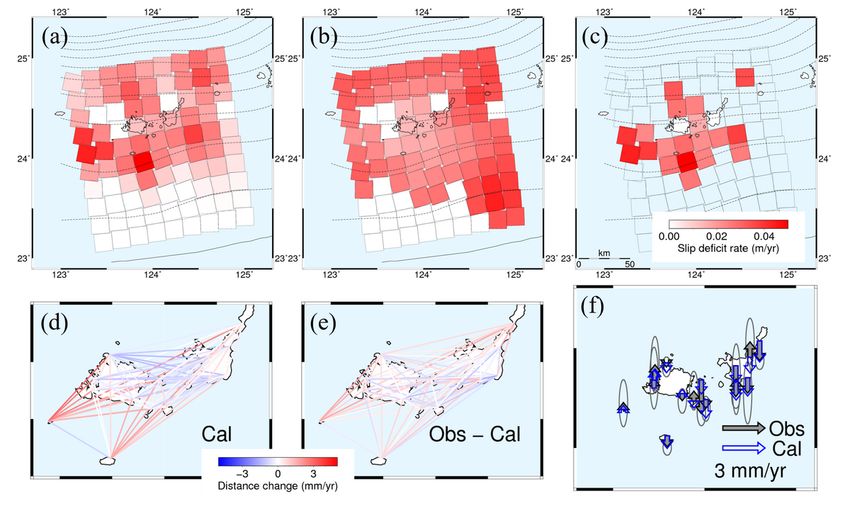
Abstract
The southern part of the Ryukyu subduction zone has recorded tsunami events with a recurrence interval
of several hundred years. Although their source is controversial, one model suggested that the last 1771
Yaeyama tsunami was caused by a shallow megathrust earthquake with a magnitude of 8. However, the
current knowledge on interplate coupling based on recent geodetic data is limited. This study analyzed a
time series of Global Navigation Satellite System data from January 2010 to February 2021, including
newly installed stations by Kyoto and Kyushu Universities to obtain the distance changes between
stations and vertical secular velocities. The distance changes ranged 2.4 mm/yr in contraction and 4.7
mm/yr in extension, and the vertical velocities exhibited no clear uplift or subsidence of -2.4 to 1.1 mm/yr.
The back slip inversion results indicated the slip deficit of 16–54 mm/yr in the south of the Yaeyama
Islands. The large slip deficit area is complementarily intervened between the shallower source area of
low-frequency earthquakes and the deeper slow slip region, suggesting the spatial heterogeneity of
frictional properties along the plate interface. If the large slip deficit area accumulates stress in the same
rate since the last 1771 earthquake, it could result in a megathrust event of at least greater than a
moment magnitude of 7.7. Because the limited onshore data cannot resolve the slip deficit on the
shallow plate interface, seafloor geodetic observations are essential to clarify the detailed spatial
distribution of slip deficit and discuss its earthquake and tsunami potential.

Introduction
The Yaeyama Islands are located in the extreme southwestern part of Japan, situated on the Ryukyu Arc
(Fig. 1a). This is the zone where the Philippine Sea plate (PH) is subducting northwestward along the
Ryukyu Trench at a rate of 8.0–8.5 cm/yr (Sella et al. 2002). In addition, back-arc spreading occurs along
the Okinawa Trough on the northern part of the islands (Sibuet et al. 1998) at a rate of 3.5–5.0 cm/yr
(Nishimura et al. 2004). Therefore, the plate convergence rate of 12.0–13.0 cm/yr in this region, relative
to the PH, is considered to be extremely fast.

Along the subducting PH interface, various types of fault slips with different time constants have been
documented. Based on the Global Navigation Satellite System (GNSS) observations, slow slip events
(SSEs), a slow fault slip that lasts for approximately one month, have been recurrently located at ~ 25 to
40 km depths beneath the northwestern part of Iriomote Island (Fig. 1a) (Heki and Kataoka 2008;
Nishimura 2014; Tu and Heki 2017). These SSEs occur approximately every six months with a moment
magnitude (Mw) of 6.6–6.7 (Kano et al. 2018b). The large slip areas of SSEs exhibit an average slip rate
of ~ 13 cm/yr. These are comparable to the relative plate motion, indicating that the main slip area is
entirely coupled during the inter-SSE period and the SSEs release most of the accumulated strain (Kano et
al. 2018b). On the shallower side of the SSE region at depths of ~ 10 to 20 km, the seismic signatures of
slow fault slips with dominant frequencies of a few Hz and a few tens of seconds, known as low-
frequency earthquakes (LFEs) and very low-frequency earthquakes (VLFEs), have often been identified
(Ando et al. 2012; Nakamura and Sunagawa 2015; Arai et al. 2016; Nakamura 2017). For the shallowest
part of the plate interface, Nakamura (2009) indicated the possibility of occurrence of the 1771 Yaeyama
                                                   Page 2/17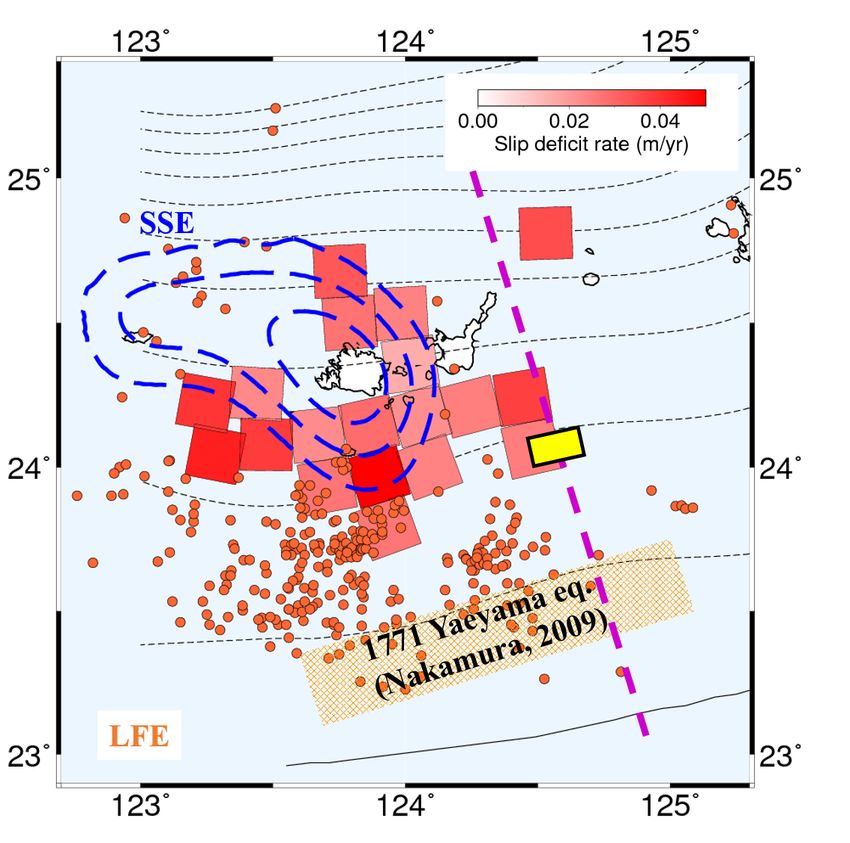
earthquake close to the Ryukyu Trench (Fig. 1a). He demonstrated that the shallow thrust-type fault
model with Mw of 8.0 can reproduce the tsunami height records observed at the Yaeyama Islands. In
addition, tsunami deposits that recorded four tsunami events with a recurrence interval of ~ 600 years
supported this shallow fault model. Based on the slip amount of the source model in Nakamura (2009),
the plate convergence rate, and recurrence interval of earthquakes, the seismic coupling ratio in the region
was estimated to be ~ 20% (Ando et al. 2018). Moreover, geodetic analysis indicated low interplate
coupling near the trench region. Watanabe and Tabei (2004) analyzed GNSS velocity data for 1996–
1999. Due to sparse GNSS stations, they combined GNSS data with the moment tensor data of shallow
earthquakes to increase the spatial resolution at shallow depths and suggested that interplate coupling
close to the trench in the analysis period was < 10%. Nevertheless, the source region of the 1771 Yaeyama
earthquake is still debatable, with proposed mechanisms defining it as a megathrust tsunamigenic
earthquake (Nakamura 2009), an intraplate earthquake with a submarine landslide (Imamura et al. 2008),
an earthquake along a splay fault (Hsu et al. 2013), and the collapse of an accretionary prism near the
trench (Okamura et al. 2018), as summarized in Fujiwara et al. (2020).

For further understanding of the interplate coupling along the entire southern Ryukyu subduction zone
from shallow to deep depths, additional GNSS stations were installed in the 2010s on the Yaeyama
Islands (Fig. 1a). Stable estimation of secular velocities and distance changes between stations is
currently possible due to the continuous acquisition of data. Therefore, this study estimates the spatial
distribution of the slip deficit rate (SDR) and discusses the possibility of a megathrust event in the
southern Ryukyu region by analyzing the secular velocities and distance changes.

Secular velocities and distance changes between GNSS stations on the Yaeyama Islands

The GNSS daily coordinates were analyzed to estimate the secular velocities at 14 GNSS stations
deployed on the Yaeyama Islands (Fig. 1a). The GNSS stations consist of four permanent GNSS Earth
Observation Network System (GEONET) stations (0500, 0749, 0750, and 0751) operated by the
Geospatial Authority of Japan (GSI), six stations (FNUK, INDA, KOHM, KRSM, OOHR, and SRH1) operated
by Kyoto University (KT), three stations (YKNK, YOGN, and YPNR) operated by Kyushu University (KS),
and one station (ISGK) operated by the National Astronomical Observatory of Japan (NAO). All GEONET
stations have been operational since the 1990s, and the NAO station was installed in 2002. In addition to
these stations, four of the KT stations (FNUK, KOHM, KRSM, and OOHR) were established in 2010, which
contributed to improving the spatial resolution for monitoring SSEs beneath the islands (Kano et al.
2018b). The remaining KT and KS stations were established in 2017 or 2018. The GNSS data from
January 2010 to February 2021 were pre-processed by Gipsy-X ver1.3/1.4 software to obtain the time
series of daily coordinates. The VMF1 mapping function (Boehm et al. 2006) and FES2014b model
(Lyard et al. 2021) were used for tropospheric delay modeling and correction of ocean tide loading,
respectively. The precise ephemerides and translational parameters of coordinates into the International
Terrestrial Reference Frame (ITRF) 2014 coordinate system were provided by the Jet Propulsion
Laboratory. Finally, the coordinates were converted to east-west (EW), north-south (NS), and up-down (UD)
components (Fig. 1b–1d).
                                                  Page 3/17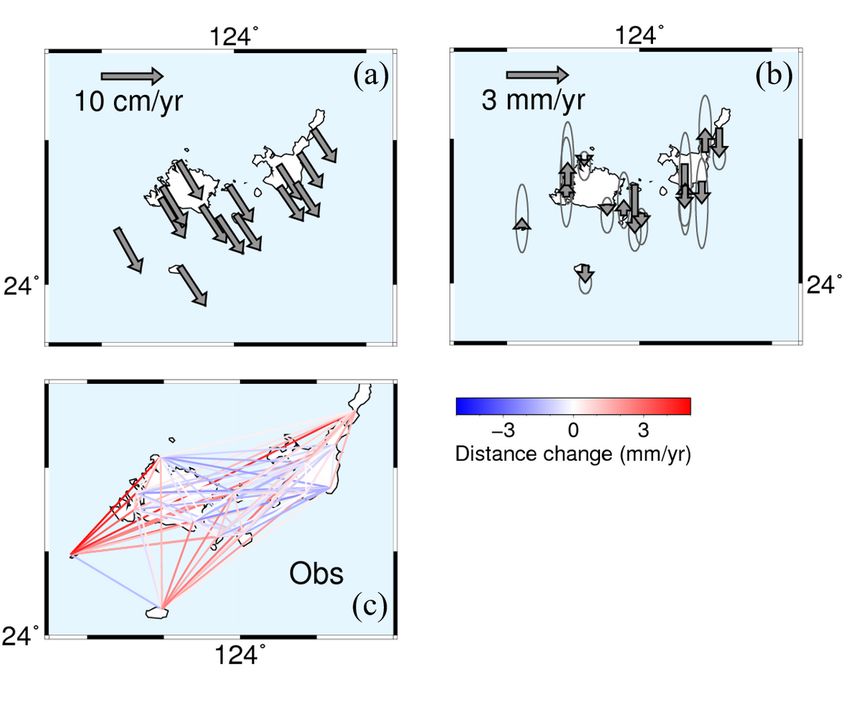
The secular velocity of each component at each GNSS station was estimated using est_noise software
(Langbein 2017), which assumes a temporal correlation for modeling the observation noise. Here, the
noise model was adopted in combination with white noise, flicker noise, random-walk noise, and band-
pass filtered noise of 0.5–2 cycles/yr with three poles, to maximize a likelihood function (Langbein
2004). The analysis modeled offsets due to antenna replacements or relocation of the antenna to the
nearby building, along with larger (> 6.0) magnitude in the unified hypocenter catalog provided by the
Japan Meteorological Agency (JMA) that occurred close to the Yaeyama Islands (Table 1). The obtained
secular velocities in the horizontal direction exhibited a south-southeastward motion of 63.9–80.2 mm/yr
with a maximum error of ~ 3.1 mm/yr in the ITRF 2014 (Fig. 2a). On the other hand, vertical velocities
were estimated to range approximately from − 2.4 to 1.1 mm/yr with errors ranging from ~ 0.5 to 2.5
mm/yr, thereby exhibiting no clear uplift or subsidence (Fig. 2b).

The obtained secular velocities were assumed to be composed of the combined effect of the rigid motion
of the South Ryukyu (SR) block where the Yaeyama Islands are located and that of the interplate coupling
if it exists. To eliminate the effect of the rigid block motion, the horizontal secular velocities were
converted to the distance changes between each pair of the stations. As a result, the distance changes
ranged 2.4 mm/yr in maximum contraction and 4.7 mm/yr in maximum extension. The distances in the
direction from east-west to northwest-southeast show contraction systematically and those in the
direction from northeast-southwest shown extension (Fig. 2c). The former is roughly parallel to the
direction of plate convergence and implies the interplate coupling. We used distance changes and vertical
secular velocities in the following inversion analysis.

Inversion Analysis
Assuming that the distance changes and the vertical secular velocities can be caused by interplate
coupling, we conducted the inversion to estimate SDR by implementing the backslip model (Savage
1983) in the following procedure. The plate interface of the subducting PH was modeled using the plate
geometry of Slab 2 (Hayes 2018) with planar subfaults (Fig. 3a). The entire region was divided
into 9 × 10 subfaults in the strike and dip directions, respectively. The size of each subfault was 20 × 20
km2 when the subfault was projected on the surface. The surface response due to fault slip rate in each
subfault was calculated by assuming the homogeneous elastic half-space (Okada 1992). The slip
direction in each subfault was fixed to N45W, which is an approximately opposite direction to that of the
subduction of the PH relative to the SR (Sella et al. 2002; Nishimura et al. 2004). We constrained non-
negative fault slips and assumed zero fault slip in the additional subfaults surrounding the entire fault
region, which were not explicitly represented in each figure. The smoothness constraint of the SDR in the
neighboring subfaults was introduced to stabilize the inversion. The inversion was conducted to
minimize the following cost function s(m):

                                                  Page 4/17
where d is the N-dimensional observed vector containing the distance changes and the vertical velocities,
G is the matrix consisting of an elastic response on the ground surface, m is the M-dimensional model
parameter vector including the amounts of SDR, E is the observation error covariance matrix, and L
indicates a Laplacian matrix having a rank of P. In this calculation, the cost function s(m) monotonically
decreases with an increasing value of hyperparameter in our problem, and thus the hyperparameter (
= 200) is adopted when the changing rate of a value in the cost function is small. The estimation
error of SDR is calculated from the corresponding diagonal element of the error covariance matrix C using
the optimum parameter vector .
Spatial Distribution Of Slip Deficit Rate
The inversion results indicated a SDR distribution in a wide area of the fault region with a value of up to
54 mm/yr in the south of Iriomote Island (Fig. 3a). The SDR distributions reproduced the observed
distance changes and the vertical secular velocities well (Fig. 3d–3f). However, their estimation errors
were large as well ranging from 12 to 44 mm/yr (Fig. 3b), which were comparable or larger than the SDR,
especially in the deep or eastern subfaults. Therefore, hereafter, we discuss only the subfaults whose
SDRs were larger than their errors. Most of these subfaults were located slightly on the south of the
islands at depths of ~ 20 to 30 km (Fig. 3c). Since the SDRs there were found to be well resolved in the
checkerboard test (Fig. S1, Text S1), the SDRs ranging from 16 to 54 mm/yr were considered to be
reliable. In contrast, the SDRs in the subfaults shallower than ~ 15 km were rarely resolved (Fig. S1b), so
that limited onshore GNSS solely cannot clarify the existence of the SDRs in the shallow plate interface
where Nakamura (2009) determined the source model of the 1771 Yaeyama earthquake (Fig. 1a).
Discussion
Figure 4 compares the spatial distributions of SDR with epicenters of LFEs (Arai et al., 2016; Nakamura,
2017) and slip rates of cumulative SSEs from July 2010 to February 2013 (Kano et al., 2018b). Notably,
our analysis newly suggests the existence of a large SDR region at depths of 20–25 km that is
complementarily distributed with LFE epicenters on the shallower side and the large slip area of SSE on
the deeper side. This may reflect that frictional properties vary with depth along the plate interface,
although whether the shallow plate interface where LFEs occur is coupled or not is uncertain due to the
Page 5/17low resolution (Fig. S1b). The depth boundary between large SDR and SSE areas was approximately 25
km, which corresponds to the structural boundary between the crust and mantle wedge in the overriding
plate as investigated by seismic reflection survey (Fig. 3 in Arai et al. 2016); the large SDR areas are
located below the arc crust while the large SSE areas are located below the mantle wedge. Although the
profile in the seismic survey (indicated by the purple line in Fig. 4) is itself located ~ 50 km east of
Ishigaki Island, the plate geometry does not change significantly in the along-strike direction, thus, the
fault slip style along the plate interface may be related to the structure in the overriding plate.
Our results reliably indicate SDRs of 16–54 mm/yr, especially to the south of the Yaeyama Islands, which
corresponds to 13–45% of the relative plate motion of the PH relative to the SR. One possibility is that the
slip deficit in this region could be released seismically. As there are no records of magnitude 8 class
earthquakes around the Yaeyema Islands for the 250 years following 1771 (Ando et al. 2018), it can be
stated that if this region accumulates slip deficit at the same rate in the 2010s analyzed in this study for
the 250-year period, the expected slip could exceed ~ 4 m and lead up to a maximum slip of 13.5 m. If we
assume an average slip of 4 m, a rigidity of 30 GPa, and a source region with 120 km length and 40 km
width (we refer this fault model as model I), it leads to an earthquake with Mw of ~ 7.7. The source region
in model I roughly corresponds to the large SDR areas (Fig. 4). As mentioned before, the resolution of the
subfaults shallower than the large SDRs is low (Fig. S1b), thus it may be possible that the source region
extends to shallower depths. If we extend the source region (120 km wide) near the trench axis (we refer
this fault model as model II) to reach the location where Nakamura (2009) estimated the source model of
the 1771 Yaeyema earthquake, the Mw becomes larger, up to ~ 8.3.
Usami (2010) reported from historical documents that Ishigaki Island experienced the ground shaking
corresponding to the JMA seismic intensity of IV in the 1771 Yaeyama earthquake as summarized in
Ando et al. (2018). Supposing that either of the models I or II caused this earthquake, both models could
result in the large ground shaking in the Ishigaki Island as reported by Usami (2010). Considering tsunami
runups, the tsunami deposits indicate that the 1771 earthquake generated large tsunamis leading to
maximum runups of ~ 27 m on the eastern coast of Ishigaki Island (e.g., Ando et al. 2018). As mentioned
above, the model II includes the source region of Nakamura (2009), which was determined to explain the
recorded tsunami heights by the numerical simulation. Therefore, model II can generate large tsunamis
as well. On the other hand, for model I, it is generally difficult to generate large tsunamis because it is the
interplate earthquake at depths of 20–25 km. Thus, a possible scenario to cause such a large tsunami
may be that a submarine landslide occurred in addition to the earthquake itself. Imamura et al. (2001)
proposed a model in which the submarine landslide triggered by an intraplate earthquake caused large
1771 tsunamis. The location of this source model is the eastern edge of the large SDR area (indicated by
a yellow square in Fig. 4), and thus if the interplate earthquake in model I resulted in a submarine
landslide in the same location, then the large tsunami runup height could be explained.
The other way to release SDRs is to slip aseismically, that is, through SSEs. Although SSEs were
recurrently identified with Mw greater than 6.2, particularly on the deeper side of the large SDR areas (Heki
and Kataoka 2008; Nishimura 2014), SSEs including the large SDR region as the source area, have not
Page 6/17been detected since at least the establishment of the GEONET. Considering the high resolution in the large
SDR region, the GNSS observations would be able to detect similar magnitudes of SSEs as that of the
deeper ones, if an SSE were to occur in the large SDR region. There are two possibilities; one possibility is
that quite a large SSE would occur in this region, but have not occurred at least in these two decades.
Suppose such a large SSE would occur with a recurrence interval of 30 years and can release all the slip
deficits, the SSE will have a Mw greater than 7.2 and be surely detected by GNSS. In this case, the SDRs
can be explained by only an aseismic slip. The other possibility is that, even if an SSE occurs within the
large SDR region, it may be too small to be detected by GNSS, and thus it would be difficult to explain the
large SDR based on such a series of relatively small SSEs. In this case, the large slip deficit would not be
released by solely an aseismic slip but seismically. Although the observation limited in both time and
space cannot resolve which possibility discussed above is true, continuous GNSS observations as well as
seafloor geodetic observations will reveal more about the potential of megathrust earthquakes in the
southern Ryukyu region.
Conclusion
We have estimated the spatial distributions of SDRs in the southern Ryukyu subduction zone based on
GNSS observations during the last 10 years. The inversion results indicated the reliable estimate of 16–
54 mm/yr in SDRs, corresponding to 13–45 % of the plate coupling on the south of the Yaeyama Islands.
The large SDR areas are located at depths of 20–25 km intervened by the LFE epicenters on the
shallower side and the SSE regions on the deeper side of the plate interface. If this region accumulates
stress in the same rate as in the recent decade since the last 1771 Yaeyama earthquake, it will have the
possibility to result in Mw 7.7 or larger megathrust earthquake. The limited onshore observation cannot
determine whether the large SDR regions extend to the shallow fault region near the trench axis as
estimated by Nakamura (2009) and the true tsunami source in 1771, current geodetic data indicate that
the southern side of the Yaeyama Islands has revealed the potential of megathrust earthquakes. Seafloor
geodetic observations will be essential to reveal more about the potential of this earthquake potential in
the southern Ryukyu region including the detailed spatial distribution of SDR at the shallower depths.
Abbreviations
PH: Philippine Sea plate; GNSS: Global Navigation Satellite System; SSE: Slow slip events; Mw: moment
magnitude; LFE: low-frequency earthquake; VLFE: very low-frequency earthquakes; SDR: slip deficit rate;
GEONET: GNSS earth observation network system; GSI: Geospatial Authority of Japan; KT: Kyoto
University; KS: Kyushu University; NAOJ: National Astronomical Observatory of Japan; ITRF: International
Terrestrial Reference Frame; JMA: Japan Meteorological Agency.
Declarations
Ethics approval and consent to participate
Page 7/17Not applicable.
Consent for publication
Not applicable.
Availability of data and materials
The GEONET data can be downloaded from https://terras.gsi.go.jp/ and the GNSS data operated by KT
and KS are available by contacting the authors. The GNSS data operated by NAO was provided by Y.
Tamura. The catalogs of LFEs (Arai et al. 2016; Nakamura 2017) were downloaded from “Slow
Earthquake Database” (Kano et al. 2018a; http://www-solid.eps.s.u-tokyo.ac.jp/~sloweq/) supported by
JSPS KAKENHI Grant Number JP16H06472 in Scientific Research on Innovative Areas "Science of Slow
Earthquakes."
Competing interests
The authors declare that they have no competing interests.
Funding
This study was supported by the JSPS KAKENHI Grant Number JP18K03796 and JP21K03694 in Grant-
in-Aid for Scientific Research (C), JP16H06474 in Scientific Research on Innovative Areas “Science of
Slow Earthquakes”, the Ministry of Education, Culture, Sports, Science and Technology (MEXT) of Japan,
under its Earthquake and Volcano Hazards Observation and Research Program, and the Special Project
for Seismology toward Research Innovation with Data of Earthquake from MEXT of Japan.
Authors' contributions
MK, SM, TN designed this study. MK and AI analyzed the GNSS time series to obtain the distance
changes. TN pre-processed the GNSS data using the Gipsy-X software. MK conducted inversion analysis
and prepared the manuscript. SM, TN, TM developed and maintained the GNSS station. All authors
discussed the results and approved the final manuscript.
Acknowledgements
We appreciate two anonymous reviewers and the editor for their fruitful comments to improve the
manuscript. Discussion with Ryuta Arai was helpful to interpret the results. Generic Mapping Tools by
Wessel & Smith (1998) are used to generate figures. We are grateful to the Jet Propulsion Laboratory for
the GipsyX software and related GNSS products.
Authors’ information
Page 8/171
Graduate School of Science, Tohoku University, 6-3, Aramaki-aza-aoba, Aoba-ku, Sendai 980-8578,
Japan. 2Disaster Prevention Research Institute, Kyoto University, Gokasho, Uji, Kyoto, 611-0011, Japan.
3
Graduate School of Science, Kyoto University, Kitashirakawa-Oiwake-cho, Sakyo-ku, Kyoto, 606-8502,
Japan. 4Institute of Seismology and Volcanology, Faculty of Science, Kyushu University, 2-5643-29
Shin’yama, Shimabara, Nagasaki, 855-0843, Japan.
References
1. Altamimi Z, Métivier L, Rebischung P, Rouby H, Collilieux X (2017) ITRF2014 plate motion model.
Geophys J Int 209(3):1906–1912. doi:10.1093/gji/ggx136.
2. Ando M, Nakamura M, Matsumoto T, Furukawa M, Tadokoro K, Furumoto M (2009) Is the Ryukyu
subduction zone in Japan coupled or decoupled? The necessity of seafloor crustal deformation
observation. Earth Planets Space 61:1031–1039. doi:10.1186/bf03352954.
3. Ando M, Tu Y, Kumagai H, Yamanaka Y, Lin CH (2012) Very low frequency earthquakes along the
Ryukyu subduction zone. Geophys Res Lett 39:L04303. doi:10.1029/2011GL050559.
4. Ando M, Kitamura A, Tu Y, Ohashi Y, Imai T, Nakamura M, Ikuta R, Miyairi Y, Yokoyama Y, Shishikura
M (2018) Source of high tsunamis along the southernmost Ryukyu trench inferred from tsunami
stratigraphy. Tectonophysics 722:265–276. doi:10.1016/j.tecto.2017.11.007.
5. Araoka D, Yokoyama Y, Suzuki A, Goto K, Miyagi K, Miyazawa K, Matsuzaki H, Kawahata H (2013)
Tsunami recurrence revealed by Porites coral boulders in the southern Ryukyu Islands, Japan.
Geology 41(8):919–922. doi:10.1130/G34415.1.
6. Arai R, Takahashi T, Kodaira S, Kaiho Y, Nakanishi A, Fujie G, Nakamura Y, Yamamoto Y, Ishihara Y,
Miura S, Kaneda Y (2016) Structure of tsunamigenic plate boundary and low-frequency earthquakes
in the southern Ryukyu trench. Nat Comm 7:12255. doi:10.1038/ncomms12255.
7. Boehm J, Werl B, Schuh H (2006) Troposphere mapping functions for GPS and very long baseline
interferometry from European Centre for Medium-Range Weather Forecasts operational analysis
data. J Geophys Res, 111(B2). doi:10.1029/2005JB003629.
8. Bertiger W, Bar-Sever Y, Dorsey A, Haines B, Harvey N, Hemberger D, Heflin M, Lu W, Miller M, Moore
AW, Murphy D, Ries P, Romans L, Sibois A, Sibthorpe A, Szilagyi B, Vallisneri M, Willis P (2020)
GipsyX/RTGx, a new tool set for space geodetic operations and research, Adv Space Res, 66(3):469–
489. doi:10.1016/j.asr.2020.04.015.
9. Fujiwara O, Goto K, Ando R, Garrett E (2020) Paleotsunami research along the Nankai Trough and
Ryukyu Trench subduction zones–Current achievements and future challenges. Earth-Sci Rev,
210:103333. doi:10.1016/j.earscirev.2020.103333.
10. Hayes GP, Moore GL, Portner DE, Hearne M, Flamme H, Furtney M, Smoczyk GM (2018) Slab2, a
comprehensive subduction zone geometry model. Science 362(6410):58–61.
doi:10.1126/science.aat4723.
Page 9/1711. Heki K, Kataoka T (2008) On the biannually repeating slow slip events at the Ryukyu trench,
southwestern Japan. J Geophys Res 113:B11402. doi:10.1029/2008jb005739.
12. Hsu SK, Yeh YC, Sibuet JC, Doo WB, Tsai CH (2013) A mega-splay fault system and tsunami hazard
in the southern Ryukyu subduction zone. Earth Plan Sci Let 362:99–107.
doi:10.1016/j.epsl.2012.11.053.
13. Imamura F, Yoshida Y, Moore A (2001) Numerical study of the 1771 Meiwa tsunami at Ishigaki
Island, Okinawa and the movement of the tsunami stones. Proc Coastal Eng Jpn Soc Civ Eng
48346–350 (in Japanese).
14. Imamura F, Goto K, Ohkubo S (2008) A numerical model for the transport of a boulder by tsunami. J
Geophys Res 113:C01008. doi:10.1029/2007jc004170.
15. Kano M, Aso N, Matsuzawa T, Ide S, Annoura S, Arai R, Baba S, Bostock M, Chao K, Heki K, Itaba S, Ito
Y, Kamaya N, Maeda T, Maury J, Nakamura M, Nishimura T, Obana K, Ohta K, Poiata N, Rousset B,
Sugioka H, Takagi R, Takahashi T, Takeo A, Tu Y, Uchida N, Yamashita Y, Obara K (2018a)
Development of a slow earthquake database. Seis Res Lett 89(4):1566–1575.
doi:10.1785/0220180021.
16. Kano M, Fukuda J, Miyazaki S, Nakamura M (2018b) Spatiotemporal evolution of recurrent slow slip
events along the southern Ryukyu subduction zone, Japan, from 2010 to 2013. J Geophys Res Sol
Earth 123. doi:10.1029/2018JB016072.
17. Kreemer C, Blewitt G, Klein EC (2014) A geodetic plate motion and Global Strain Rate Model.
Geochem Geophys Geosy 15(10):3849–3889. doi:10.1002/2014GC005407.
18. Langbein J (2004) Noise in two-color electronic distance meter measurements revisited. J Geophys
Res Sol Earth 109(B4). doi:10.1029/2003JB002819.
19. Langbein J (2017) Improved efficiency of maximum likelihood analysis of time series with
temporally correlated errors. J Geod 91(8):985–994. doi:10.1007/s00190-017-1002-5.
20. Lyard FH, Allain DJ, Cancet M, Carrère L, Picot N (2021) FES2014 global ocean tide atlas: design and
performance. Ocean Sci 17(3):615–649. doi:10.5194/os-17-615-2021.
21. Nakamura M (2009) Fault model of the 1771 Yaeyama earthquake along the Ryukyu trench
estimated from the devastating tsunami. Geophys Res Lett 36:L19307. doi:10.1029/2009GL039730.
22. Nakamura M (2017) Distribution of low-frequency earthquakes accompanying the very low
frequency earthquakes along the Ryukyu trench. Earth Planets Space 69(1):49. doi:10.1186/s40623-
017-0632-4.
23. Nakamura M, Sunagawa N (2015) Activation of very low frequency earthquakes by slow slip events
in the Ryukyu trench. Geophys Res Lett 42:1076–1082. doi:10.1002/2014gl062929.
24. Nishimura S, Hashimoto M, Ando M (2004) A rigid block rotation model for the GPS derived velocity
field along the Ryukyu arc. Phys Earth Plan Int 142(3–4):185–203. doi:10.1016/j.pepi.2003.12.014.
25. Nishimura T (2014) Short-term slow slip events along the Ryukyu trench, southwestern Japan,
observed by continuous GNSS. Prog Earth Plan Sci 1(1):22. doi:10.1186/s40645-014-0022-5.
Page 10/1726. Okada Y (1992) Internal deformation due to shear and tensile faults in a halfspace. Bull Seismol Soc
Am 82(2):1018–1040
27. Okamura Y, Nishizawa A, Fujii Y, Yanagisawa H (2018) Accretionary prism collapse: A new
hypothesis on the source of the 1771 giant tsunami in the Ryukyu Arc, SW Japan. Sci Rep
8(1):13620. doi:10.1038/s41598-018-31956-8.
28. Savage JC (1983) A dislocation model of strain accumulation and release at a subduction zone. J
Geophys Res Sol Ear 88(B6):4984–4996. doi:10.1029/JB088iB06p04984.
29. Sella GF, Dixon TH, Mao A (2002) REVEL: A model for recent plate velocities from space geodesy. J
Geophys Res 107(B4):2081. doi:10.1029/2000JB000033.
30. Sibuet JC, Deffontaines B, Hsu SK, Thareau N, Formal JPL, Liu CS, ACT Party (1998) Okinawa trough
backarc basin: Early tectonic and magmatic evolution. J Geophys Res 103:30245–30267.
doi:10.1029/98JB01823.
31. Tu Y, Heki, K (2017) Decadal modulation of repeating slow slip event activity in the southwestern
Ryukyu Arc possibly driven by rifting episodes at the Okinawa trough. Geophys Res Lett 44(18):9308-
9313. doi:10.1002/2017GL074455.
32. Usami T (2010) Seismic intensities and isoseismic contours of historical earthquakes in Japan.
Japan Electric Association, Tokyo (in Japanese).
33. Watanabe T, Tabei T (2004) GPS velocity field and seismotectonics of the Ryukyu arc, southwest
Japan. J Seismol Soc Jpn 57(1):1–10 (in Japanese with English abstract).
34. Wessel P, Smith WHF (1998) New, improved version of Generic Mapping Tools released. EOS Trans
AGU 79:579
Tables
Table 1. List of earthquakes considered in the analysis of the GNSS data.
Page 11/17Figures
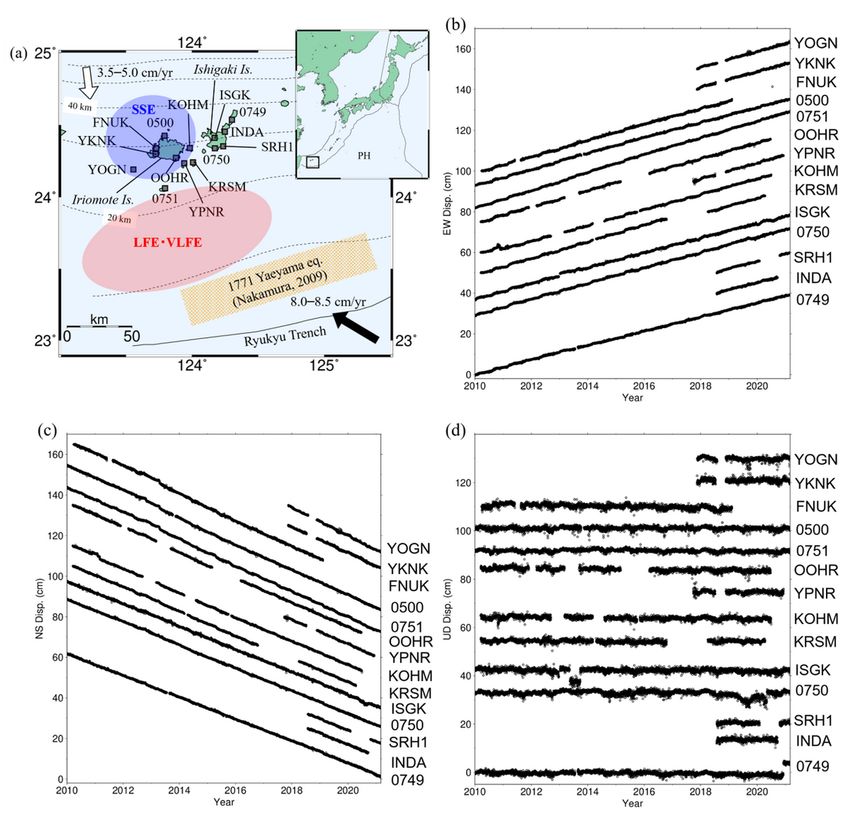
Page 12/17Figure 1
Tectonic setting and GNSS time series. (a) The study area. The black rectangle in the inset is the location
of the Yaeyama Islands where the Philippine Sea plate (PH) is subducting beneath the islands at a rate of
8.0–8.5 cm/yr relative to the South China block (Sella et al. 2002). The black squares are locations of the
GNSS stations with four-digit station codes. The red-, blue-, and orange- colored regions correspond to the
source areas of slow slip events (SSEs) (Heki and Kataoka 2008), low-frequency earthquakes (LFEs) (Arai
et al. 2016; Nakamura 2017), and the estimated source area in the 1771 Yaeyama earthquake (Nakamura
2009). The white arrow represents a motion of the back-arc spreading of the Okinawa trough (Nishimura
Page 13/17et al. 2004). The solid and dashed lines are the Ryukyu Trench and the depth contours of the upper
surface of the subducting PH with an interval of 10 km (Slab 2) (Hayes 2018). (b–d) GNSS time series
sorted from westernmost (top) to easternmost (bottom) stations in (b) east-west, (c) north-south, and (d)
up-down components. GNSS = Global Navigation Satellite System
Figure 2
Secular velocities and distance changes estimated from GNSS observations. (a) Horizontal and (b)
vertical components of the secular velocities in the ITRF2014. The 1-σ error ellipsoids are indicated, which
are small to visualize in the horizontal components. (c) Distance changes between each pair of the GNSS
stations.
Page 14/17Figure 3
Estimation of slip deficit rates (SDR) and the comparisons with observations. (a) Spatial distribution of
SDRs and (b) their estimation error. (c) Same as (a) but only for subfaults whose SDR is greater than the
estimation error shown. (d) Calculated distance changes and (e) residual distance changes. (f)
Comparison between the observed (black arrows) and calculated (blue arrows) vertical velocities.
Page 15/17Figure 4
Summary of spatial distributions of various fault slips in the southern Ryukyu subduction zone. The red-
colored squares indicate the SDR estimated in this study (Fig. 3c). The blue contours are the average slip
rate in the SSE region, which are calculated from the cumulative slip from July 2010 to February 2013
(Kano et al. 2018) with a contour interval of 40 mm/yr. The orange dots represent the epicenters of LFEs
(Arai et al. 2016; Nakamura 2017). Note that only the relocated LFEs in Nakamura (2017) using the S-P
time delays, as well as the cross-correlation of the envelope waveforms are plotted. The orange- and
Page 16/17yellow- colored squares are the source models of the 1771 Yaeyama earthquake estimated by Nakamura
(2009) and Imamura et al. (2001), respectively. The purple line indicates the location of the seismic
survey (Arai et al. 2016).
Supplementary Files
This is a list of supplementary files associated with this preprint. Click to download.
GraphicalAbstract.png
Kanoetal.additionalfile.docx
Page 17/17You can also read