The orientation of earthworms is influenced by magnetic fields - DergiPark
←
→
Page content transcription
If your browser does not render page correctly, please read the page content below
Turkish Journal of Zoology Turk J Zool
(2020) 44: 199-208
http://journals.tubitak.gov.tr/zoology/
© TÜBİTAK
Short Communication doi:10.3906/zoo-1904-51
The orientation of earthworms is influenced by magnetic fields
1, 2 3
Fehime Sevil YALÇIN *, Şükran YALÇIN ÖZDİLEK , Rukiye ALTAŞ
1
Department of Biology Education, Faculty of Education, Çanakkale Onsekiz Mart University, Çanakkale, Turkey
2
Department of Biology, Faculty of Science and Arts, Çanakkale Onsekiz Mart University, Çanakkale, Turkey
3
Graduate School of Natural and Applied Sciences, Çanakkale Onsekiz Mart University, Çanakkale, Turkey
Received: 30.04.2019 Accepted/Published Online: 23.09.2019 Final Version: 04.03.2020
Abstract: Earth has a natural magnetic field that many animals use for orientation and navigation. With the development of technology,
these natural systems have been exposed to high levels of man-made electromagnetism from the heavy usage of electric devices. This
study aims to understand the possible effects of artificial magnetic fields on the behavioral responses of the earthworm, which is used in
this study as a model organism in laboratory conditions. The 3 experimental groups, each composed of 20 earthworms, were exposed to
190–520 µT magnetic fields using a 1.5 V current for 1-h durations in a wire-wrapped vivarium. The experimental and control groups
were kept in similar conditions. A camera recorded the positions of the earthworms every 5 min. The angles, in terms of the mean vector
of each earthworm’s position beginning in the center of the vivarium, were documented using the Adobe Photoshop CS6 program. The
mean vectors and angles of different experimental designs and controls were compared using circular statistics. The orientations of
the earthworms in the control (261.4° ± 101.6°) and experimental (251.2° ± 94.1°) groups were statistically different (P < 0.005), and a
deviation of approximately 10° to the east was observed for the experimental group in comparison to the control group.
Key words: Soil, animal behavior, Lumbricus terrestris, electromagnetism
Earthworms (Lumbricus terrestris), typically soft- 2013). However, limited studies exist on the behavior and
bodied crawling and burrowing animals covered by thin orientation patterns of earthworms (Lavelle, 1988).
elastic cuticles, play significant roles in soil productivity The natural magnetic field (MF) of the Earth, the
by incorporating organic matter into the soil and plant geomagnetic field, is generated mainly by a source located
growth in agricultural contexts (Lavelle and Martin, in the interior of the Earth but is also influenced by external
1992; Bastardie et al., 2003; Weiler and Naef, 2003; Ernst sources such as solar wind and the ionosphere. Earth’s
et al., 2009). Earthworms are a key invertebrate, having a natural magnetic field is important for the navigational
function in the ecosystem as ecosystem engineers building and orientation abilities of some migratory animals, such
large and resistant organomineral structures which affect as ants (Banks and Srygley, 2003), honey bees (Kirschvink
the environment of smaller organisms in the soil (Giller and Kirschvink, 1991), birds (Wiltschko and Wiltschko,
et al., 1997). Due to their ecological importance as key 1996), and sea turtles (Lohmann, 1991). For the last 2
organisms in soil ecology, the dispersion and movement decades, studies on the effects of man-made magnetic
of earthworms has interested many researchers, in fields have also focused on the behavioral patterns and
addition to their effects on abiotic entities, such as soil deviations of migration routes in organisms such as
moisture and temperature, soil organic matter content, molluscs and crustaceans (Bochert and Zettler, 2006),
soil texture, bulk density, pH values, and soil moisture spiny lobsters (Lohmann, 1985), fish (Quinn and Groot,
content (Cannavacciuolo et al., 1998; Whalen and Costa, 1983, Foroozandeh and Derakhshan-Barjoei, 2018), and
2003; Decaëns and Rossi, 2008; Valckx et al., 2010), biotic sea turtles (Lohmann, 1991).
factors such as individual behavior and food consumption The electronic devices we use in nearly every facet
(Shipitalo et al., 1988), and the combination of these of our lives and the electric cables buried under soil and
factors influencing the movement of earthworms (Martin marine sediments all produce a magnetic field (MF).
and Lavelle, 1992; Palm et al., 2013; Budán et al., 2014; There has been much research on the positive and negative
Wetzel et al., 2016). Their distribution patterns have also impacts of both natural and man-made magnetic field and
been well-defined by agroecosystem models (Palm et al., electromagnetic field on plant organisms (Aladjadjiyan
* Correspondence: sevilyalcin@comu.edu.tr
199
This work is licensed under a Creative Commons Attribution 4.0 International License.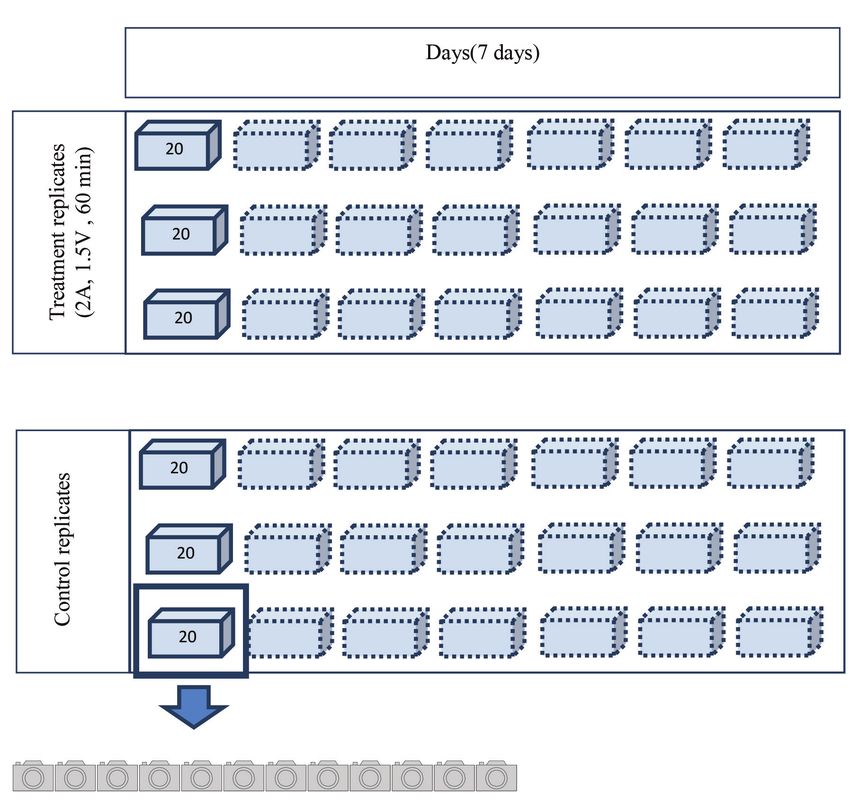
YALÇIN et al. / Turk J Zool
and Ylieva, 2003; Vian et al., 2016), invertebrates (Bochert during the experiment. All of the captive animals and
and Zettler, 2006; Love et al., 2015), vertebrates (Lohmann, experiments were held at the room temperature reached
1993; Skauli et al., 2000;Odacı and Özyılmaz, 2015), and at noon in order to minimize the effect of geomagnetism
even humans (Simko et al., 1998; Sun et al., 2009; Lee et on the circadian difference in reaction rates in earthworms
al., 2016). Experimental studies indicate that MF and EMF (Bennett and Huguenin, 1969). Although the laboratory
cause different kinds of changes in biological activities, conditions applied to the worms were kept constant as
such as oxidative and genotoxic effects, survival ratio, and explained above, these conditions can never coincide
metabolic rates. Some studies have examined the impacts with natural environmental conditions as temporal and
of MF on the growth parameters of some invertebrates. spatial plasticity and uncontrollable conditions may affect
For example, a 3.7-mT static MF caused a decrease the behavior patterns of earthworms. However, both
in condition index values of the blue mussel, Mytilus experimental and control group animals were kept in the
edulis (Bochert and Zettler, 2006). A limited number same conditions, and experiment processes followed the
of studies have examined the orientation of L. terrestris same procedure in the control and treatment groups. These
in nature (Quillin, 1999); however, there is a gap in the processes contributed to make the results more precise;
research of earthworm movement patterns under artificial moreover, repeating the experiments 3 times increased the
magnetic field conditions. Underground electric and reliability of the results.
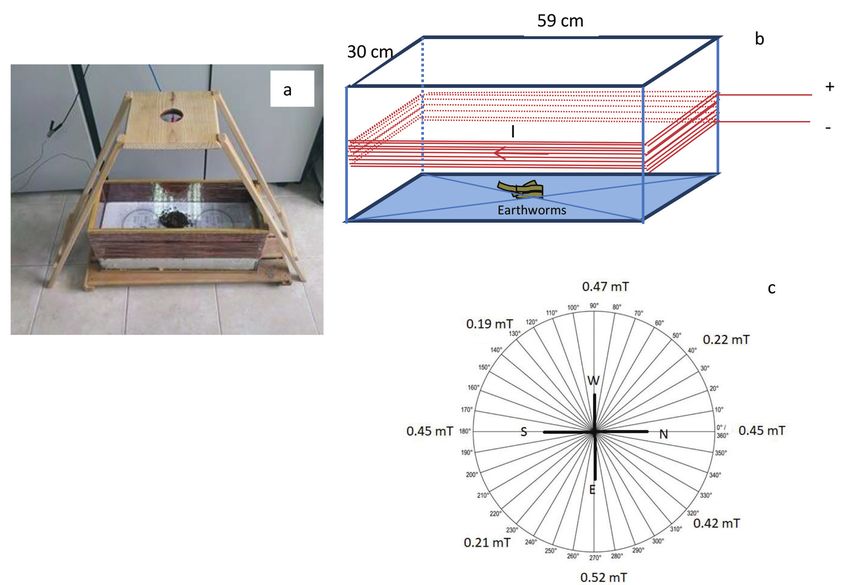
telephone cables may affect organisms in the soil, which Two dielectric glass vivaria with approximate
have both ecological and agricultural importance. Man- dimensions of 59 × 30 × 23 cm were used for observing
made MF may therefore affect biological characteristics the earthworms. A sheet of paper indicating the unit circle
such as orientation-related distribution patterns of these angle was placed under each vivarium in order to determine
important animals. the positions of the earthworms during navigation. To
The present study aims to understand the possible photograph the animals in the same conditions, a special
effects of manmade magnetic fields on the behavioral tool was designed, which is shown in Figure 1a. We
responses of earthworms, which are often used as model placed the camera on this tool, and the positions of all
organisms. We hypothesized that artificial magnetic fields earthworms were recorded from the same distance. For
would affect the orientation patterns of earthworms under the experimental design, a 262.4-m long, 2-mm diameter
conditions of modified magnetic fields in the laboratory, copper wire was wrapped around the vivarium (Figures
which are very different from those of the fields in its 1a and 1b). A power supply (MEB Ders Aletleri Yapım
natural environment. Merkezi©) with a 0.2 A current and 1.5 V voltage was
Experimental groups (MF-induced) and control groups used to produce an MF intensity between 190 and 520
(non-MF) were distinguished in order to understand the µT in the vivarium. These values are assumed as larger
effects of MF on animal behavior patterns. than detectible limits of invertebrates. The MF intensity
L. terrestris were used in this study due to their high in the vivarium was measured using a PHWYE digital
ecological and agricultural importance and for their ease teslameter (PHYWE, Göttingen, Germany). Because the
of maintenance in laboratory conditions. Earthworms, worms are exposed to different MF intensities in their
along with their original soil samples, were collected from natural habitats, heterogeneous areas were created using
the Çanakkale public park. Collected worms from different the vivarium’s rectangular shape in this study. Figure 1c
locations may have originated from different genetic pools, indicates the vivarium position, unit circle angles, and MF
or they may have been exposed to different environmental intensities in the experimental group. The other vivarium,
conditions. To eliminate these possibilities, all earthworms used for the control group, was not wrapped in wire.
were collected from the same area with both experiment The experimental design of this study is shown in
and control groups replicated 3 times. Because of this, we Figure 2. For each experimental group, 20 earthworms
can assume that all animals originated from similar genetic were kept in a smaller bowl in the same conditions as the
pools and grew up in similar environmental conditions. As original stock. Twenty earthworms were placed in the
the original stock, a total of 120 earthworms were kept in center of a vivarium with a little of the stock soil with the
laboratory conditions in a plastic wash bowl with the soil 0.2-A current, 1.5-V power supply in place to produce an
collected from their natural environment. In the laboratory MF intensity measuring 190–520 µT inside the vivarium.
prior to the experiment, the earthworms were kept in the This vivarium was exposed to a current of the same
same environmental conditions, with a natural magnetic intensity and voltage for 60 min. The animals’ movements
field of ~46 µT (Ates et al., 2015); the moisture, pH, and were observed for a 60-min period, and a camera recorded
light kept at 1%–2% wet, 8, and 2000 lumens, respectively. their positions in the vivarium every 5 min. After the 60-
The moisture and pH in the stock were measured using min period, the earthworms were kept in the small bowl in
a moisture meter with light and pH (AEK, Tech©) daily stable conditions until the next day when the next trial took
200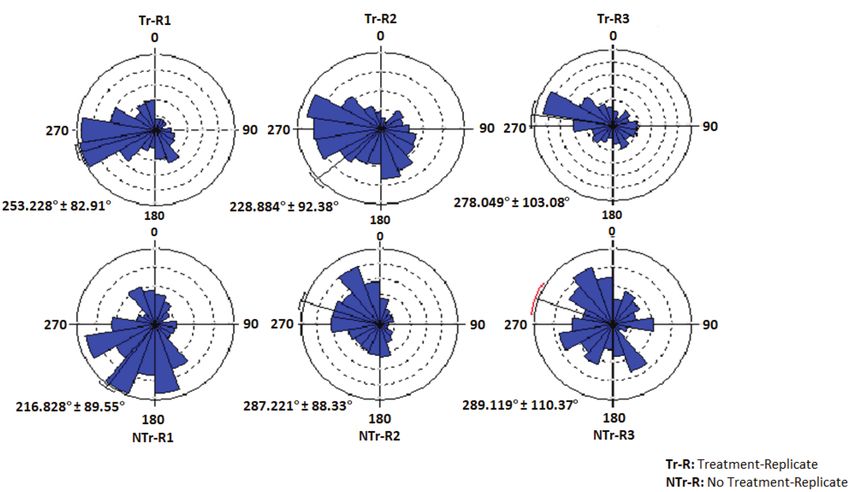
YALÇIN et al. / Turk J Zool

Figure 1. The coiled vivarium with tool for camera (a); the experimental setup, I indicates current (b); the measured MF intensities and
directions of application setting (c).

place at the same time of day. Each trial was implemented             Excel file; for analysis purposes, data were tested using a
for 7 days with 3 replicates. A total of 60 earthworms were           circular statistic (Oriana). The significance of each mean
used in 21 days.                                                      angle for each experimental and control worm at every 5
    Twenty worms were placed in the center of the                     min interval was measured by Rayleigh test (Zar, 1976).
vivarium with a little of the stock soil. A camera recorded           The homogeneity of the distribution of these angles (in
the positions of the earthworms every 5 minutes during a              other words, whether the distribution of these angles
60-min period. The earthworms were then left to rest in a             was equal) was determined using the Mardia–Watson–
small bowl until the same time the next day. This process             Wheeler test for each 5-min increment of data and for
was ongoing for 7 days for the same 20 worms. Following               the total 60 min of data for the control and experimental
this, control trials, on what are here called nontreatment            groups. During earthworm orientation, the mean vector
groups, were conducted using another 20 worms with the                and the mean vector length with circular standard error of
same procedures (Figure 2).                                           each direction of the earthworms were calculated. Mean
    The photographs recorded every 5 min were analyzed                values for control and experimental groups were then
using Adobe Photoshop CS6 to assess the orientation                   compared using Watson’s U² test (Mardia and Jupp, 2000).
patterns. In the program, the pictures were positioned in                 Following the 7-day–long treatment, the mean
the north–south direction, and starting from the center,              vectors of control and experimental groups were 261.3°
the angles of each position in the 5-min increments were              ± 101.6° and 251.1° ± 94.1°, respectively. A deviation of
determined using unit circle angle. In addition, in order             approximately 10° towards the east was observed in the
to make the angles precise, the angles of each earthworm              treatment groups (Table 1). The mean vector lengths of
were measured and the position of each earthworm on the               control and experimental groups were 0.21 and 0.26,
snapshot taken every 5 min using the Adobe Photoshop                  respectively. However, the angles of the earthworms in
program were recorded. These angles were recorded in an               both the treatment and control groups were distributed

                                                                                                                                   201
YALÇIN et al. / Turk J Zool
Figure 2. Experimental design of the study: 20 earthworms were placed into each vivarium.
Table 1. The mean vector and standard deviation (SD) of experimental and control groups at 5-min intervals.
Control group Experimental group Significance
Duration, Number of Watson between control
minutes observations Mean vector Rayleigh Mean vector Rayleigh U2 and experimental
± SD test with P ± SD test with P groups
5 840 266.9° ± 118.5° 5.8YALÇIN et al. / Turk J Zool
Table 2. The mean vector (MV), circular variance (CV), Rayleigh test (Z), and significance of Rayleigh test (P) for each treatment
and time interval, with 3 replicates.
Replicate 1 Replicate 2 Replicate 3
Variable Subgroup
MV (µ) CV Z P MV (µ) CV Z P MV (µ) CV Z P
5 196.6° 0.9 3.8 0.023 174.0° 0.7 16.4YALÇIN et al. / Turk J Zool Table 3. Mardia–Watson–Wheeler test results (below diagonal) with significant values (upper diagonal) between treatment (TR) and nontreatment (NTR) groups for each replicate and each time interval. 5 Min TR1 TR2 TR3 NTR1 NTR2 NTR3 35 Min TRe1 TR2 TR3 NTR1 NTR2 NTR3 TR1 ----- 0.11 0.52 0.86 0.003 NA TR1 ----- 0.71 0.002 0.00* 0.27 NA TR2 4.42 ----- 0.01 0.23 0.00* NA TR2 0.69 ----- 0.01 0.02 0.54 NA TR3 1.30 10.59 ----- 0.22 0.003 NA TR3 12.47 9.637 ----- 0.00* 0.15 NA NTR1 0.31 2.92 3.05 ----- 0.00* NA NTR1 13.5 8.16 20.4 ----- 0.00* NA NTR2 11.8 34.0 11.3 19.1 ----- NA NTR2 2.65 1.24 3.82 15.17 ----- NA NTR3 NA NA NA NA NA ----- NTR3 NA NA NA NA NA ----- 10 Min 40 Min TR1 ----- 0.02 NA 0.75 0.00* NA TR1 ----- 0.00* 0.016 0.00* 0.00* NA TR2 7.73 ----- NA 0.22 0.00* NA TR2 15.41 ----- 0.00* 0.03 0.01 NA TR3 NA NA ----- NA NA NA TR3 8.23 28.94 ----- 0.00* 0.31 NA NTR1 0.58 3.04 NA ----- 0.00* NA NTR1 44.0 6.93 23.9 ----- 0.004 NA NTR2 48.2 22.8 NA 26.52 ----- NA NTR2 20.2 10.2 2.37 11.06 ----- NA NTR3 NA NA NA NA NA ----- NTR3 NA NA NA NA NA ----- 15 Min 45 Min TR1 ----- 0.00 0.60 0.01 0.01 0.44 TR1 ----- 0.078 0.00* 0.00* 0.00* NA TR2 24.80 ----- 0.00 0.00* 0.00* 0.00* TR2 5.094 ----- 0.00* 0.00* 0.00* NA TR3 1.01 19.72 ----- 0.16 0.00* 0.07 TR3 24.9 41.2 ----- 0.00* 0.60 NA NTR1 9.43 21.7 3.61 ----- 0.00* 0.00* NTR1 28.9 5.7 30.4 ----- 0.00* NA NTR2 10.2 43.7 13.9 26.73 ----- 0.14 NTR2 17.6 15.4 1.0 15.3 ----- NA NTR3 1.66 27.0 5.33 14.33 3.89 ----- NTR3 NA NA NA NA NA ----- 20 Min 50 Min TR1 ----- 0.00* 0.69 0.003 0.012 NA TR1 ----- 0.00* 0.00* 0.00* 0.00* 0.00* TR2 15.6 ----- 0.00* 0.31 0.00* NA TR2 14.92 ----- 0.00* 0.07 0.21 0.50 TR3 0.74 14.0 ----- 0.02 0.002 NA TR3 45.18 27.89 ----- 0.00* 0.07 0.00* NTR1 11.7 2.33 8.27 ----- 0.00* NA NTR1 15.8 5.21 37.4 ----- 0.00* 0.06 NTR2 8.92 43.9 13.0 33.08 ----- NA NTR2 16.5 3.12 5.24 14.58 ----- 0.25 NTR3 NA NA NA NA NA ----- NTR3 16.8 1.40 13.1 5.56 2.80 ----- 25 Min 55 Min TR1 ----- 0.75 0.31 0.001 0.17 NA TRep1 ----- 0.03 0.00* 0.00* 0.00* 0.00* TR2 0.57 ----- 0.44 0.01 0.11 NA TRep2 7.31 ----- 0.00* 0.00* 0.01 0.00* TR3 2.36 1.63 ----- 0.00* 0.20 NA TRep3 35.09 19.23 ----- 0.00* 0.01 0.02 NTR1 13.0 8.83 14.2 ----- 0.00* NA NTRep1 28.3 14.9 42.9 ----- 0.01 0.00* NTR2 3.58 4.36 3.21 18.91 ----- NA NTRep2 24.2 9.41 9.46 8.68 ----- 0.13 NTR3 NA NA NA NA NA ----- NTRep3 40.6 23.6 8.46 14.19 4.02 ----- 30 Min 60 Min TR1 ----- 0.50 0.03 0.00* 0.01 0.01 TR1 ----- 0.09 0.00* 0.00* 0.00* 0.00* TR2 1.39 ----- 0.002 0.00* 0.02 0.00 TR2 4.83 ----- 0.00* 0.00* 0.01 0.00* TR3 7.13 12.3 ----- 0.00* 0.41 0.60 TR3 26.04 13.26 ----- 0.00* 0.00* 0.00* NTR1 21.3 15.9 41.7 ----- 0.00* 0.00* NTR1 23.7 13.1 36.9 ----- 0.04 0.07 NTR2 8.83 7.44 1.81 36.70 ----- 0.74 NTR2 15.9 8.80 11.0 6.73 ----- 0.70 NTR3 9.94 11.5 1.04 42.72 0.61 ----- NTR3 24.4 16.9 15.1 5.47 0.71 ----- 204
YALÇIN et al. / Turk J Zool

 Figure 3. The distribution and mean angles of earthworms in the control and experimental groups exposed to MF during the 60-min
 period repeated over 7 days.

 Figure 4. The direction and mean vectors of earthworms during 60-min application. Each color indicates the 5-min intervals
 indicated in the color panel.

southeastern direction. There was about 10° deviation              the 5-minute intervals (P < 0.001). Significant variation was
in the eastward direction in treatment groups compared             observed in mean vectors of both control and experimental
to the control. As seen in Figure 1, the highest magnetic          groups in the first 35 min. Following the first 35 min,
field was measured in the east at about 260°–280°. The             circular variation decreased in the treatment group (Table
earthworms also showed clumping and climbing behaviors             1). The earthworms exposed to MF were observed at nearly
by the end of MF application in the experimental groups.           every angle in the first 5 min; they were then observed in
    The mean vectors of experimental and control groups            the southeastern (SE) direction and 15 min later in the
at 5-min intervals are shown in Table 1. Neither control nor       northeastern (NE) direction. Most of the control group
experimental group mean vectors show uniformity in any of          earthworms were positioned towards the NE direction for

                                                                                                                             205
YALÇIN et al. / Turk J Zool
the duration of observation (Figure 4). As a function of compared to those of the control group earthworms. The
time, the mean angles in treatment groups angles increased clitellum is responsible for secreting the sticky clear mucus
regularly over the 60-min period (Figure 4). that covers the worm. This excessive secretion reduces
Early well-known research indicates that L. terrestris friction and facilitates movement. This characteristic is
have negative electric charges; in water or on moist related to earthworm plasticity, meaning they can respond
surfaces, they orient toward the cathode pole of a direct strongly to environmental changes by absorbing moisture
electric current (Shensa and Barrows, 1932). The from soil (Yan et al., 2007).
movement patterns of earthworms are highly dependent Previous studies indicate that some animals, such
on electro-osmotically–driven flow, which takes place as bees, are sensitive to weak (approximately 50 nT) but
when an earthworm is in moist soil (Sun et al., 1991). detectible magnetism (Kirschvink, 1982). In this study,
Taking this background into consideration, the negatively the earthworms responded to 190–520 µT MF intensity,
charged action potential of an earthworm’s stimulated which might be higher than their minimum detectible MF,
body, due to the microscopic electro-osmotic system (Yan assumed to be 50 nT. However, these 190–520 µT values are
et al., 2007), may lead to a shift in the orientation of the within the limit of MF values produced by underground
earthworms. Since earthworms exhibit strong behavioral cables, and our experimental design indicates that
responses to electrical fields, the magnetic orientation manmade MF affects the orientation of earthworms.
is expected. However, the intensity and direction of the Earthworms have an important role in soil ecology
magnetic field might play an important role in shifting such as incorporating organic matter into the soil, and
the horizontal orientation patterns of earthworms. On the man-made MF is increasing with the rise of technology.
other hand, starvation (Vidal-Gadea et al., 2015) and other Underground cables in particular pose a potential threat
biological conditions might be important factors for the of disorienting earthworms. A 10° deviation compared
shift in orientation patterns of earthworms exposed to MF. to control groups is extremely significant and may
The bioelectrical composition, surface potential lead to undesirable conditions for earthworms in their
(maximum 40 mV), and movement mechanisms related to environments. This deviation is also evidence that artificial
the electrical potential of earthworms have all been studied MF is an important environmental parameter that yields
(Ma, 1984; Sun et al., 1991; Zu and Yan, 2006). In addition, unpredictable consequences in organisms’ behaviors.
it is important to examine the electric charge balance of The earthworms may also have physiological responses
the soil for earthworms’ movement patterns because they to artificial MF in soil, which may affect their functional
are anecic animals that create permanent vertical burrows roles in the ecosystem. Therefore, more research is
of up to 3 m depth (Palm et al., 2013). In other words, they recommended in order to understand the full impact of
must ascribe to certain movement patterns to perform manmade MF on soil ecosystems.
their functional roles. However, the results of this study
indicate that the magnetic field coming from under-soil Acknowledgements
cables may affect the distribution patterns of earthworms. This research was implemented in Çanakkale Onsekiz
Any change in feeding and burrowing activities will also Mart University Laboratories; it did not receive grants from
directly or indirectly affect the soil ecosystem. funding agencies in the public, commercial, or not-for-
The bodies of the earthworms in the experimental profit sectors. We thank Dr. Hüseyin Çavuş and Dr. Çağlar
group were moister, and their clitella were inflected more Püsküllü for helping design the magnetic experiments.
References
Aladjadjiyan A, Ylieva T (2003). Influence of stationary magnetic Bennett MF, Huguenin J (1969). Geomagnetic effects on a circadian
field on the early stages of the development of tobacco difference in reaction times in earthworms. Zeitschrift Für
seeds (Nicotiana tabacum L.). Journal of Central European Vergleichende Physiologie 63(4): 440-445. doi: 10.1007/
Agriculture 4: 131-138. BF00339683
Banks AN, Srygley RB (2003). Orientation by magnetic Bochert R, Zettler ML (2006). Effect of electromagnetic fields on
field in leaf-cutter ants, Atta colombica (Hymenoptera: marine organisms geomagnetic field detection in marine
Formicidae). Ethology 109(10): 835-846. doi: 10.1046/j.0179- organisms. In: Köller J, Köppel J, Peters W (editors.). Offshore
1613.2003.00927.x Wind Energy: Research on Environmental Impacts. New York:
Springer, pp. 223-234. doi: 10.1007/978-3-540-34677-7_14
Bastardie F, Capowiez Y, De Dreuzy JR, Cluzeau D (2003). X-ray
tomographic and hydraulic characterization of burrowing by Budán F, Kovács N, Engelmann P, Horváth I, Veres DS et al. (2014).
three earthworm species in repacked soil cores. Applied Soil Longitudinal in vivo MR imaging of live earthworms. Journal
Ecology 24(1): 3-16. doi: 10.1016/S0929-1393(03)00071-4 of Experimental Zoology Part A: Ecological Genetics and
Physiology 321(9): 479-489. doi: 10.1002/jez.1880
206YALÇIN et al. / Turk J Zool
Cannavacciuolo M, Bellido A, Cluzeau D, Gascuel C, Trehen P Martin S, Lavelle P (1992). A simulation model of vertical movements
(1998). A geostatistical approach to the study of earthworm of an earthworm population (Millsonia anomala Omodeo,
distribution in grassland. Applied Soil Ecology 9(1-3): 345- Megascolecidae) in an African savanna (Lamto, Ivory Coast).
349. doi: 10.1016/S0929-1393(98)00087-0 Soil Biology and Biochemistry 24(12): 1419-1424. doi:
Decaëns T, Rossi JP (2008). Spatio-temporal structure of earthworm 10.1016/0038-0717(92)90127-J
community and soil heterogeneity in a tropical pasture. Odacı E, Özyilmaz C (2015). Exposure to a 900 MHz
Ecography 24(6): 671-682. doi: 10.1111/j.1600-0587.2001. electromagnetic field for 1 hour a day over 30 days does
tb00529.x change the histopathology and biochemistry of the rat testis.
Ernst G, Felten D, Vohland M, Emmerling C (2009). Impact International Journal of Radiation Biology 91(7): 547-554. doi:
of ecologically different earthworm species on soil water 10.3109/09553002.2015.1031850
characteristics. European Journal of Soil Biology 45(3): 207- Palm J, van Schaik, NLMB, Schröder B (2013). Modelling distribution
213. doi: 10.1016/j.ejsobi.2009.01.001 patterns of anecic, epigeic and endogeic earthworms at
Giller KE, Beare MH, LavelleP, Izac AMN, Swift MJ (1997). catchment-scale in agro-ecosystems. Pedobiologia 56(1): 23-
Agricultural intensification, soil biodiversity and 31. doi: 10.1016/j.pedobi.2012.08.007
agroecosystem function. Applied Soil Ecology 6: 3-16. Quillin K (1999). Kinematic scaling of locomotion by hydrostatic
Kirschvink JL (1982). Birds, bees and magnetism. Trends in animals: ontogeny of peristaltic crawling by the earthworm
Neurosciences 5: 160-167. doi: 10.1016/0166-2236(82)90090- Lumbricus terrestris. The Journal of Experimental Biology
X 202(6): 661-674.
Kirschvink JL, Kirschvink AK (1991). Is geomagnetic sensitivity real ? Quinn T, Groot C (1983). Orientation of chum salmon (Oncorhynchus
Replication of the Walker–Bitterman magnetic conditioning keta) after internal and external magnetic field alteration.
experiment in honey bees. American Zoologist 31(1): 169-185. Canadian Journal of Fisheries and Aquatic Sciences 40(10):
1598-1606. doi: 10.1139/f83-185
Lavelle P (1988). Earthworm activities and the soil system. Biology
and Fertility of Soils 6(3): 237-251. doi: 10.1007/BF00260820 Shensa L, Barrows W (1932). The subepidermal nerve plexus and
galvanotropism of the earthworm (Lumbricus terrestris Linn.).
Lavelle P, Martin A (1992). Small-scale and large-scale effects of The Ohio Journal of Science 32(6): 507-512.
endogeneic earthworms on soil organic matter dynamics in
soil and the humid tropics. Soil Biology and Biochemistry Shipitalo MJ, Protz R, Tomlin AD (1988). Effect of diet on the feeding
24(12): 1491-1498. and casting activity of Lumbricus terrestris and Lumbricus
rubellus in laboratory culture. Soil Biology and Biochemistry
Lee YJ, Hyung K, Yoo JS, Jang Y, Kim S et al. (2016). Effects of 20(2): 233-237. doi: 10.1016/0038-0717(88)90042-9
exposure to extremely low-frequency electromagnetic fields
on the differentiation of Th17 T cells and regulatory T cells. Simko M, Kriehuber R, Weiss DG, Luben RA (1998). Effects of 50
General Physiology and Biophysics 35: 487-495. doi: 10.4149/ Hz EMF exposure on micronucleus formation and apoptosis
gpb in transformed and nontransformed human cell lines.
Bioelectromagnetics 19(2): 85-91. doi: 10.1002/(SICI)1521-
Levins R (1968). Evolution in Changing Environments: Some 186X(1998)19
Theoretical Explorations. Princeton, NJ, USA: Princeton
University Press. Skauli K, Reitan J, Walther B (2000). Hatching in zebrafish
(Danio rerio) embryos exposed to a 50 Hz magnetic field.
Lohmann KJ (1985). Geomagnetic field detection by the western Bioelectromagnetics 21(5): 407-410.
Atlantic spiny lobster, Panulirus argus. Marine Behaviour and
Physiology 12: 1-17. Sun J, Sun B, Wei J, Ren R, Wu L, Cong Q (1991). Measurement and
determination of earthworm skin potential related to moving.
Lohmann KJ (1991). Magnetic orientation by hatchling loggerhead Journal of Jilin University of Technology 21(4): 18-22.
sea turtles (Caretta caretta). The Journal of Experimental
Biology 155: 37-49. Sun LY, Hsieh DK, Yu TC, Chiu HT, Lu SF et al. (2009). Effect
of pulsed electromagnetic field on the proliferation and
Lohmann KJ (1993). Magnetic compass orientation. Nature 362: 703. differentiation potential of human bone marrow mesenchymal
doi: 10.1038/362703a0 stem cells. Bioelectromagnetics 30(4): 251-260. doi: 10.1002/
Love MS, Nishimoto MM, Clark S, Bull AS (2015). Identical response bem.20472.
of caged rock crabs (genera Metacarcinus and Cancer) to Valckx J, Pennings A, Leroy T, Berckmans D, Govers G et al. (2010).
energized and unenergized undersea power cables in southern Automated observation and analysis of earthworm surface
California, USA. Bulletin of the Southern California Academy behaviour under experimental habitat quality and availability
of Sciences 114(1): 33-41. doi: 10.3160/0038-3872-114.1.33 conditions. Pedobiologia 53(4): 259-263. doi: 10.1016/j.
Ma J (1984). Creatures and Bionics. Tianjin: Science and Technology pedobi.2009.12.005
Press. Vian A, Davies E, Gendraud M, Bonnet P (2016). Plant responses
Mardia K, Jupp P (2000). Directional Statistics. London: John Wiley to high frequency electromagnetic fields. BioMed Research
& Sons Ltd. International 2016: 1-13. doi: 10.1155/2016/1830262
207YALÇIN et al. / Turk J Zool
Vidal-Gadea A, Ward K, Beron C, Ghorashian N, Gokce S et al. Wiltschko W, Wiltschko R (1996). Magnetic orientation in birds. The
(2015). Magnetosensitive neurons mediate geomagnetic Journal of Experimental Biology 199(1): 29-38. doi: 10.1098/
orientation in Caenorhabditis elegans. Elife 4. E07493. doi: rspb.2003.2476
10.7554/eLife.07493
Yan Y, Ren L, Li J (2007). The electro-osmotically driven flow near
Weiler M, Naef F (2003). An experimental tracer study of the role an earthworm’s body surface and the inspired bionic design
of macropores in infiltration in grassland soils. Hydrological in engineering. International Journal of Design & Nature and
Processes 17(2): 477-493. doi: 10.1002/hyp.1136 Ecodynamics 1(2): 135-145. doi: 10.2495/D
Wetzel A, Uchman A, Bromley RG (2016). Underground miners Zar JH (1976). Two-sample and multisample testing of circular data.
come out to the surface – trails of earthworms. Ichnos: An Behavior Research Methods & Instrumentation 8(3): 329-330.
International Journal of Plant and Animal 23(1-2): 99-107. doi: doi: 10.3758/bf03201734
10.1080/10420940.2015.1130707
Zu YQ, Yan YY (2006). Numerical simulation of electroosmotic flow
Whalen J, Costa C (2003). Linking spatio-temporal dynamics of near earthworm surface. Journal of Bionic Engineering 3(4):
earthworm populations to nutrient cycling in temperate 179-186. doi: 10.1016/S1672-6529(07)60001-8
agricultural and forest ecosystems. Pedobiologia 47(5-6): 801-
806. doi: 10.1016/S0031-4056(04)70271-1
208You can also read