Evaluation of probability distributions in the analysis of minimum temperature series in Manaus - AM
←
→
Page content transcription
If your browser does not render page correctly, please read the page content below
Research, Society and Development, v. 10, n. 3, e46210313616, 2021
             (CC BY 4.0) | ISSN 2525-3409 | DOI: http://dx.doi.org/10.33448/rsd-v10i3.13616

Evaluation of probability distributions in the analysis of minimum temperature
series in Manaus – AM
Avaliação de distribuições de probabilidade na análise de séries de temperatura mínima em
Manaus – AM
Evaluación de distribuciones de probabilidad en el análisis de series de temperaturas mínimas en
Manaus - AM

                                                     Recebido: 06/03/2021 | Revisado: 12/03/2021 | Aceito: 14/03/2021 | Publicado: 22/03/2021

                                                                                                                Yana Miranda Borges
                                                                                                ORCID: https://orcid.org/0000-0002-1866-5524
                                                                   Federal Institute of Education, Science and Technology of Amazonas, Brazil
                                                                                                               E-mail: borges.yana@gmail.com
                                                                                                               Breno Gabriel da Silva
                                                                                              ORCID: https://orcid.org/0000-0002-8322-9235
                                                                                                              University of São Paulo, Brazil
                                                                                                                 E-mail: brenogsilva@usp.br
                                                                                                     Brian Alvarez Ribeiro de Melo
                                                                                              ORCID: https://orcid.org/0000-0002-8217-114X
                                                                                                         State University of Maringá, Brazil
                                                                                                             E-mail: brian.rmelo@gmail.com
                                                                                                          Robério Rebouças da Silva
                                                                                              ORCID: https://orcid.org/0000-0002-6458-6448
                                                                                                  Getúlio Vargas University Hospital, Brazil
                                                                                                               E-mail: roberiors@gmail.com

      Abstract
      The relevance in studying climatological phenomena is based on the influence that variables of this nature exert on the
      world. Among the most observed variables, temperature stands out, whose effect of its variation may cause significant
      impacts, such as the proliferation of biological species, agricultural production, population health, etc. Probability
      distributions have been studied to verify the best fit to describe and/or predict the behavior of climate variables and, in
      this context, the present study evaluated, among six probability distributions, the best fit to describe a historical
      temperature series. minimum monthly mean. The series used in this study encompass a period of 38 years (1980 to
      2018) separated by month from the weather station of the Manaus - AM station (OMM: 82331) obtained from
      INMET, totaling 459 observations. Difference-Sign and Turning Point tests were used to verify data independence and
      the maximum likelihood method to estimate the parameters. Kolmogorov-Smirnov, Anderson-Darling, Cramér-von
      Mises, Akaike Information Criterion and quantile-quantile plots were used to select the best fit distribution. Log-
      Normal, Gama, Weibull, Gumbel type II, Benini and Rice distributions were evaluated, with the best performing Rice,
      Log-Normal and Gumbel II distributions being highlighted.
      Keywords: Distribution adjustment; Temperature data; Rice distribution; Log-Normal distribution; Gumbel II
      distribution.

      Resumo
      A relevância em estudar fenômenos climatológicos baseia-se na influência que variáveis dessa natureza exercem no
      mundo. Entre as variáveis mais observadas, destaca-se a temperatura, cujo efeito de sua variação pode vir a causar
      impactos significativos, como na proliferação de espécies biológicas, produção agrícola, saúde da população, etc.
      Distribuições de probabilidade vêm sendo estudadas para verificar o melhor ajuste para descrever e/ou prever o
      comportamento de variáveis climáticas e, sob esse contexto, o presente estudo avaliou, dentre seis distribuições de
      probabilidade, a de melhor ajuste para descrever uma série histórica de temperatura mínima média mensal. As séries
      utilizadas neste estudo englobam um período de 38 anos (1980 a 2018) separados por mês, da estação meteorológica
      da estação Manaus - AM (OMM: 82331) obtidas no INMET, totalizando 459 observações. Foram utilizados os testes
      Difference-Sign e Turning Point para verificar independência dos dados e o método da máxima verossimilhança para
      estimar os parâmetros. Para selecionar a distribuição de melhor ajuste foram utilizados os testes de Kolmogorov-
      Smirnov, Anderson-Darling, Cramér-von Mises, Critério de Informação de Akaike e gráficos quantil-quantil. Foram
      avaliadas as distribuições Log-Normal, Gama, Weibull, Gumbel tipo II, Benini e Rice, destacando-se as distribuições
      Rice, Log-Normal e Gumbel II como as de melhor desempenho.
                                                               1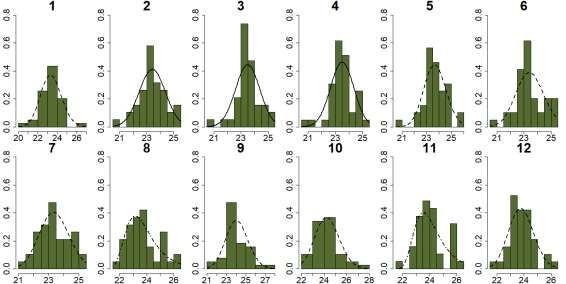
Research, Society and Development, v. 10, n. 3, e46210313616, 2021
                (CC BY 4.0) | ISSN 2525-3409 | DOI: http://dx.doi.org/10.33448/rsd-v10i3.13616

         Palavras-chave: Ajuste de distribuições; Dados de temperatura; Distribuição rice; Distribuição Log-Normal;
         Distribuição Gumbel II.

         Resumen
         La relevancia del estudio de los fenómenos climatológicos se basa en la influencia que tienen en el mundo variables
         de esta naturaleza. Entre las variables más observadas destaca la temperatura, cuyo efecto de su variación puede
         ocasionar impactos significativos, como en la proliferación de especies biológicas, producción agrícola, salud de la
         población, etc. Se han estudiado las distribuciones de probabilidad para verificar el mejor ajuste para describir y/o
         predecir el comportamiento de las variables climáticas y, en este contexto, el presente estudio evaluó, entre seis
         distribuciones de probabilidad, el mejor ajuste para describir un promedio mensual mínimo de una serie histórica de
         temperaturas. La serie utilizada en este estudio cubre un período de 38 años (1980 a 2018) separados por meses, de la
         estación meteorológica de la estación Manaus - AM (OMM: 82331) obtenida del INMET, totalizando 459
         observaciones. Se utilizaron pruebas de signo de diferencia y punto de inflexión para verificar la independencia de los
         datos y el método de máxima verosimilitud para estimar los parámetros. Para seleccionar la distribución de mejor
         ajuste, se utilizaron los gráficos de Kolmogorov-Smirnov, Anderson-Darling, Cramér-von Mises, Akaike Information
         Criterion y cuantiles-cuantiles. Se evaluaron las distribuciones Log-Normal, Gama, Weibull, Gumbel tipo II, Benini y
         Rice, destacándose las distribuciones Rice, Log-Normal y Gumbel II como las de mejor desempeño.
         Palabras clave: Ajuste de distribuciones; Datos de temperatura; Distribución rice; Distribución Log-Normal;
         Distribución de Gumbel II.

1. Introduction
         The relevance of studying climatological phenomena is based on the influence that variables of this nature have in
different areas of knowledge or even in everyday life. Among the most observed variables, the temperature stands out, whose
effect of its variation can cause significant impacts, such as in the proliferation of animal and vegetable species, agricultural
production, population health, etc. From this perspective, analyzes of historical series of climatic variables have been carried
out in order to describe and/or predict the behavior of these variables, as studies by (Astolpho (2003); Berlato & Althaus
(2010); Araújo et al. (2010); Assis et al. (2013); Gomes et al. (2015); Silva et al. (2013); Assis et al. (2018); Ximenes et al.
(2020); de Mendoza Borges et al. (2020); Aguirre et al. (2020) and Santiago et al. (2020)) whose objective was to verify the
best fit to describe climatological measures in cities in Brazil.
         According to Fisch (1998), the region that presents the greatest vulnerability to climatic changes in Brazil is the
Amazon and the Northeast, where they constitute what could be called climatic change hot spots, being associated with a high
probability of higher average temperature increase (around five degrees centigrade, until the end of the century) than predicted
for the rest of the Brazilian territory. According to Gomes (2015), the reasons for Manaus being more vulnerable to climate
change in Brazil are due to global climate variations from natural causes, as well as changes in land use, for example, within
the Amazon region itself. , that is, for anthropic cause.
According to Fisch (1998), the city of Manaus is located in the heart of the Amazon, classified as one of the most humid
regions in the whole country. The city's climate is humid tropical, contained by high temperatures, high humidity and torrential
rain. The author mentioned above also mentions that researchers have been elaborating models, through the processing of
supercomputers of series of information of all kinds, linked to climatic situations, to try to predict future trends of climate
change, in different scenarios.
         Alexander et al. (2006) carried out a research, considering more than 1,400 meteorological stations and verified the
occurrence in the increase of the minimum temperatures in 70.0% of the analyzed continental regions, including South
America. It highlights Guarienti et al. (2004) that one of the justifications of studying the behavior of minimum temperature is
the fact that the production of wheat in the country is strongly linked to this climatic variable.
         Araújo et al. (2010) point out that verifying the probability distribution of variables associated with meteorological
phenomena has the potential to assist in the execution of planning associated with agricultural activities, forecasting the

                                                                    2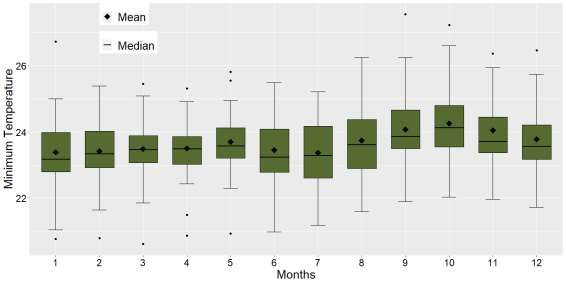
Research, Society and Development, v. 10, n. 3, e46210313616, 2021
                  (CC BY 4.0) | ISSN 2525-3409 | DOI: http://dx.doi.org/10.33448/rsd-v10i3.13616

climatic behavior of a given region of the country, among others. Catalunya et al. (2002) highlights that the temperature of a
region can be estimated in probabilistic terms, through the use of probability distributions adjusted to historical data series.
         Also according to Catalunha et al. (2002), the probability density functions are associated with the behavior of the
data, in which these functions are characterized by having the ability to adjust for small or large databases, in addition to
having specificities regarding the number of parameters, behavior such as: asymmetry, shape of bathtub and among others.
Still in the same context, the present study aims to evaluate, among six probability distributions, which offers the best fit to the
historical series of minimum monthly average temperature in the city of Manaus, in Amazonas.

2. Material and Methods
         The city of Manaus, in Amazonas, located in the Northern Region of Brazil, latitude 03 o06’07’’ and longitude
60o01’30’’ with a tropical climate, has an area of 11.401.092 km2, with an estimated population of 2.145.444 inhabitants and
density of 188.18 hab./km2 (IBGE, 2018), . The climate of Manaus is considered to be a tropical humid
monsoon (type Am according to the Koppen-Geiger climate classification), with an annual average compensated temperature
of 27ºC and relatively high air humidity, with a rainfall index of around 2.300 millimeters per year. The seasons are relatively
well defined when it comes to rain: winter is relatively dry, and summer is rainy. Due to the proximity of the Equator, the heat
is constant from the local climate. There are no cold days in winter, and very intense polar air masses in the south-central part
of the country and the southwest of the Amazon rarely have any effect on the city. According to data from the National
Institute of Meteorology (INMET), , since 1961 the lowest temperature recorded in Manaus was
12.1ºC on July 9, 1989, and the highest reached 39ºC on September 21, 2015.
         This quantitative research is characterized by the use of quantification, both in the collection as in the treatment of
information, using statistical techniques (Richardson (1999); Pereira et al. (2018)). The monthly series of average minimum
temperature used in this study covers a period of 38 years (1980 to 2018) separated by month, from the weather station of the
Manaus - AM station (OMM: 82331), compiled from the historical series of average minimum temperature obtained in
INMET. To verify data independence, Difference-Sign and Turning Point Test were applied. Parameter estimates were
obtained using the maximum likelihood method. The Kolmogorov-Smirnov (KS), Anderson-Darling (AD) and Cramér-von
Mises (CVM) tests were used as a criterion to verify the model that best fit the data, as well as the Akaike Information
Criterion (AIC). Quantile-quantile plots were also used as a criterion of adequacy and distribution selection with the best fit.
The distributions evaluated are all implemented in software R version 4.0.2 (R Core Team, 2020), namely: Log-Normal,
Gama, Weibull, Gumbel type II, Benini and Rice. The R libraries used were: iki.dataclim (Orlowsky, 2014), for homogeneity
tests; randtests (Mateus & Caeiro, 2014), for randomness tests; fitdistrplus (Dellignette-Muller & Dutang, 2015), for
adjustments; stats (R Core Team, 2020), and goftest (Faraway et al., 2017) for fit quality; car (Fox & Weisberg, 2019) for
quantile-quantile charts.

2.1 Tests of independence
         Many statistical procedures require a random sample (Brockwell & Davis, 2016), such as those performed in this
work. Such a condition is not always valid and can be tested using a statistical hypothesis test. Therefore, we must test the
hypothesis that                  is a sequence of independent and identically distributed random variables (i.i.d.) or not.

                                                                 3
Research, Society and Development, v. 10, n. 3, e46210313616, 2021
(CC BY 4.0) | ISSN 2525-3409 | DOI: http://dx.doi.org/10.33448/rsd-v10i3.13616
2.2 Difference-Sign Test
This test counts number of points Where the sequence increase, i.e. where
or equivalently the number of times the differenced sequence, is positive. Thus, we can define the
statistic as,
For a sequence of i.i.d. random variables, we know that and . A large positive
(or negative) value of indicates the presence of an increasing (or decreasing) trend in the data.
2.3 Turning Point Test
The main idea of this test is the sequence is random, three successive values,
are equally likely to occur in any of the six possible orders with equal probability. In Only four of
these would there be a turning point, namely When the greatest or the least of the three points is in the Middle, i.e.,
is a turning point if and or if and . The probability
of having a turning point in any set of these values is then 2/3 (Mateus & Caeiro, 2013). Let the statistic representes the
number of turning points of the sequence ,
For a sequence of i.i.d. random variables, the mean value and variance of are and
, respectively. A large value of indicates that the sequence is fluctuating more rapidly
than expected for i.i.d. variables. On other hand a value Much smaller than zero indicates a positive correlation
between neighbouring observations.
2.4 The distributions
2.4.1 Log-Normal distribution
Let X be a normally distributed random variable, so has a Normal distribution. Likewise, if Y has a
Normal distribution, then the exponential function of Y, , has a Log-Normal distribution with f.d.p
,
with mean and variance and (Johnson et al., 1995).
Its cumulative distribution function is
4Research, Society and Development, v. 10, n. 3, e46210313616, 2021
(CC BY 4.0) | ISSN 2525-3409 | DOI: http://dx.doi.org/10.33448/rsd-v10i3.13616
.
2.4.2 Gama distribution
The Gama distribution (Shea, 1988) with parameters shape = and scale = has density
where and .
with mean and variance
and ,
and cumulative distribution function given by
.
2.4.3 Weibull distribution
The distribution Weibull (Weibull et al., 1951), with parameters of shape and scale , has density give by
,
with mean and variance of a Weibull distribution
and ,
cumulative distribution function given by
, for , and for .
2.4.4 Gumbel II distribution
The density distribution Gumbel-II (Gumbel, 1954) for a response is
,
for . The cumulative distribution function is
.
The mean and variance of given by
when e
5Research, Society and Development, v. 10, n. 3, e46210313616, 2021
(CC BY 4.0) | ISSN 2525-3409 | DOI: http://dx.doi.org/10.33448/rsd-v10i3.13616
when .
2.4.5 Benini distribution
The Benini distribution (Benini, 1905) has a probability density function that can be written as
for , and shape parameter .
The cumulative distribution function for is
.
2.4.6 Rice distribution
The Rice distribution (Rice, 1945) has a density function
,
where and is the modified Bessel function of the first zero order type. The hope and variance of are
given by
, where and
.
The cumulative distribution function given by
,
where is function of Marcum given by
.
2.5 The goodness of fit test
The Akaike information criterion (AIC) provides a means for selecting models and, in this case, as a criterion for
selecting the model with the best fit for the data studied here. The Kolmogorov-Smirnov, Anderson-Darling and Cramér-von
Mises tests are often used as adherence tests, but they are also resources to measure the quality of the fit of a distribution to the
analyzed data, considering that the higher the p-value (greater adherence), better fit the data to the evaluated model. Similarly,
quantile-quantile plots are commonly used to compare a data set against a theoretical model. This can provide an assessment of
the “good fit” that is graphical, rather than reducing to a numerical summary.
6Research, Society and Development, v. 10, n. 3, e46210313616, 2021
(CC BY 4.0) | ISSN 2525-3409 | DOI: http://dx.doi.org/10.33448/rsd-v10i3.13616
2.5.1 Akaike Information Criterion
The Akaike information criterion was developed by Akaike (1974) from the Kullback-Leibler distance to test whether
a given model is adequate. Let k be the number of parameters estimated in the model and the maximum value of the
likelihood function for the model. So the AIC value of the model is
.
Among the models evaluated, the model that points to the lowest AIC value is considered to be the best fit.
2.5.2 Kolmogorov-Smirnov test
The Kolmogorov – Smirnov test (Durbin, 1973) is a non-parametric test on the equality of continuous and one-
dimensional probability distributions that can be used to compare a sample with a reference probability distribution (one-
sample K – S test). The Kolmogorov – Smirnov statistic quantifies the distance between the empirical distribution function of
the sample and the cumulative distribution function of the reference distribution. The empirical distribution function for
observations independent and identically distributed is defined as
,
where is the indicator function, equal to 1 if and equal to 0, otherwise. As for the set of distances, we
have to it is the supreme of the set of distances. By the Glivenko-Cantelli theorem, if the sample comes from the
distribution , so , converge to 0 almost certainly on the edge when tends to infinity.
.
2.5.3 Anderson-Darling test
The Anderson-Darling test (Anderson & Darling, 1952) assesses whether a sample comes from a specified
distribution. It makes use of the fact that, when given a hypothetical underlying distribution and assuming that the data arise
from that distribution, the cumulative distribution function of the data can be assumed to follow a uniform distribution. The
data can be tested for uniformity with a distance test. The formula for test statistic A to assess whether data
(note that the data must be put in order) comes from an accumulated distribution function is
where
.
The test statistic can then be compared with the critical values of the theoretical distribution. In this case, no
parameters are estimated in relation to the cumulative F distribution function.
7Research, Society and Development, v. 10, n. 3, e46210313616, 2021
(CC BY 4.0) | ISSN 2525-3409 | DOI: http://dx.doi.org/10.33448/rsd-v10i3.13616
2.5.4 Cramér-von Mises test
The Cramér-von Mises criterion is a criterion used to judge the fit quality of an accumulated distribution function
compared to a given empirical distribution function (Braun (1980); CSöRgő & Faraway (1996)). Let
observed values, in ascending order. So the statistic is
If this value is greater than the tabulated value, then the hypothesis that the data came from the F distribution in
question can be rejected.
2.5.5 Quantile-Quantile plot
A probability plot or a quantile-quantile plot (Q-Q) is a graphical presentation designed by Wilk & Gnanadesikan
(1968) to compare a set of data to a particular probability distribution or to compare it with another set of data. When
comparing observations to a hypothetical distribution, take a random sample of some unknown
distribution with cumulative distribution function and be the ordered observations. Depending on
the particular formula used for the empirical distribution function, the i-th order statistic is an estimate of the ,
,..., quantile. Suppose that the order statistic is an estimate of the quantile, i.e
,
so
.
If we knew the shape of the true F distribution function, then the plot of versus would form approximately
a straight line based on . A probability plot is a plot of versus , where denotes the
cumulative distribution function associated with the hypothetical distribution. The probability graph should fall approximately
on the line if . If and differ only by a change in location and scale, if , then
the plot should fall more or less on the line .
The amount in it is called the plot position for the probability plot. This
particular formula for the plotting position is attractive because it can be shown that for any continuous distribution
(Nelson (1982); Stedinger et al. (1993)). That is, the i-th plot position defined as
, is the expected value of the real distribution function evaluated in the order statistic (Atkinson (1985);
Fox (2016)).
8Research, Society and Development, v. 10, n. 3, e46210313616, 2021
(CC BY 4.0) | ISSN 2525-3409 | DOI: http://dx.doi.org/10.33448/rsd-v10i3.13616
3. Results and Discussion
The randomness tests applied to the data under a 95% confidence level showed that only the Difference-Sign test
rejected the hypothesis of randomness of the data in the months of February and December (p-value < 0.05). The Turning
Point Test did not reject randomness at any time (p-value > 0.05), also at a 95% significance level. The summary measures for
the monthly average minimum temperature data are presented in Table 1. The series boxplots can be seen in Figure 1.
Table 1. Randomness tests.
Months Difference-Sign Turning Point Test
1-January 0.584 0.897
2-FebruaryResearch, Society and Development, v. 10, n. 3, e46210313616, 2021
(CC BY 4.0) | ISSN 2525-3409 | DOI: http://dx.doi.org/10.33448/rsd-v10i3.13616
observed years, except for those already mentioned, indicated a temperature very different from the others recorded. The
descriptive measures of the data set can be seen in Table 2.
Table 2. Descriptive measurements of the monthly historical series of minimum temperature from
01/01/1980 to 06/01/2019 of the Manaus meteorological station.
Months n Mean Standard deviation Median Minimum Maximum
1-January 39 23.386 1.097 23.174 20.768 26.723
2-February 38 23.412 0.982 23.387 20.796 25.383
3-March 38 23.494 0.907 23.469 20.613 25.448
4-April 39 23.500 0.872 23.487 20.867 25.303
5-May 39 23.696 0.906 23.574 20.935 25.810
6-June 39 23.452 1.044 23.237 20.983 25.483
7-July 38 23.386 1.001 23.342 21.174 25.203
8-August 38 23.762 1.157 23.634 21.590 26.252
9-September 38 24.098 1.183 23.870 21.887 27.543
10-October 38 24.285 1.111 24.173 22.026 27.219
11-November 37 24.091 1.072 23.873 21.970 26.363
12-December 38 23.797 0.943 23.569 21.723 26.458
Source: Authors.
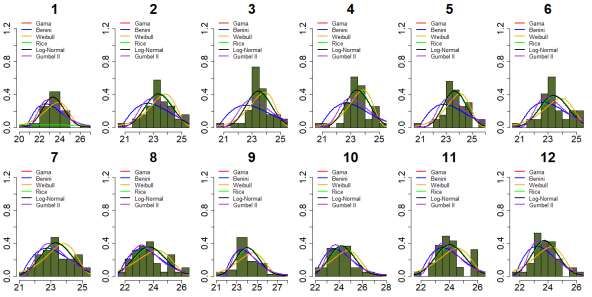
Assuming that all distributions could adequately describe the monthly minimum temperature data, the parameters for each one
were estimated. The graphs of estimated curves of the distributions on monthly histograms can be seen in Figure 2.
Figure 2. Adjusted curves on histogram for the monthly historical series of average minimum temperature in Manaus
meteorological station.
Source: Authors.
From the graphical point of view, it can be seen that the Rice distribution has the worst performance to describe the
data for the month of March, with extremely different estimates for the parameters and , when compared
to the estimates to describe the other months ( ) and ( ), whose curve cannot be
10Research, Society and Development, v. 10, n. 3, e46210313616, 2021
(CC BY 4.0) | ISSN 2525-3409 | DOI: http://dx.doi.org/10.33448/rsd-v10i3.13616
observed due to different limits for the x and y axes (x ranges from approximately 0 to 60 and y, from 0 to 0.04). The estimated
curves generated by the Benini, Rice and Gumbell II distributions for the other months, as expected, approach the histogram
only on occasions when the data have positive asymmetry. Except in January, the curves for the Gamma, Log-Normal and
Rice distributions appear superimposed, pointing to similar adjustments.
Considering the adherence of the distributions to the data, assessed by the Kolmogorov-Smirnov, Anderson-Darling
and Cramér-von Mises tests, the three tests agree that the Gamma, Log-Normal, Gumbell II, Weibull and Rice distributions fit
the data, except in the cases of January and June. The hypothesis that the data come from a Rice distribution is rejected by the
three tests at the level of 5% significance (p-valueResearch, Society and Development, v. 10, n. 3, e46210313616, 2021
(CC BY 4.0) | ISSN 2525-3409 | DOI: http://dx.doi.org/10.33448/rsd-v10i3.13616
Table 5. P-value of the Cramér-von Mises test for the probability distributions evaluated.
Months Gama Benini Log-Normal Gumbel II Weibull Rice
1-January 0.664 0.045 0.675 0.261 0.211Research, Society and Development, v. 10, n. 3, e46210313616, 2021
(CC BY 4.0) | ISSN 2525-3409 | DOI: http://dx.doi.org/10.33448/rsd-v10i3.13616
Figure 3. Quantile-quantile graphs for the quality of the adjustment for the months of May and June.
Source: Authors.
Table 7 contains the distributions selected as the best fit for the monthly minimum daily temperature data for the
Manaus meteorological station according to the adopted criteria.
Table 7. Best-fit distributions for monthly average minimum temperature data.
Months Jan* Feb Mar Apr May Jun Jul Aug Sep Oct Nov Dec
Dist. LN RC RC RC LN LN LN GB LN LN GB LN
*Note: LN, dist. Log-Normal; RC, dist Rice; GB, dist. Gumbel II. Source: Authors.
Finally, the selected curves, according to the criteria presented for the evaluated distributions, according to the months
to which they fit can be seen in Figure 4.
13Research, Society and Development, v. 10, n. 3, e46210313616, 2021
(CC BY 4.0) | ISSN 2525-3409 | DOI: http://dx.doi.org/10.33448/rsd-v10i3.13616
Figure 4. Curves adjusted on histogram for the monthly historical series of minimum temperature of the average
meteorological station in Manaus.
Source: Authors.
4. Conclusion
The Rice, Log-Normal and Gumbel type II distributions were the distributions selected as the best fit to describe the
series of average minimum temperature of the Manaus station. It is emphasized here, as observed graphically and by the
Kolmogorov-Smirnov, Anderson-Darling and Cramér-von Mises tests, that, in cases where the Log-Normal distribution
emerges as the distribution with the most appropriate adjustment, the Gamma and Rice distributions could also be adopted with
little difference between them (except in January), thus being recommended in the description of the behavior for mean
minimum temperature data as potential competitors to those usually used. It is also important to highlight that, for studies of
average minimum temperature data from other stations and/or another time interval, although the data sets are of the same
nature, the behavior varies, also varying the distribution that can describe them, then it is up to the comparison of tests and
distributions for a more adequate result. Therefore, future research can be carried out using other climatic variables, as well as
in other states of Brazil, in order to investigate possible probabilistic models that describe such recurrences associated with
climatic variables.
Acknowledgments
We are grateful to the National Institute of Meteorology (INMET) for providing the data used here and to CNPQ, for
the financial support granting a scholarship to the second author.
References
Aguirre, A. F. L., Nogueira, D. A., & Beijo, L. A. (2020). Análise da temperatura máxima de Piracicaba (SP) via distribuição GEV não
estacionária: uma abordagem bayesiana. Revista Brasileira de Climatologia, 27.
Alexander, L. V., Zhang, X., Peterson, T. C., Caesar, J., Gleason, B., Klein Tank, A. M. G., & Vazquez‐Aguirre, J. L. (2006). Global observed
changes in daily climate extremes of temperature and precipitation. Journal of Geophysical Research: Atmospheres, 111(D5).
Akaike, H. (1974). Anew look at the statistical model identi cation. IEEE Transactions on Automatic Control, 19(6):716 723.
14Research, Society and Development, v. 10, n. 3, e46210313616, 2021
(CC BY 4.0) | ISSN 2525-3409 | DOI: http://dx.doi.org/10.33448/rsd-v10i3.13616
Anderson, T. W., & Darling, D. A. (1952). Asymptotic theory of certain" goodness of fit" criteria based on stochastic processes. The annals of mathematical
statistics, 193-212.
Araújo, E. M., Silva, I. N., de Oliveira, J. B., Junior, E. G. C. & de Almeida, B. M. (2010). Aplicação de seis distribuições de probabilidade a séries de
temperatura máxima em Iguatu-ce. Revista Ciência Agronômica, 41(1):36 45.
Assis, J. P., de Sousa, R. P., de Oliveira Batista, B. D., & Linhares, P. C. F. Probabilidade de chuva em Piracicaba, SP, através da distribuição densidade de
probabilidade Gama (Probability of Rain in Piracicaba, SP, by Distributing Probability Density Gamma). Revista Brasileira de Geografia Física, 11(3), 814-
825.
Astolpho, F. (2003). Estimativa e mapeamento de probabilidades de ocorrência de temperaturas mínimas absolutas do ar adversas à agricultura
paulista. 2003. 99f (Doctoral dissertation, Dissertação (Mestrado em Agricultura Tropical e Subtropical)-Instituto Agronômico, IAC, Campinas).
Atkinson, A. C. (1985). Plots, transformations and regression; an introduction to graphical methods of diagnostic regression analysis
Benini, R. (1905). I diagrammi a scala logaritmica (a proposito della graduazione per valore delle successioni ereditarie in italia, francia e inghilterra).
Giornale degli economisti, 30:222 231.
Berlato, M.A & Althaus, D. (2010). Tendência observada da temperatura mínima e do número de dias de geada do Estado do Rio Grande do Sul.
Pesquisa Agropecuária Gaúcha, Porto Alegre, 16(1), 7-16.
Braun, H. (1980). A simple method for testing goodness of fit in the presence of nuisance parameters. Journal of the Royal Statistical Society: Series B
(Methodological), 42(1), 53-63.
Brockwell, P. J., Brockwell, P. J., Davis, R. A., & Davis, R. A. (2016). Introduction to time series and forecasting. springer.
Catalunha, M. J., Sediyama, G. C., Leal, B. G., Soares, C. P. B., & Ribeiro, A. (2002). Aplicação de cinco funções densidade de probabilidade a séries
de precipitação pluvial no Estado de Minas Gerais. Revista Brasileira de Agrometeorologia, 10(1), 153-162.
Csörgő, S., & Faraway, J. J. (1996). The exact and asymptotic distributions of Cramér‐von Mises statistics. Journal of the Royal Statistical Society:
Series B (Methodological), 58(1), 221-234.
de Assis, J. P., de Sousa, R. P., da Silva, R. M., & Linhares, P. C. F. (2013). Ajuste de sete modelos de distribuições densidade de probabilidade às séries
históricas de umidade relativa mensal em Mossoró–RN. Revista Verde de Agroecologia e Desenvolvimento Sustentável, 8(1), 01-10.
de Mendoza Borges, P. H., & de Mendoza Morais, P. H. (2020). Estimativa de temperaturas favoráveis para o desenvolvimento da avicultura. Revista Ibero-
Americana de Ciências Ambientais, 11(6), 112-119.
Delignette-Muller, M. L., & Dutang, C. (2015). fitdistrplus: An R package for fitting distributions. Journal of statistical software, 64(4), 1-34.
dos Santos Gomes, A. C., da Silva Costa, M., Coutinho, M. D. L., do Vale, R. S., dos Santos, M. S., da Silva, J. T., & Fitzjarrald, D. R. (2015). Análise
estatística das tendências de elevação nas séries de temperatura média máxima na amazônia central: estudo de caso para a região do oeste do
pará. Revista Brasileira de Climatologia, 17.
Durbin, J. (1973). Distribution theory for tests based on the sample distribution function. Society for Industrial and Applied Mathematics.
Faraway J, Marsaglia G, Marsaglia J, Baddeley A. (2017). goftest: Testes clássicos de adequação para distribuições univariadas. Disponível em: URL
https://CRAN.R-project.org/package=goftest.
Fisch, G., Marengo, J. A., & Nobre, C. A. (1998). Uma revisão geral sobre o clima da Amazônia. Acta amazônica, 28(2), 101-101.
Fox, J. (2016). Applied regression analysis and generalized linear models. Sage Publications.
Fox, J., & Weisberg, S. (2019). An R companion to applied regression, Third Edition. Thousand Oaks CA: Sage.
Guarienti, E. M., Ciacco, C. F., Cunha, G. R. D., Del Duca, L. D. J. A., & Camargo, C. M. D. O. (2004). Influência das temperaturas mínima e máxima
em características de qualidade industrial e em rendimentos de grãos de trigo. Food Science and Technology, 24(4), 505-515.
Gumbel, E. J. (1954). Statistical theory of extreme values and some practical applications. NBSApplied Mathematics Series, 33.
IBGE. Censo Demográfico, 2018. .
Johnson, N. L., Kotz, S., & Balakrishnan, N. (1995). Continuous univariate distributions. John wiley & sons.
Mateus, A. & Caeiro, F. (2013). Comparing several tests of randomness based on the di erenceof observations. In AIP Conference Proceedings, volume
1558, pages 809 812. AIP.
Mateus, A., & Caeiro, F. (2014). randtests: Testing randomness in R. R package version 1.0. URL https://CRAN.R-project.org/package=randtests.
Orlowsky, B. (2014). iki. dataclim: Consistency, Homogeneity and Summary Statistics of Climatological Data. R package version, 1. https://CRAN.R-
project.org/package=iki.dataclim.
Pereira, A. S., Shitsuka, D. M., Parreira, F. J., & Shitsuka, R. (2018). Metodologia da pesquisa científica. UFSM. https://repositorio. ufsm.
br/bitstream/handle/1/15824/Lic_Computacao_Metodologia-Pesquisa-Cientifica. pdf.
R Core Team. (2020). R: a language and environment for statistical computing. R Foundation for Statistical Computing.
15Research, Society and Development, v. 10, n. 3, e46210313616, 2021
(CC BY 4.0) | ISSN 2525-3409 | DOI: http://dx.doi.org/10.33448/rsd-v10i3.13616
Rice, S. O. (1945). Mathematical analysis of random noise. Bell System Technical Journal, 24(1):46 156.
Richardson, R. J. (1999). Pesquisa social: métodos e técnicas. Atlas.
Santiago, E. J. P., da Silva Freire, A. K., Cunha, A. L. X., Cantalice, J. R. B., do Carmo Mouco, M. A., Cunha Filho, M., ... & de Oliveira, G. M.
(2020). Caracterização de altas temperaturas e identificação de épocas suscetíveis à estenospermocarpia em mangas ‘Palmer’. Research, Society and
Development, 9(7), e383973734-e383973734.
Shea, B. L. (1988). Algorithm AS 239: Chi-squared and incomplete Gama integral. Applied Statistics, 466-473.
Silva, Í. N., de Oliveira, J. B., de Oliveira Fontes, L., & Arraes, F. D. D. (2013). Distribuição de frequência da chuva para região centro-sul do ceará,
brasil. Revista Ciência Agronômica, 44(3):481 487.
Weibull, W. et al. (1951). A statistical distribution function of wide applicability. Journal of applied mechanics, 18(3):293 297.
Wilk, M. B. & Gnanadesikan, R. (1968). Probability plotting methods for the analysis for the analysis of data. Biometrika, 55(1):1 17.
Ximenes, P. D. S. M. P., da Silva, A. S. A., Ashkar, F., & Stosic, T. (2020). Ajuste de distribuições de probabilidade à precipitação mensal no estado de
Pernambuco–Brasil. Research, Society and Development, 9(11), e4869119894-e4869119894.
16You can also read