IEA Wind Task 36 Gregor Giebel, DTU Wind Energy W. Shaw, H. Frank, C. Möhrlen, C. Draxl, J. Zack, P. Pinson, G. Kariniotakis, R. Bessa EGU Online ...
←
→
Page content transcription
If your browser does not render page correctly, please read the page content below

IEA Wind Task 36

Gregor Giebel, DTU Wind Energy
W. Shaw, H. Frank, C. Möhrlen, C. Draxl, J. Zack, P. Pinson, G. Kariniotakis, R. Bessa
EGU Online 2020

Overview

News from IEA Wind Task 36 on Forecasting:
• Meteo benchmark coming up, info portal continuously updated
• End-user workshop in Glasgow
• Games motivating probabilistic information use

Additional material the Annex:
•   What is the International Energy Agency?
•   What is short-term prediction of wind power?
•   What is the role and setup of IEA Wind Task 36?
•   Achievements: Information portal, Recommended Practice,
    papers, handouts
Task Objectives & Expected Results Task Objective is to encourage improvements in: 1) weather prediction 2) power conversion 3) use of forecasts Task Organisation is to encourage international collaboration between: Research organisations and projects Forecast providers Policy Makers End-users and stakeholders Task Work is divided into 3 work packages: WP1: Weather Prediction Improvements WP2: Power and Uncertainty Forecasting WP3: Optimal Use of Forecasting Solutions Current Term: 2019-2021 (First term 2016-2018)

WP1 Meteorology Current state-of-the-Art
• Verification&Validation benchmark defined (US results to be
  published end of June, benchmark to be published on
  Atmosphere2Electrons (A2E) site)
• Continuously updating the lists, and work underway to use the
  collected data sets for Numerical Weather Prediction

WP2 IEA Recommended Practice on
          Forecast Solution Selection
• Received feedback from industry,
  use of some concepts starts to
  appear in tenders
• Requires more dissemination,
  e.g. on Hybrid systems workshop
• Version Update (2021):
 •   More input from industry
 •   Filling in found omissions
 •   More examples
 •   Collaboration with IEA Solar Task   5
WP3 Optimal Use of Forecasting Solutions
• Definition of forecast error spread / confidence intervals vs forecast
  uncertainty
• Continued collaboration with IEC SC 8A Workgroup on Technical Report
  IEC63043
• Standardisation of meteorological data feeds and instrumentation for
  forecasting
• Value of forecasts: investigation started by analysis (ppt, paper underway)
  and forecast game/experiment:
  https://mpib.eu.qualtrics.com/jfe/form/SV_d5aAY95q2mGI8El
  (feel free to play it yourself - it's still open !)

WP3 End-user Workshop in Glasgow
“Maximising Value from State-of-the-art Wind Power Forecasting Solutions”
         hosted by Jethro Browell at Strathclyde University, Glasgow, 21 Jan 2020

• Talks by academia and industry (e.g. UK National Grid, WindPoint, UStrathclyde )
• Open Space discussion on RP, data and forecast value
• Game on value of probabilistic forecasts (feel free to play it - it's still open !):
  https://mpib.eu.qualtrics.com/jfe/form/SV_d5aAY95q2mGI8El
• Streamed on YouTube: https://www.youtube.com/watch?v=1NOIr7jIuXI
WP3 Forecast Games and Experiments:
 Game 1: Offshore wind power decision making in extreme events
          Conducted by Dr. Corinna Möhrlen, WEPROG in collaboration with Dr. Nadine Fleischhut, MPI for Human Development, Berlin

3 Postulates formed the basis for the experiment design:

(1) Success in the trading is highly dependent on the costs of the balancing power needed due to
     forecast errors
(2 ) 5% of the cases, where there are large forecast errors are responsible for 95% of the costs in a
     month or year
(3) Reducing these costs is more important than improving the general forecasts by ~1%

The Experiment:
Decide in 12 cases whether to trade 50% or 100% of the generating power of an offshore
wind park according to an available forecast given the possibility of a high-speed
shutdown, where the wind park stops generating due to excessive wind conditions.

Definition of a “high-speed shutdown” (HSSD) or “cut-off wind” event :
A high-speed shutdown event occurs typically in the wind range above 21-27m/s, mostly
known as the cut-off wind threshold of 25 m/s. Note that wind turbines use both wind
gusts and the mean wind to determine, whether or not they turn into high-speed
shutdown (HSSD).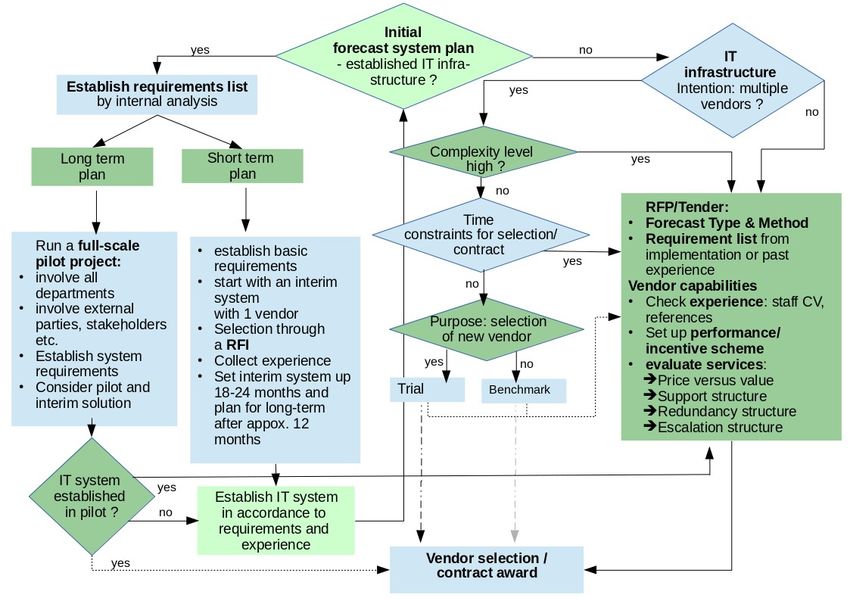
Forecast Game 1:
 Offshore wind power decision making in extreme events
Type of forecasts used in the experiment:
In the experiement are determinisitic and probabilistic forecasts for the day-ahead horizon.
All forecasts are generated with input from NWP (numerical weather prediction) forecasts from the
00UTC cycle the day before.

                                        3 independent deterministic wind power
                                        forecasts in the unit [% of installed
                                        capacity] based on 3 different NWP
                                        (numerical weather prediction) models

                                        1 wind speed forecast in the unit [m/s], which
                                        is a mean forecast from 75 ensemble members and
                                        smoother than a typical deterministic forecast.
                                        Additionally, you see a reference line for the
                                        25m/s threshold reference value for high-speed
                                        shutdown or also sometimes called cut-off wind
                                        speed threshold.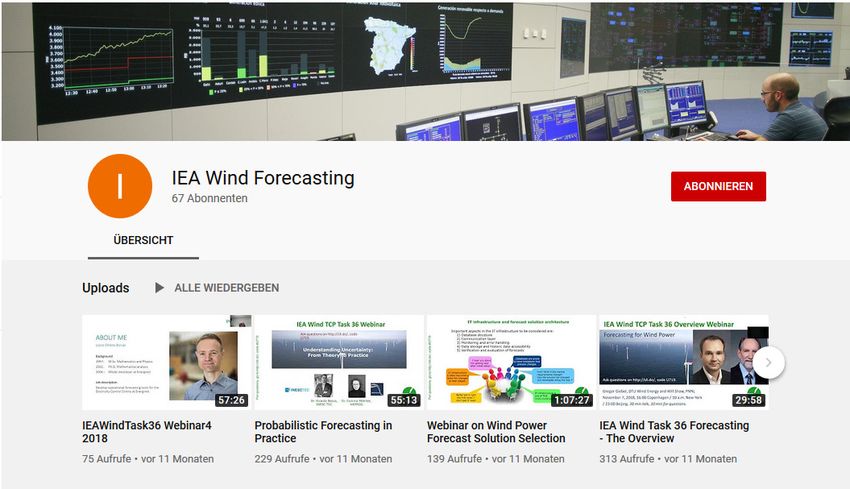
Forecast Game 1:
Offshore wind power decision making in extreme events

                       9 wind power percentiles (P10..P90) and a mean
                       (white line) in the unit [% of installed capacity]
                       generated from 75 NWP forecasts of a multi-scheme
                       ensemble prediction system.

                      9 wind speed percentiles P10..P90 and a
                      mean (white line) in the unit [% of installed
                      capacity] generated from 75 NWP forecasts of a
                      multi-scheme ensemble prediction system.
                      Note: The percentiles here are physically based uncertainty bands
                      and provide an overview of the uncertainty of the forecast.

                      Definition: A percentile indicats the value below which a given
                      percentage of foreasts from the 75 available forecasts falls.
                      E.g., the 20th percentile is the value below which 20% of the
                      forecasts are found.
Forecast Game 1:
Offshore wind power decision making in extreme events
The cost profile
To reflect the costs of large and small errors we have defined a simplified cost function
for the period, where high-speed shutdown (HSSD) can take place.
Definitions:
the wind farm is 100MW and the spot market price is 50 Eur/Mwh.
balance costs are equivalent to spot market prices
The cost function will only consider your choice for the hours, where the actual
generation is full load or no generation
Trading HSSD* No HSSD*
100% -5.000 5.000
50% 0 2.500
* High-Speed Shutdown == cut-off winds
Note that trading 100% is a risky choice that can both increase your income and loss.
The more conservative 50% trading strategy eliminates the risk of a loss, because balance costs are equal to spot market
prices and you can curtail the wind farm to avoid balance costs.Forecast Game 1: Offshore wind power decision making in extreme events ANALYSIS of Questions – preferred information -
Forecast Game:
Offshore wind power decision making in extreme events
ANALYSIS          – final balance -
108 participants:
Best score deterministic: 25.000 EUR
Best score probabilistic: 27.500 EUR
WP3.3: Meteorological Measurements and Instrumentation
Standardization for Integration into Grid Codes
Results from 2 Workshops: ICEM 2019 & WIW 2019
Need for Industry Standard ?
Need for best practices: BUT too strict standards are worse than non
No standards leads to chaotic data management
Instrumentation without maintenance: data looses value
Maintenance schedules: once, twice per year ?
Met instrumentation should be part of the turbine
delivery/installation
• Dissemination
o No consensus on how to accomplish
o ENSO-E is a potential body for dissemination
o Forecasting still undervalued. Need more forecasters in TSOs.
o Need simple advice to give operators, especially in the
developing worldWP3.3: Meteorological Measurements and Instrumentation
Standardization for Integration into Grid Codes
Results from 2 Workshops: ICEM 2019 & WIW 2019
• General Agreement that Standards/RPs are Needed
o Grid codes vary from region to region
o Concern about adopting WMO or similar standards,
which may be expensive overkill for grid code purposes
o Should reference traceability to standards but be
instrument agnostic
o Could suggest required measurements by IPPs at time of
commissioning
o Need education on importance of data quality
o Need to address site selection for instrumentation
o Need to tailor reporting interval to forecast model input
needsTask 36 Web Presence
Website Channel
www.ieawindforecasting.dk
https://www.youtube.com/channel/UCsP1rL
outSXP0ECZKicczXgHandouts
Forecast Solution
Selection
• 2-page handouts: quick overview of major results
• 3 currently available; can be obtained from:
http://www.ieawindforecasting.dk/publications/po
sters-og-handouts
Task 36
Overview
Uncertainty and
Probabilistic
ForecastingThank you!
Gregor Giebel Will Shaw, PNNL,
Frederiksborgvej 399, 4000 Roskilde, DK Richland (WA), USA
grgi@dtu.dk will.shaw@pnnl.gov
The IEA Wind TCP agreement, also known as the Implementing Agreement for Co-operation in the
Research, Development, and Deployment of Wind Energy Systems, functions within a framework
created by the International Energy Agency (IEA). Views, findings, and publications of IEA Wind do
not necessarily represent the views or policies of the IEA Secretariat or of all its individual member
countries.
18Annex
Specific
                          Technology
                          Collaboration
                          Programs:
                          Bioenergy TCP
                          Concentrated Solar Power
                          (SolarPACES TCP)
                          Geothermal TCP
                          Hydrogen TCP
                          Hydropower TCP
                          Ocean Energy Systems
                          (OES TCP)
                          Photovoltaic Power
                          Systems (PVPS TCP)
                          Solar Heating and Cooling
                          (SHC TCP)
                          Wind Energy Systems
                          (Wind TCP)
Image source: dpa

                    See iea.org!
Task 36 members: AT, CN, DE, DK, ES, FI, FR, IE, PT, SE, UK, US
Task 11 Base Technology Exchange
                                               Task 31 WAKEBENCH: Benchmarking Wind
Task 19 Wind Energy in Cold Climates
                                               Farm Flow Models
Task 29 Mexnext III: Analysis of Wind Tunnel
                                               Task 32 LIDAR: Wind Lidar Systems for Wind
Measurements and Improvements of
                                               Energy Deployment
Aerodynamic Models
Task 30 Offshore Code Comparison
                                               Task 36 Forecasting for Wind Energy
Collaboration, Continued, with Correlation     Task 25 Design and Operation of Power
(OC5)                                          Systems with Large Amounts of Wind Power
Task 39 Quiet Wind Turbine Technology          Task 27 Small Wind Turbines in High Turbulence
Task 40 Downwind Turbines                      Sites
Task 41 Distributed Energy                     Task 37 Wind Energy Systems Engineering
Task 42 Wind Turbine Lifetime Extension        Task 26 Cost of Wind Energy
                                               Task 28 Social Acceptance of Wind Energy
                                               Project
                                               Task 34 Working Together to Resolve the
       See ieawind.org!                        Environmental Effects of Wind Energy (WREN)
Short-term prediction of wind power,
quickly explainedSometimes:
Orography
Roughness
Wind farm layout
GRID
Online data
End user
TRADING
Numerical Weather Prediction Prediction model
Image sources: DWD, WAsP, Joensen/Nielsen/Madsen EWEC’97, Pittsburgh Post-Gazette, Red Electrica de España.End user
Numerical Weather Prediction Prediction model
Image sources: DWD, WAsP, Joensen/Nielsen/Madsen EWEC’97, Red Electrica de España.End user
Numerical Weather Prediction Prediction model
WP1: Coordination
Datasets
Benchmarks
Image sources: DWD, WAsP, Joensen/Nielsen/Madsen EWEC’97, Red Electrica de España.End user
Numerical Weather Prediction Prediction model
WP2:
Vendor selection
Evaluation protocol
Benchmarks
Image sources: DWD, WAsP, Joensen/Nielsen/Madsen EWEC’97, Red Electrica de España.End user
Numerical Weather Prediction Prediction model
WP3:
Decision support
Best Practice in Use
Communication
Image sources: DWD, WAsP, Joensen/Nielsen/Madsen EWEC’97, Red Electrica de España.Min/sec
Task 36 Phase 2: Work Package Scope • WP 1: Global Coordination in Forecast Model Improvement o 1.1 Compile list of available wind data sets suitable for model evaluation o 1.2 Annually document field measurement programs & availability of data o 1.3 Verify and validate NWP improvements with common data sets o 1.4 Work with the NWP centers to include energy forecast metrics in evaluation of model upgrades • WP 2: Power and Uncertainty Forecasting o 2.1 Update the IEA Recommended Practice on Forecast Solution Selection o 2.2 Uncover uncertainty origins & development through the whole modelling chain o 2.3 Set-up and disseminate benchmark test cases and data sets o 2.4 Collaborate with IEC on standardisation for forecast vendor-user interaction • WP 3: Optimal Use of Forecasting Solutions o 3.1 Use of forecast uncertainties in the business practices o 3.2 Review existing/propose new best practices to quantify value of probabilistic forecasts. o 3.3 Develop data requirements for real-time forecasting models for use in grid codes
End user

Numerical Weather Prediction                                      Prediction model

                   WP1:                                                      Coordination
                                                                             Datasets
                                                                             Benchmarks

Image sources: DWD, WAsP, Joensen/Nielsen/Madsen EWEC’97, Red Electrica de España.WP1 Meteorology Lead: • Helmut Frank, DWD • Will Shaw, PNNL Mission: To coordinate NWP development for wind speed & power forecasting
WP1 Meteorology • Task 1.1: Compile list of available data sets, especially from tall towers. • Task 1.2: Creation of annual reports documenting and announcing field measurement programs and availability of data. • Task 1.3: Verify and Validate the improvements through a common data set to test model results upon and discuss at IEA Task meetings
WP1 Meteorology Current state • V&V benchmark defined (US results to be published end of June, benchmark to be published on A2E site) • Continuously updating the list, and work underway to use the collected data sets for Numerical Weather Prediction
Minute scale forecasting • How to use Lidars, Radars or SCADA for very short term forecasts • 30 sec – 15 min. • Workshop with Task 32 Lidars at Risø 12/13 June 2018. • Slides available from workshop website. • Complete workshop on YouTube. • Summary paper in Energies journal.
Minute scale forecasting • How to use Lidars, Radars or SCADA for very short term forecasts • 30 sec – 15 min. • Workshop with Task 32 Lidars at Risø 12/13 June 2018. • Slides available from workshop website. • Complete workshop on YouTube. • Summary paper in Energies journal.
Minute scale forecasting • How to use Lidars, Radars or SCADA for very short term forecasts • 30 sec – 15 min. • Workshop with Task 32 Lidars at Risø 12/13 June 2018. • Slides available from workshop website. • Complete workshop on YouTube. • Summary paper in Energies journal.
Long list of experiments, linking to a larger description. Includes older experiments with open data.
End user

Numerical Weather Prediction                                      Prediction model

                   WP2:
                                                                             Vendor selection
                                                                             Evaluation protocol
                                                                             Benchmarks

Image sources: DWD, WAsP, Joensen/Nielsen/Madsen EWEC’97, Red Electrica de España.WP2 Benchmarks Lead: Caroline Draxl, NREL John Zack, UL Pierre Pinson, DTU Elektro
Work Package 2.1:
Recommended Practice for Optimal Forecast Solution Selection
               Slides by John Zack and Corinna Möhrlen
The Problem and an Approach for a Solution
• Documented Benefits:
o Use of forecasts can lower variable generation integration costs
while maintaining the required high system reliability
• Problem:
o A substantial amount of value is not realized due to the use of
non-optimal forecast solutions by users
- Wrong forecast performance objective(s)
- Poorly designed and executed benchmarks/trials
- Use of non-optimal evaluation metrics
• Potential Mitigation:
o IEA Wind Task 36 – Work Package 2 experts formulated a set of
“best practices” for selecting and running wind forecasting
solutionsOverview of IEA-WIND Recommended Practice
for the Selection of Wind Power
Forecasting Solutions (WP 2.1)
#1: Forecast Solution
Selection Process
Target: Compile guidance for the implementation of
renewable energy forecasting into system operation #2: Benchmarks
& Trials
Approach: Develop a set of 3 documents that specify
IEA Wind Recommended Practices for: #3: Forecast
Evaluation
1. Forecast Solution Selection Process
3
Parts 2. Design and Execution of Benchmarks and Trials
3. Evaluation of Forecasts and Forecast Solutions
Current Status: Released
• Available Online:
http://www.ieawindforecasting.dk/publications/recommendedpracticeIEA Best Practice Recommendations for
the Selection of a Wind Forecasting Solution: Set of 3 Documents
• Part 1: Selection of an Optimal • Part 2: Design and Execution of • Part 3: Evaluation of Forecasts
Forecast Solution Benchmarks and Trials and Forecast SolutionsPart 1: Forecast Solution Selection Process:
• Key Concept: the “best” practical forecast
solution process for an application depends
on the user’s access to knowledge, labor
resources and time
• Conducting a performance trial may not profile useful
guidance if not well designed and executed
• Alternative approaches to trials may be more effective
• Key Guidance:
• Decision Support Tool: guidance to determine the best
approach for a specific situation
• Check lists of information to gather for trials, RFP, RFIIEA Task 36 WP2.1
FORECAST SOLUTION SELECTION AND TRIAL/BENCHMARK EXECUTION
• Content Examples:
- Decision Support Tool to find best path for
appropriate solution
- Summary trial/benchmark checklist for all
end-users
- Appendices with
- meta-, historical-, and real time-data
details to make communication more
efficient
- Forecast file format sample
- Questions to ask in RFI/RFP
- Detailed steps during the three main phases
of a trial: preparation, during, and post-trialKey Elements of Recommended Practices
for Forecast Solution Selection
• Selection/update of forecasting solutions in which Quality, Reliability
and Price are in perfect harmony is usually a complex task
• Forecast IT infrastructure and solution architecture need careful
considerations
→provides decision support for basic elements → discourages to just
common to all forecast solutions
“do what everybody else is doing”
→encourages end-users to analyze their own
→ discourages seeking a simple or
situation
cheap solution if the application is
→encourages users to request a forecasting complex
solution that fits their own purposesDecision Support Tool for the
Process of Selecting a Forecasting Solution
• Provides guidance
and practical
examples for:
o the formulation of a
process to select an
optimal forecasting
solution
o analysis and
formulation of
forecasting
requirements
o assessing vendor
capabilities with and
without trialsPart 2: Designing and Executing
Forecasting Benchmarks and Trials
• Key Concept: a benchmark or trial must be
carefully designed, executed and evaluated
in order to produce meaningful
information that can be used for effective
decision-making
o Many decisions are based on “noise” (random
results) produced by benchmarks/trials
• Key Guidance:
o Best practices for the design, execution and
evaluation of trial/benchmarks
o Examples of “pitfalls to avoid”The 3 Phases of a Benchmarking Process: #1
Preparation Phase:
determining the scope and focus
of the performance evaluation
Forecast horizons (look-ahead time periods)
Available historical data
Appropriate length of benchmark
Are conditions during benchmark representative?
Meaningful evaluation metrics
Think of what factors are most important as in any big or long-term
purchase (e.g. home, car, forecasting system)?The 3 Phases of a Benchmarking Process: #2
Execution Phase:
ensuring a fair and representative
process
• Data monitoring (forecasts and observations)
• For fairness and transparency: test accuracy and delivery performance.
• Monitor forecast receipt (reliability)
• Sample should be normalized (all forecasters evaluated for same period & locations)
• Develop and refine the evaluation scriptsThe 3 Phases of a Benchmarking Process: #3
Analysis Phase:
compiling a comprehensive and
relevant assessment
• Critical Evaluation Criteria:
o Application-relevant accuracy of the forecasts
o Performance in the timely delivery of forecasts
o Ease of working with the forecast providerExamples of Benchmarking Pitfalls to Avoid
• Poor communication with forecast providers
o All providers not provided with the same set of information
o Incumbent providers having an information advantage by default
• Unreliable comparisons
o Forecasts for different time periods are compared (evaluated)
o Forecasts for different facilities/portfolios are compared (evaluated)
• Bad design
o Short trials in unrepresentative periods (e.g. 1 month in a low wind season)
o No on-site data given to forecast providers
o Intra-day forecasts made from once-a-day target-site data update
• Details missing or not communicated to providers
o No documentation of daylight savings time changes in data files
o No specification of whether data time stamp represents interval beginning or
ending
o No documentation of plant capacity changes in historical data or trial period
o Curtailment and maintenance outages not provided
• Opportunities for “cheating” not eliminated
o No penalty for missing forecasts ( possible no submission in difficult situations)
o Forecast delivery times not enforced (could submit later forecasts)Part 3: Evaluation of Forecasts
and Forecast Solutions
• Key Concept: all forecast performance
evaluations have a degree of uncertainty that
is a composite from a number of factors
o Management of evaluation uncertainty should be a
priority in order to maximize signal/noise
o Poor management of uncertainty may result in
evaluation information being dominated by noise
• Key Guidance:
o Three key attributes of an evaluation process
o Factors and issues associated with each attribute
o Approaches to minimize evaluation uncertaintyThree Critical Factors to Achieve a Meaningful Trial: #1
Representativeness: relationship between the
results of a forecast performance evaluation and
the performance that is ultimately obtained in
the operational use of a forecast solution
• Statistically meaningful evaluation sample size and composition
• High quality data from the forecast target sites
• Formulation and enforcement of rules governing the submission of
forecasts (“fairness”)
• Availability of a complete and consistent set of evaluation procedure
information to all evaluation participants (“transparency”)Three Critical Factors to Achieve a Meaningful Trial: #2
Significance: ability to differentiate between
performance differences that are due to noise in the
evaluation process and those that are due to
meaningful differences in skill among forecast solutions
• Minimize noise in the evaluation sample (i.e. lower the uncertainty)
• Quantify the uncertainty in performance metrics
• Consider performance uncertainty bands when evaluating performance
differences among candidate solutionsThree Critical Factors to Achieve a Meaningful Trial: #3
Relevance: degree of alignment between the
evaluation metrics used for an evaluation and the
true sensitivity of a user’s application(s) to forecast
error
• Ideal Approach: formulate a cost function that transforms forecast error to the
application-related consequences of those errors (often very difficult)
• Practical Alternative: use a matrix of performance metrics that measure a range of
forecast performance attributes
• When using more than one relevant metric:
• Remember: ONE forecast can NOT be optimal for more than one metric;
•Use separate forecast optimized for each metric if that attribute of performance is critical
• When employing multiple (“N”) forecast solutions: choose the set that provides the
best composite performance NOT the “N” best performing solutionsForecast Performance Perception and
Optimization:
Example of the Impact of Metric Selection
Solid: Actual Dashed: Forecasted
• Ramp forecast example
• Typical case: user is
interested in forecasting
occurrence and
attributes of ramp events Lowest
for operational decision- MAE
making
• User evaluates forecast
with a widely-used
global metric such as
MAE
• Provider optimizes to the Phase (Timing) Amplitude Ramp Rate
user’s selected metric Error Error Error
Verifying a ramp forecast with MAE/RMSE brings the forecast service provider into a dilemma:
Tuning of forecast can (1) create good MAE scores or (2) serve the customer’s needs → NOT BOTHKey Points of Part 3 • All performance evaluations of potential or ongoing forecast solutions have a degree of uncertainty • The uncertainty is associated with three attributes of the performance evaluation process evaluation process: (1) representativeness, (2) significance and (3) relevance • A carefully designed and implemented evaluation process that considers the key issues in each of these three attributes can minimize the uncertainty and yield the most meaningful evaluation results • A disregard of these issues is likely to lead to uncertainty and/or decisions based on unrepresentative information
End user

Numerical Weather Prediction                                      Prediction model

                   WP3:
                                                                             Decision support
                                                                             Scenarios
                                                                             Best Practice in Use
                                                                             Communication

               Image sources: DWD, WAsP, Joensen/Nielsen/Madsen EWEC’97, Red Electrica de España.
WP3 Advanced Usage Lead: Corinna Möhrlen, WEPROG Ricardo Bessa, INESC TEC George Kariniotakis, Mines ParisTech
15th Int. Workshop on Large-Scale Integration of Wind Power
into Power Systems as well as on Transmission Networks for
Offshore Wind Farms, Vienna, 15 - 17 November, 2016

    15th Int. Workshop on Large-Scale Integration of Wind Power into Power Systems, Vienna, Nov. 2016
Use of probabilistic forecasting Open Access journal paper 48 pages on the use of uncertainty forecasts in the power industry Definition – Methods – Communication of Uncertainty – End User Cases – Pitfalls - Recommendations Source: http://www.mdpi.com/1996-1073/10/9/1402/
Broader paper on uncertainty
  forecasting

DOI: 10.1109/MPE.2017.2729100
Minute-scale forecasting
Open Access review journal paper: 30
pages on minute-scale forecasting of wind
power inclusive review on data
assimilation techniques, probabilistic
methods.

Use of minute-scale forecasting: (1) wind
turbine and wind farm control, (2) power
grid balancing, (3) energy trading and
ancillary services

Source:https://www.mdpi.com/1996-1073/12/4/712

Energies 2019, 12, 712; doi:10.3390/en12040712
www.mdpi.com/journal/energies
WP3 End use Workshop Glasgow
“Maximising Value from State-of-the-art Wind Power Forecasting Solutions”
Strathclyde University, Glasgow, 21 Jan 2020
• Talks by academia and industry (e.g. UK National Grid)
• Open Space discussion on RP, data and forecast value
• Game on value of probabilistic forecasts (feel free to play it yourself!):
   https://mpib.eu.qualtrics.com/jfe/form/SV_d5aAY95q2mGI8El
• Streamed on YouTube: https://www.youtube.com/watch?v=1NOIr7jIuXI
Topic: Meteorological Measurements and Instrumentation
Standardization for Integration into Grid Codes
Results from 2 Workshops: ICEM 2019 & WIW 2019
Need for Industry Standard ?
Need for best practices: BUT too strict standards are worse than non
No standards leads to chaotic data management
Instrumentation without maintenance: data looses value
Maintenance schedules: once, twice per year ?
Met instrumentation should be part of the turbine
delivery/installation
• Dissemination
o No consensus on how to accomplish
o ENSO-E is a potential body for dissemination
o Forecasting still undervalued. Need more forecasters in TSOs.
o Need simple advice to give operators, especially in the
developing worldTopic: Meteorological Measurements and Instrumentation
Standardization for Integration into Grid Codes
Results from 2 Workshops: ICEM 2019 & WIW 2019
• General Agreement that Standards/RPs are Needed
o Grid codes vary from region to region
o Concern about adopting WMO or similar standards,
which may be expensive overkill for grid code purposes
o Should reference traceability to standards but be
instrument agnostic
o Could suggest required measurements by IPPs at time of
commissioning
o Need education on importance of data quality
o Need to address site selection for instrumentation
o Need to tailor reporting interval to forecast model input
needsData Science for Environmental
Modelling and Renewables
- A Massive Open Online Course -
PRESENTATION SLIDES
ESIG Forecasting Workshop
Session 8
Jethro Browell
(presented by Corinna Möhrlen)
June 2018
St. Paul, MN, USA
supported byData Science for Environmental
Modelling and Renewables
A Massive Open Online Course
6 Weeks, Equivalent to 5 ECTS Credits Funded by:
Hosted on:
Course Outline
Week 1: Introduction
Week 2: R Bootcamp
Week 3: Patterns in temporal data
Week 4: Patterns in spatial, spatio-temporal and network data
Week 5: Open data, Citizen Science and Twitter
Week 6: Wind and Solar Power Forecasting
supported byVideo Content
30-60 Minutes of video comprising a short lecture and
Week 6: Wind and Solar Power interviews with forecast users.
Forecasting Content Pages
By the end of the week participants will be able to: 1. Overview of the model chain: NWP →
• Explain the principles of numerical weather Physical/Statistical Model → Use and Evaluation
prediction and make informed use of such data 2. Numerical Weather Prediction: Basic Principles
• Produce basic deterministic and probabilistic 3. Tools and methods in R
wind and solar power forecasts 4. Deterministic Wind Power Forecasting
• Explain and apply the principles of forecast 5. Principles of Deterministic Forecast Evaluation
evaluation 6. Deterministic Solar Power Forecasting
7. Introduction to Probabilistic Forecasting
8. Producing Probabilistic Forecasts
9. Principles of Probabilistic Forecast Evaluation
10. Best Practice for Users of Commercial Forecasts
supported byStatement for Discussion
Teaching should include standards or guidelines and provide a
deeper understanding of the underlying fundamentals
Not having standards leaves teaching at
- fundamental principles
- missing knowledge on state of the art developments
Not having standards educates young professionals with
- very different skills
- no reference to relate new projects to
supported byWind power forecasting: IEA Wind Task 36 & future research issues G Giebel1, J Cline2, H Frank3, W Shaw4, P Pinson5, B-M Hodge6, G Kariniotakis7, J Madsen8 and C Möhrlen9 Published under licence by IOP Publishing Ltd Journal of Physics: Conference Series, Volume 753, B. Wind, wakes, turbulence and wind farms
Collected Issues

                                                                              Red: Important research, but (to be) done elsewhere
Nowcast (especially for difficult situations, thunderstorms, small lows, …)
Sub 1 hour temporal resolution

                                                                              Green: We work on at least some aspects
Meteorology below 1km spatial resolution
Stability issues, especially with daily pattern / (Nightly) Low level jets
Icing
Farm-Farm interaction / quality of direction forecast
Short-term ensembles
Ramps and other extremes
Spatio-temporal forecasting
Rapid Update Models (hourly, with hourly data assimilation)
Use of probabilistic forecasts and quality of the extreme quantiles
Do DSOs need different forecasts than TSOs?
Penalties for bad performance? Incentives for improved perf.?
Seasonal forecasting? What’s the business case?
Data assimilation (with non-linear Kalman filters, 4D Var, …)
www.IEAWindForecasting.dk
Gregor Giebel Will Shaw, PNNL,
Frederiksborgvej 399, 4000 Roskilde, DK Richland (WA), USA
grgi@dtu.dk will.shaw@pnnl.gov
The IEA Wind TCP agreement, also known as the Implementing Agreement for Co-operation in the
Research, Development, and Deployment of Wind Energy Systems, functions within a framework
created by the International Energy Agency (IEA). Views, findings, and publications of IEA Wind do
not necessarily represent the views or policies of the IEA Secretariat or of all its individual member
countries.
82You can also read


