Northland Power Investor Presentation - September 2021
←
→
Page content transcription
If your browser does not render page correctly, please read the page content below
Northland Power
    Investor Presentation

    September 2021

1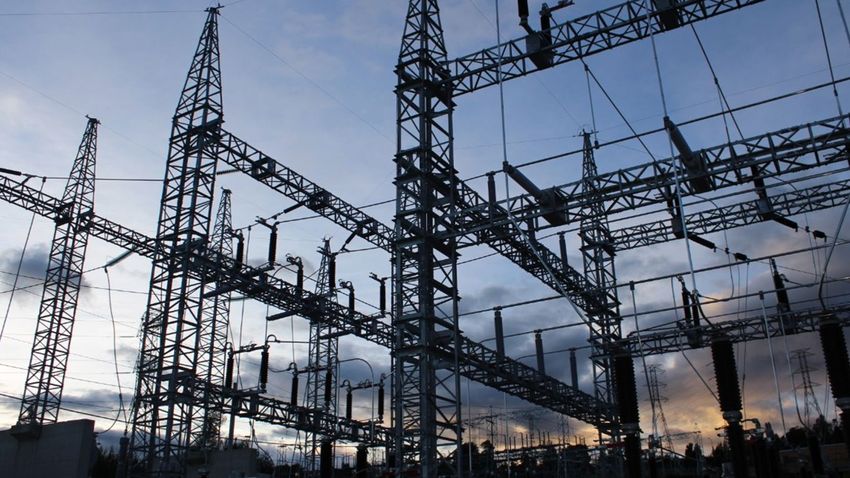
FORWARD LOOKING STATEMENTS DISCLAIMER

This written and accompanying oral presentation contains certain forward-looking statements which are provided for the purpose of presenting information about management’s current expectations and plans. Readers are
cautioned that such statements may not be appropriate for other purposes. Northland’s actual results could differ materially from those expressed in, or implied by, these forward-looking statements, and accordingly, no assurances
can be given that any of the events anticipated by the forward-looking statements will transpire or occur. Forward-looking statements are predictive in nature, depend upon or refer to future events or conditions, or include words
such as “expects”, “anticipates”, “plans”, “predicts”, “believes”, “estimates”, “intends”, “targets”, “projects”, “forecasts” or negative versions thereof and other similar expressions or future or conditional verbs such as “may”, “will”,
“should”, “would” and “could”.

These statements may include, without limitation, statements regarding future adjusted EBITDA, free cash flow, adjusted free cash flow, dividend payments and dividend payout ratios; the construction, completion, attainment of
commercial operations, cost and output of development projects; litigation claims; plans for raising capital; and the future operations, business, financial condition, financial results, priorities, ongoing objectives, strategies and
outlook of Northland and its subsidiaries. These statements are based upon certain material factors or assumptions that were applied in developing the forward-looking statements, including the design specifications of development
projects, the provisions of contracts to which Northland or a subsidiary is a party, management’s current plans and its perception of historical trends, current conditions and expected future developments, as well as other factors
that are believed to be appropriate in the circumstances.

This presentation contains forward-looking statements and information, within the meaning of Canadian securities laws and in any applicable Canadian securities regulations, concerning the business and operations of Northland
Power Inc. Forward-looking statements may include estimates, plans, expectations, opinions, forecasts, projections, guidance or other statements that are not statements of fact. Forward-looking statements in this presentation
include statements regarding the quality of Northland’s assets and the resiliency of the cash flow they will generate, Northland’s anticipated financial performance and payout ratio, future commissioning of assets and expected
returns from such assets, technology diversification, acquisition opportunities, expected completion of acquisitions, contract, contract counterparties, operating performance, variability of renewable resources and climate change,
offshore wind concentration risk, market power prices, fuel supply, transportation and price, operations and maintenance, permitting, construction, development prospects and advanced stage development, financing and
refinancing opportunities, certain information regarding the company’s expected cash flow profile and liquidity, , liquidity, credit rating, currency fluctuations, variability of cash flows and potential impact on dividends, taxes, natural
events, environmental, health and safety, government regulations and policy, international activities, relationship with stakeholders, reliance on information technology, reliance on third parties, labour relations, insurance, co-
ownership, bribery and corruption, legal contingencies, future energy prices and demand for electricity, economic recovery, project development and capital expenditure costs, energy policies, economic growth, growth potential of
the renewable asset class, the future growth prospects and distribution profile of Northland Power and its access to capital and the other factors described in Northland’s 2020 Annual Report and 2020 Annual Information Form,
which are both filed electronically at www.sedar.com and Northland’s website www.northlandpower.com.

All figures are presented in Canadian dollars unless otherwise indicated. Unless otherwise indicated, the statistical and financial data in this presentation is presented as of June 30, 2021.
 2

Northland Overview
               Resilient Operations and a Global Platform

    •   Northland Power is a leading global power producer dedicated to helping the clean energy transition
    •   Over 30 years of success developing, constructing and operating power projects across a range of
        technologies
    •   Well-diversified portfolio of high-quality power infrastructure assets: over 3 GW of operating capacity
    •   Approximately 95% of revenues under long-term contracts with highly creditworthy government
        counterparties
    •   Significant development opportunities across multiple markets and technologies: 4-5 GW of identified
        development projects
    •   Significant depth of management experience across a number of disciplines including renewables,
        project finance, construction and development, Human resources, and risk management
    •   Strong environmental and health & safety record

3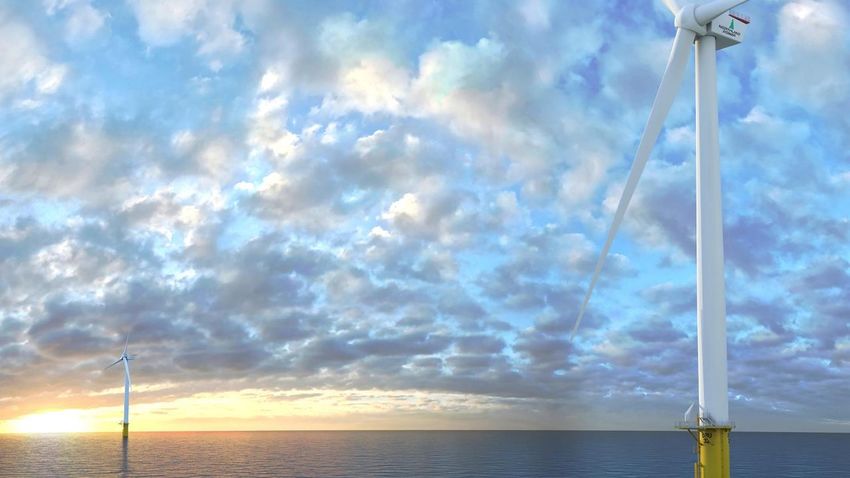
Evolution of Northland
                                    Offshore Wind has Accelerated Our Growth

    Net Capacity (MW)                         Adjusted EBITDA ($Mln)               Free Cash Flow/Share

                                   2,266 MW                               $1,170                                  $1.73
                        2,029 MW                                $765                                  $1.46

       1,345 MW         10% CAGR
                                                $363          21% CAGR
                                                                                     $1.12          9% CAGR

          2014           2017       2020        2014            2017      2020        2014            2017        2020

     0%                               40%     0%                             60%    0%                                    50%
                  Offshore Wind                           Offshore Wind                           Offshore Wind
                   Contribution                            Contribution                            Contribution

4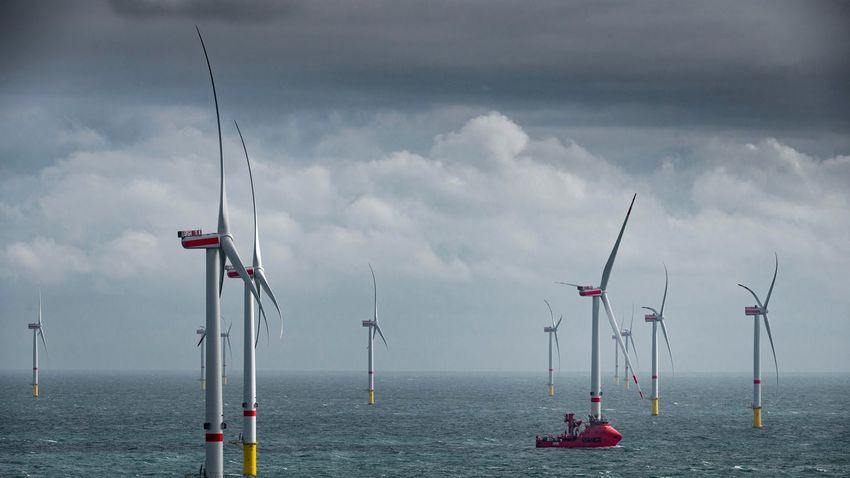
Shareholder Returns
                                                        Track Record of Strong Returns to Shareholders

      Annual Dividends (Distributions) per share                                                                                Total Shareholder Returns

                                                                                                               $1.20
                                                                                                                                     Peer Group
                                                                                                                                     S&P/TSX Capped Utilities Index
    $0.89                                                                                                                            Northland Power

                                                                                                                                                      17%
                                                                                                                                                                                                     16%

     1998 1999 2000 2001 2002 2003 2004 2005 2006 2007 2008 2009 2010 2011 2012 2013 2014 2015 2016 2017 2018 2019 2020 YTD
                                                                                                                        2021            5-Year TSR                                    10-Year TSR

                                                                                                                               1.   Canadian IPP Peer Group includes Algonquin Power, Boralex, Brookfield
                                                                                                                                    Renewable, Capital Power, Innergex, and TransAlta.
                                                                                                                               2.   As at August 31, 2021.

5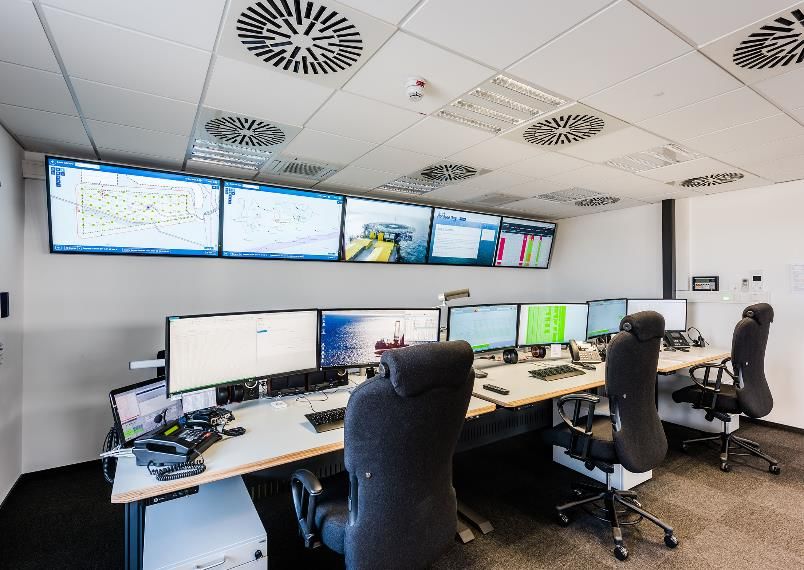
Global Competitive Position
                    Northland is on the Ground in Key Markets

    Northland Power Offices

6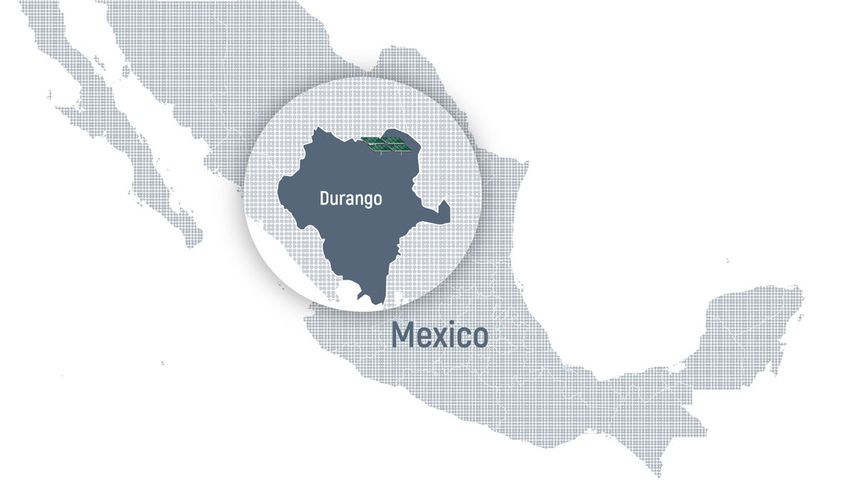
Global Competitive Position
                                The Talent to Win

     REGIONAL DEVELOPMENT               OFFSHORE                     ONSHORE
            OFFICES                       WIND                      RENEWABLES

    Toronto       Houston     Offshore wind engineering and   Onshore wind, solar and
                              construction management         construction management
    Mexico City   Bogota
                              Hamburg                         Toronto
    London        Amsterdam
                              Taipei
    Seoul         Tokyo

7
Accelerating Growth
                        Northland’s Capital Allocation is Focused on Renewable Growth
                                      Northland has the following major business segments

      Offshore Wind               Onshore Renewables                  Utilities          Efficient Natural Gas        New Technologies
    Increase Exposure              Increase Exposure             Increase Exposure         Reduce Exposure            Establish Position

                   Our Renewables segments are growing in line with our capital allocation strategy, and we intend to establish initial
                                   positions in new technologies such as energy storage and renewable green fuels

8
Accelerating Growth
                      Balancing Long-term Growth with Near-term Cash Flow

                        2021 - 2025                                                        2026 - 2030

        Focus on providing near-term cash
                      flow                                                    Accelerating Growth

    •    Development of onshore renewable projects with shorter   •   Offshore wind drives significant growth in capacity and
         incubation periods                                           cash flow
    •    M&A to augment immediate cash flow                       •   New initiatives to drive additional growth

9
Evolution of Northland
                                                                                               Doubling the Company (again) by ~2030

                             Significant offshore wind platform of operating and development projects position Northland as a global leader in offshore wind
                                                                                      development

                                         4-5 GW                                                                                                                 $15-20+                                Billion
                                         Identified Development Projects1                                                                                            Potential capital investment over next 5 years,
                                                                                                                                                                       anchored by Offshore Wind development
                                                                                                                                                                   ($10-14 billion net Northland ownership interest)

                                                                                                More projects being initiated and through M&A

     1. Details for the Identified Development Projects have been provided later in the presentation which includes projects that are owned and active that Northland has publicly disclosed.
10
Sustainability
Our Commitment to Sustainable Growth
Aligning our values with the United Nations Sustainability Development Goals
Our Planet Our Community Our People Our Company
De-carbonization and footprint A safe, healthy, inspired and Responsible and transparent
A positive and contributing community
minimization empowered workforce governance and sustainable value
partner
creation
11Sustainability
Our Commitment to Develop a Carbon Free World
E 4-5 GW
of additional energy
generation from
renewable sources
65%
Reduction
Carbon intensity
across our portfolio
S
highest
A positive and
standards of
contributing
Health & Safety
community
partner
G
30% Continuing emphasis
of female on Corporate
representation on Governance best
Board of Directors/ practices
Executive Office
12Portfolio Overview Northland Power 13
Diversified Asset Portfolio
                                                                    Significant Operating and Development Portfolio

                                                                                                  North Sea Offshore Wind       Baltic Power In Advanced
                                                                                                                                       Development
                                                         Canadian Onshore
                                                              Assets
                                                                                        NY Wind
                                                                                       (320 MW)

                                                                                                                     Spain Onshore
                                                                                                                      Renewables
                                                                                                                                                                        Hai Long In Advanced
                                                                                                                                                                            Development
                                                                            EBSA - Regulated
                                 La Lucha Solar                                  Utility
                                   (130 MW)

                                                   Helios Solar
                                                                                                                                            Technology:                 Operating               Under Construction &
                Operating                           (16 MW)
                                                                                                                                                                                               Advanced Development
                                                                                                                                            Offshore Wind               1,184 MW                           2,244 MW
                Early – Stage Development
                                                                                                                                            Onshore Wind                 829 MW                              320 MW
                Mid/late Stage Development/Construction                                                                                     Solar                        246 MW                              146 MW

                                                                                                                                            Natural Gas                  973 MW                                    -

                                                                                                                                            Total Capacity (Gross)1,2   3,232 MW                           2,710 MW
     1.   As at August 11, 2021. Includes Spain Portfolio acquisition
14   2.   Includes Hai Long, La Lucha, NY Wind and Baltic Power
Northland Operating Assets
Expiry PPA Construction
Project Technology Location Gross Capacity Ownership Term (On-time/on-budget)
Gemini Offshore Wind Netherlands 600 MW 60% 2032
Nordsee One Offshore Wind Germany 332 MW 85% 2027
Deutsche Bucht Offshore Wind Netherlands 252 MW 100% 2031 (Base Plant)
Mont Louis Onshore Wind QC, CA 100 MW 100% 2031
Jardin d’Éole Onshore Wind QC, CA 134 MW 100% 2029
McLean’s Mountain Onshore Wind ON, CA 60 MW 50% 2034
Grand Bend Onshore Wind ON, CA 100 MW 50% 2036
100% (90 MW)
Ground-Mount Solar Solar ON, CA 130 MW 2033-2035
62.5% (40 MW)
Thorold Efficient Natural Gas ON, CA 265 MW 100% 2030
Iroquois Falls Efficient Natural Gas ON, CA 120 MW 100% 2021
Spy Hill Efficient Natural Gas SK, CA 86 MW 100% 2036
North Battleford Efficient Natural Gas SK, CA 260 MW 100% 2033
Kirkland Lake Efficient Natural Gas ON, CA 132 MW 68%¹ 2030
EBSA Regulated Distribution Utility Colombia n/a 99.2% Perpetual n/a
Onshore Wind/Solar/Concentrated Solar
Spain Portfolio2 Spain 560 MW 98% 2031 n/a
Power
1. Northland has an effective 77% residual economic interest
15 2. Closed August 11, 2021 A P P EN DIXOperations
Wide Breadth of Generation and Utility Experience
• Offshore Wind, Onshore Wind, Solar, Gas Turbine, Electricity
Transmission, Distribution and Marketing Activities In-House
• Industry-leading Generation availability factors and Utility reliability
rates across the fleet in 2020 despite COVID-19
• Perform all balance of plant operations (substations, transmission)
at most of our facilities
• Operators and Technicians fully certified in plant operations and
leveraging shared best practices to ensure cost efficiency and
economies of scale by technology
• Operating teams provide Due Diligence services to Development
Teams to ensure lessons learned and best practices in assessing
new opportunities
16Offshore Wind Northland Power 17
Growth Strategy
                                                  Offshore Wind Platform to Anchor Northland’s Growth
                                Significant offshore wind platform of operating and development projects position Northland as a global leader in offshore wind
                                                                                         development

                                                                                                             Europe (Offshore Wind):
                                                                                                             Baltic Power: up to 1,200 MW

                                                                          Europe (Offshore Wind):
                                                                          Gemini: 600 MW
                                                                          Nordsee One: 332 MW
                        Canada (Offshore Wind):                           Deutsche Bucht: 252 MW
                        Hecate: 400 MW
                                                                                                    Additional Europe (Offshore Wind):
                                                                                                                                                   Asia (Offshore Wind):
                                                                                                    5,000+ MW
                                                                                                                                                   Hai Long: 1,044 MW
                                                                                                                                                   Dado Ocean: 1,000 MW
                                                                                                                                                   Chiba: 600 MW

                                                                                                                                                   Additional Asia (Offshore Wind):
                                                                                                                                                   2,000+ MW

                  Operating

                  Early – Stage Development

                  Mid/late Stage Development/Construction

18
23   1. Based on gross installed capacity.
Europe
Established Offshore Wind Platform in North Sea
1 Deutsche Bucht
COD: 2020
Capacity: 252 MW
Ownership: 100%
PPA Expiry: 2032
1 Deutsche Bucht
1.2 GW1 2 Gemini
Offshore wind Nordsee One 3
in-operation
2 Gemini 3 Nordsee One
COD: 2017 COD: 2017
Capacity: 600 MW Capacity: 332 MW
Ownership: 60% Ownership: 85%
PPA Expiry: 2031 PPA Expiry: 2027
1. Represents total gross operating capacity .
19Poland
Expanded Portfolio with Baltic Power Offshore Wind Project
Baltic Power • Acquired 49% interest in mid-stage offshore wind development project with
potential for up to 1.2 GW of capacity
• Continuation of Northland’s strategy of leveraging its top ten sector position
globally to expand offshore wind portfolio
• Project will benefit from long-term, 25-year CfD revenue contract
Poland
• Market entry with strategic partner PKN Orlen, Poland’s largest company; synergy
between Orlen’s significant local presence and Northland’s offshore wind expertise
Timeline For Baltic Power Development
2021 2023 2023 2026
Expected
Secured CfD Achieve Financial Expect to start
20 Close Construction
Commercial
OperationsAsia
Growth leading from the anchor project across the region
4.5 GW+1 Japan
Offshore wind
South Korea
in-development Taiwan
Taiwan Japan South Korea
Hai Long Chiba Dado Ocean
1, 044 MW 600 MW Up to 1,000 MW
Early Stage Development
Asia Growth
Mid/Advanced Stage Development
Additional projects
2,000+ MW
1. Represents total gross in development pipeline
21Taiwan Offshore Wind
Hai Long
Key Project Highlights
Status: Advanced Development
• 40-50 km off the west coast of Taiwan, in Taiwan
Straits, located in Changhua County
Location:
• Water depth between 35 and 50 meters
• 10 m/s average wind speed
Capacity: 1,044 MW (gross)
Taipei
Signed 20-year PPA under FIT (300 MW); pursuing PPA Taiwan Strait City
Contract: for remaining (744 MW) with Taipower with possibility
for corporate PPA
Technology: Offshore wind Taiwan
Ownership: Northland Power: 60%
Water Depth: 0–20 m
Water Depth: 20–50 m
Timeline For Hai Long Development
2021 2022 2023 2025-2026
Target Securing PPA Expected
Achieve Financial Expect to start
22 for 744 MW auction
Close Construction
Commercial
component OperationsJapan and South Korea
Developing local partnerships to facilitate opportunities for future offshore wind
Japan South Korea
• Announced entry into Japanese market with joint • Acquired Dado Offshore Wind Corp. in February 2020
venture in November 2019 • Multiple early-stage development opportunities near
• Established Chiba offshore Wind Inc. to develop early Chodo Island
stages offshore wind opportunities • Early-stage development projects with potential for
• Early-stage development projects with potential for 600 1,000 MW of offshore wind
MW of offshore wind
South Korea
Japan
Chodo Island
Tokyo
23Onshore Renewables Northland Power 24
Growth Strategy
                                                    Onshore Renewables to Support Near-term Growth
                                                                               Targeted Approach to Developing Onshore Renewables

                                                                 Canada (Gas-Fired):
                                                                 North Battleford: 260 MW
                                                                 Iroquois Falls: 120 MW     Canada (Solar):
                                                                 Thorold: 265 MW            Ontario Solar: 90 MW
                                                                 Spy Hill: 86 MW            Cochrane Solar: 40 MW
                                                                 Kingston: 110 MW
                                                                 Kirkland Lake: 132 MW
                                                                                                           Canada (Onshore Wind):
                                             Additional Canada (Wind/Solar):                               Grand Bend: 100 MW
                                             800 MW                                                        Mont Louis: 101 MW
                                                                                                           Jardin d‘Éole: 133 MW                 Spain (Wind/Solar):
                                                                                                           McLean‘s Mountain: 60 MW              Onshore Wind: 435 MW
                                                                                                                                                 Solar: 66 MW
                                                                                            U.S. (Onshore Wind):                                 Concentrated Solar: 50 MW
                                                 Mexico (Solar):
                                                                                            Ball Hill : 108 MW
                                                 La Lucha Solar: 130 MW
                                                                                            Bluestone: 112 MW       Additional U.S. (Solar):
                                                                                            High Bridge: 100 MW     200 MW

                                                                                                                     Colombia (Utility): EBSA:
                                                                                                                     503,000 customers

                                                                  Colombia (Solar):

                      Operating                                   Helios Solar: 16 MW

                      Early – Stage Development

                      Mid/late Stage Development/Construction

     1. Based on gross installed capacity.
25
Spain
A Leading Onshore Renewables Portfolio
• Acquired a portfolio of 551 MW (net) of onshore renewables with a regulated
tariff
– ~80% of the portfolio consists of onshore wind assets, with the balance
comprising solar PV and Concentrated Solar Power (CSP)
• Positions Northland as top 10 owner of operating onshore renewables in Spain
and provides better access to growth opportunities locally and elsewhere in
Europe
• Assets are supported with a regulated tariff with more than 13 years remaining of
regulatory life
Madrid
• Immediate cash flow contribution to further support offshore development
strategy/initiatives
• Portfolio benefits from a diversified mix of equipment suppliers and OEM
providers, mitigating exposure to any single manufacturer or service provider
Wind
PV
Concentrated Solar Concentrated Solar
Onshore Wind Solar PV
Power Power
Net Capacity 435 MW 66 MW 50 MW
Project(s) 14 18 1
Operating portfolio supplies
Average Asset Age 11 Years 10 Years 10 Years over 270,000 of households with energy
Fully Regulated Yes Yes Yes
26Mexico
La Lucha Solar
• Solar project located in State of Durango, Mexico; ~78 km from the
city of Torreon
La Lucha
• 130 MW solar project with 100% Northland ownership
Torreon
• First step in Mexico strategy that will focus on commercial and
industrial market with a diversified generation portfolio
• EPC contract with Grupo Ortiz who will provide first two years of
O&M services
• Will target to secure commercial offtake contracts for the project’s
output after commercial operations
Timeline For La Lucha Development
2019 2019 2022
Expected
Final Investment Start of
Commercial
27 Decision Construction
OperationsUnited States
New York Onshore Wind Project Overview
Buffalo New York Albany • Acquired three New York onshore wind development projects in 2020. Projects
expand Northland’s North American portfolio by providing investment
Ball Hill Bluestone
opportunities into the US renewables market
NYC
High Bridge • Well positioned from a competitive standpoint relative to the state’s wind
development pipeline
• USD cash flows from stable and high demand market
• 320 MW potential capacity (Bluestone, High Bridge and Ball Hill)
• Secured 20-year indexed REC contract (CfD all-in PPA) with with the New York State
Energy Research and Development Authority
• Achieved financial close on Ball Hill and Bluestone in Q2 2021 and actively
developing Highbridge
Timeline For NY Wind Development
2020 2021 2021 2022/23
Expected
Acquired Projects Secured 20 year Expect to start
28 IRec Offtake Construction
Commercial
OperationsColombia
Helios Solar Project Overview
• 16 MW Solar project in Colombia
• First development project in Colombia to capitalize on EBSA’s grandfathered
rights, allowing it to expand into the energy generation market in Colombia
EBSA • Aim is to service the power needs of non-regulated municipal, commercial and
industrial (C&I) customers
Helios
• Secured 12-year Power Purchase Agreement with EBSA
• Achieved financial close in Q2 2021
Timeline For Helios Solar Development
2020 2021 2021 2022
Expected
Acquired Projects Financial Start of
29 Close Construction
Commercial
OperationsUtilities Northland Power 30
Latin America
                                                                                                 EBSA Utility
                                                                                                • EBSA provided strategic value to existing asset portfolio
                                                                       Boyaca                         • Sole distributor to a population of over 1.3 million; proven management team with local
                                                                                                        expertise
                                                                                                      • Operates under regulatory framework with an average approved WACC of
                                                                       Duitama
                                                                                                        approximately 11.5%
                                                                                                      • RAB is expected to grow at a rate in excess of inflation
                                                                                                      • Other key regulatory features including RAB inflation indexation, a five-year planning
                                                               Tunja               Sogamoso             cycle and limited to no demand risk
                                                                                                      • Provided a measure of stability and predictability to Free Cash Flow
                                Bogota                     Headquarters located in Tunja,             • Reduced concentration risk as well as exposure to re-contracting and merchant power
                                                               150 km from Bogota                       price risk
                                                                                                • Provided Northland with a platform to drive future opportunities in Colombia and
                                                                                                  Latin America
                                                                                                      • EBSA is one of a few energy companies in Colombia with favourable grandfathered
                                                                                                        rights allowing for vertical integration across all segments of the electricity market

         Key Operating Metrics
     34,035 km Distribution Lines         COP 1,670 Bn RAB                                                                  Regulated revenue subject to revenue cap and five-year tariff review
                                                                                 1.7 TWh                Distribution
                                               (C$ 622M)                                                                    process – No volume risk
             105 Substations                                               Energy Distributed
                                                                                                                            Power retailer for 100% of regulated clients in Boyacá and
                                                                                 915 MVA             Commercialization
                503,000                         573                                                                         44% market share of commercialization segment
            Regulated Clients            Full Time Employees                 220kV/115kV
                                                                                                                            Operator of 790km of national and regional transmission lines and
31                                                                                                     Transmission
                                                                                                                            18 substations; fixed annual revenue for 25 years
Latin America
Additional Growth Opportunities
PPAs
Small Solar PV
Small Hydro
Construction
+ Operations
PPAs
Utilities and
Non-regulated Clients
Utility M&A
Storage
Transmission
32Financial Overview Northland Power 33
2021 Financial Guidance
                                  Adjusted EBITDA and Free Cash Flow

                                       Adjusted EBITDA

                               $1.1 to $1.2
                                     Billion                          8%

                                                                                             Offshore Wind
             Free Cash Flow (incl. growth expenditures)       20%
                                                                       2021E                 Onshore Renewables
                                                                     Adjusted
                           $1.30 to $1.50                             EBITDA                 Efficient Natural Gas

                               Per Share                      12%
                                                                                 60%         Utilities

     Adjusted Free Cash Flow (excl. growth expenditures)

                           $1.60 to $1.70                  New for 2021, Northland plans to report on
                                                           Adjusted Free Cash Flow before all growth-
                               Per Share                              related expenditures

34
Financial Overview
Funding Plan to Support Growth and Maintain Discipline
Identified Development Green and maintain Significant growth in adj. EBITDA
Projects Gross Capital investment grade balance expected on completion of
Investment Plan sheet to support growth Identified Development projects
Next 5 Years1
$15B to BBB X2
$20B+2 (Stable) (Double)
Maintaining flexibility, adding corporate funding tools to diversify sources of capital, preserving low cost of
capital and investment grade balance sheet are key to the successful growth execution of Northland
1. Represents the total gross capital costs of the 4-5 GW visible development projects.
35 2. $10B to $14B net represents Northland’s current ownership interest in Identified Development ProjectsStrong Balance Sheet will Support Growth
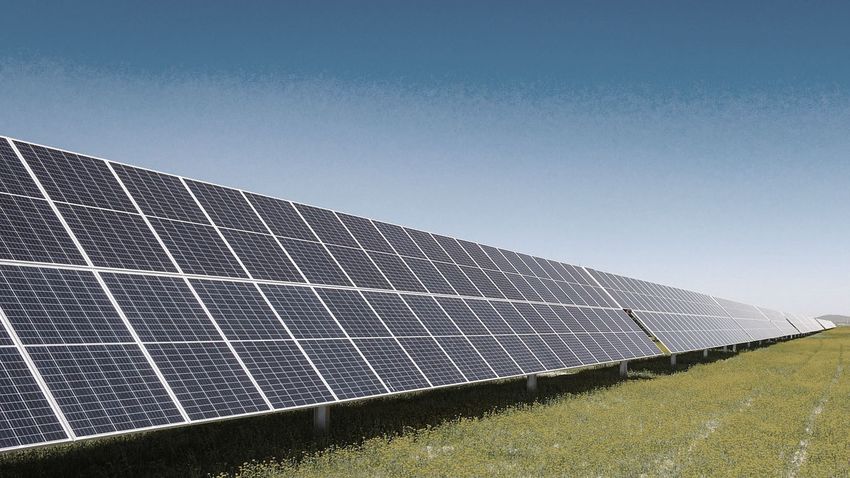
Illustrative Capital Funding Plan of Identified Development Project Over Next Five Years
Illustrative Capital Funding Plan (2021 – 2025)
~$1B ~$2-3B
GREEN CORPORATE DEBT (INCLUDING NORTHLAND COMMON EQUITY + OFFSHORE
REVOLVER/HYBRIDS) WIND SELL-DOWNS
~5% ~15%
~$1-2B
$15-20B+1
CURRENT PROJECT PARTNER’S EQUITY
~10%
~$11-14B
NON-RECOURSE DEBT-
TARGETED GREEN
~70%
1. The capital funding plan is based on recent estimates of total capital costs for Identified Development Projects, that Northland has publicly disclosed. The chart illustrates potential sources of funding that is subject to change/update.
36Green Financing Framework
Adding Financial Optionality to Portfolio
Green Financing Framework allows Northland to diversify and optimize additional sources of capital to fund
growth plan
• Northland has advanced several capital markets initiatives to diversify and Allows the issuance of green debt instruments that benefit from
optimize our sources of capital lower margins and a new pool of investors
• Green the balance sheet
• Increase our available liquidity Green
• Capitalize on strong investor demand Bonds/Loans
& Corporate
• Our Green Financing Framework allows Northland to issue green bonds and Hybrid Bonds
corporate hybrids at any point in the future
• Key benefits:
• Lower cost than traditional unsecured senior debt
• Enhanced ESG positioning Green
• Access to European debt capital markets Project
• Strong Euro base allows to better match tenor and currency Finance
• Very strong demand/subscription levels for green products
• Favourable treatment by lenders and S&P for corporate hybrids
37Adjusted EBITDA Growth Outlook
Identified Projects Alone Expected to Double Adjusted EBITDA
Adjusted EBITDA Growth of Identified Projects
2020A More than doubles
Baltic Power
Nordsee 2/3
Dado
Chiba
Early to Mid-
Stage
Iroquois Falls Development
(PPA Expiry) Hai Long Projects
La Lucha
NY Wind Spain
Portfolio
~$1.17 billion ~$2.5+ billion
38
This chart has been compiled by management for illustrative purposes based on current Identified Development Project forecasts. Adjusted EBITDA reflects Northland’s current ownership interestEvolution of Northland
Key Priorities Over the Next five Years
Leverage Strong Position in Offshore Wind
01 Press strong position in offshore wind by sourcing and advancing large
scale projects as the sector grows and new markets open up
Near-term Growth
02 Secure near-term growth through onshore renewables and Transmission
and Distribution assets in select markets
03 Positioned for New Wave of Global De-carbonization
Targeting further growth from storage and renewable fuels
39Appendix Northland Power 40
Market Summary

                                                                     Key Metrics1

                          Recent Share Price (TSX: NPI)                                                        $41.74
                          Shares (Common)                                                                  225 million
                          Annual Dividend                                                                        $1.20
                          2021 EBITDA Guidance                                                      $1.1 – $1.2 Billion
                          2021 FCF/sh Guidance                                                          $1.30 – $1.50
                          2021 Adjusted FCF/sh Guidance                                                  $1.60 - $1.70
                          Total Debt, Net of Cash2                                                         $6.7 billion
                          Preferred Shares (NPI.PR.A, NPI.PR.B, NPI.PR.C)                                $239 million
                          Market Capitalization (Common)                                                   $9.4 billion
                          Enterprise Value                                                               $15.0 billion
                          Credit Rating (S&P)3                                                             BBB Stable

     1.   Market data as at August 31, 2021 unless stated otherwise.
41   2.
     3.
          As at June 30, 2021 and includes assumed debt from Spain transaction .
          Reaffirmed in March 2021
European Offshore Wind
Facility Details
Gemini Nordsee One Deutsche Bucht
Capacity 600 MW 332 MW 252 MW
Distance to Shore 85km 40km 95km
Wind Turbines 150 x Siemens 4 MW 54 Senvion x 6.15 MW 31 x MHI Vestas 8MW
Turbine Foundation Monopile Monopile Monopile
Water Depth 28m to 36m 26m to 29m 39m to 41m
Total Project Costs €2.8 Billion €1.2 Billion €1.5 Billion
Contract for Differences (CFD)
Revenue Contract Type Feed in tariff Feed in tariff
(FiT-Type)
Revenue Contract Term 15 years ~10 years ~13 years
€194/MWh for 8 years, €184/MWh for 8 years,
~€169/MWh
Revenue Contract Price €154/MWh for 1.5 years €149/MWh for 4.7 years
[No escalation]
[No escalation] [No escalation]
Gemini responsible for connection to Tennet responsible for connection to Tennet responsible for connection to
Grid Connection Responsibility
shore shore shore
NPI Ownership 60% 85% 100%
42Reporting of Non-IFRS Financial Measures
This investor presentation includes references to Northland’s adjusted EBITDA and free cash flow, measures not prescribed by International Financial Reporting Standards (IFRS). Adjusted
EBITDA and free cash flow, as presented, may not be comparable to other similarly-titled measures presented by other publicly-traded companies, as these measures do not have a
standardized meaning under IFRS. These measures should not be considered in isolation or as alternatives to net income, cash flow from operating activities or other measures of financial
performance calculated in accordance with IFRS. These measures are also not necessarily indicative of operating income or cash flows from operating activities as determined under IFRS.
Rather, these measures are provided to complement IFRS measures in the analysis of Northland’s results of operations and are used by management to evaluate the performance of the
company for internal assessment purposes. Management believes that adjusted EBITDA and free cash flow are widely-accepted financial indicators used by investors to assess the
performance of a company. These measures provide investors with additional information to assist them in understanding these critical components of the company’s financial performance,
including its ability to generate cash through its current operations. These measures have been applied consistently for all periods presented in this document.
Adjusted EBITDA
Adjusted EBITDA provides investors with an indication of Northland’s capacity to generate income from operations and investments before taking into account management’s financing
decisions and the costs of consuming tangible and intangible capital assets, which vary according to asset type and management’s estimate of their useful lives.
Adjusted EBITDA is calculated as income (loss) before income taxes adjusted for depreciation of property, plant and equipment, amortization of contracts and other intangible assets, net
finance costs, Gemini subordinated debt earned by Northland, fair value losses (gains) on derivative contracts, unrealized foreign exchange losses (gains), elimination of non-controlling
interests and finance lease and equity accounting.
Free cash flow
Free cash flow is calculated as cash flow provided by operating activities adjusted for net change in non-cash working capital balances, capital expenditures, interest paid, scheduled principal
repayments on term loans, funds set aside for scheduled principal repayments and for asset purchases, restricted cash (funding) for major maintenance, write-off of deferred development
costs, consolidation of managed facilities, income from equity accounted investments, proceeds from sale of assets, and preferred share dividends. This measure, along with cash flow provided
by operating activities, is considered to be a key indicator for investors to understand Northland’s ability to generate cash flow from its current operations.
Readers should refer to our MD&As accompanying our financial statements for an explanation of adjusted EBITDA and free cash flow, and for a reconciliation of Northland’s reported adjusted
EBITDA to its consolidated income (loss) before taxes and a reconciliation of Northland’s free cash flow to its cash provided by operating activities. These are filed from time to time on our
company’s website www.northlandpower.ca.
43Northland Power
Contact US
Northland Power
30 St. Clair Avenue West,
12th Floor
Toronto, ON Canada M4V 3A1
Wassem Khalil
Senior Director Investor Relations & Strategy
4
647.288.1019
Email: investorrelations@northlandpower.com
Website: northlandpower.com
44You can also read