UK Personal & Business Banking Investor Seminar - 24th September 2018 - NatWest ...

Page created by Carrie Scott
 
CONTINUE READING
UK Personal & Business Banking Investor Seminar - 24th September 2018 - NatWest ...
UK Personal & Business
Banking Investor Seminar
24th September 2018
UK Personal & Business Banking Investor Seminar - 24th September 2018 - NatWest ...
Today’s speakers

      Les Matheson                  Frans Woelders              Lloyd Cochrane                 Claire Baird
           CEO                    Chief Digital Officer         Product Director            Finance Director
                                                                 Homebuying &
 Appointed in March 2014      Appointed in May 2018              Ownership            Appointed in June 2018
 Joined RBS in 2010 as        Prior to joining RBS,        Appointed in June 2013    Joined RBS in 2001
  MD of Retail Products &       Frans served as CEO          Prior to joining RBS,     Prior roles include FD for
  Marketing                     Retail Banking at ABN         Lloyd was at Virgin        Services & Functions,
 Prior roles include Group     AMRO                          Money, MD of Mortgage      Director of Global
  Executive at St George       Other ABN AMRO roles          Products at Northern       Finance Services, and
  Bank and CEO for              include Chief Information     Rock as part of the        Head of Global Finance
  Citibank Australia            Officer and Head of           turnaround team.           Services India &
                                Operations                                               Singapore
                                                                                                               2
UK Personal & Business Banking Investor Seminar - 24th September 2018 - NatWest ...
Agenda

         UK Personal & Business Banking Overview – Les Matheson, CEO

         Investing in Digital Capabilities – Frans Woelders, CDO

         Home Buying & Ownership – Lloyd Cochrane, Product Director

         Financial Performance – Claire Baird, FD

Note(s): (1) Except and unless otherwise noted, all financial information in this presentation is for the Royal Bank of Scotland Group plc and prepared on a consolidated basis; (2) UK Personal and Business   3
Banking will be referred to as UK PBB
UK Personal & Business Banking Investor Seminar - 24th September 2018 - NatWest ...
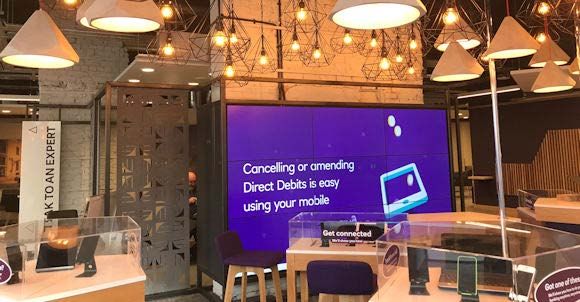
Les Matheson
UK PBB Chief Executive Officer
UK Personal & Business Banking Investor Seminar - 24th September 2018 - NatWest ...
UK Personal & Business Banking
                                                                    1

            Delivering strong                                      Strong market positions,
         sustainable RoE driving                                     established trust and
          the Group to its 2020                                         clear customer
                 targets                     Well positioned in              vision
                                             a rapidly evolving
                                             digital market for
                                                 long term
                      Growing in            sustainable growth         Reduced physical
                   chosen markets                                     footprint, investing
                  while maintaining                                  in digital capabilities
               conservative risk appetite                         and leading digital adoption

Note(s): (1) UK PBB                                                                           5
UK Personal & Business Banking Investor Seminar - 24th September 2018 - NatWest ...
UK PBB Overview
                                                     Customers1                                     Business Areas

                                                                            Personal (P): 17,245k
                                                                            Business (B): 854k
                                                                                                         Personal
                 Scotland                                                                                Deposits
                 P: 11%, B: 13%

                                                                                                         Personal
    Northern Ireland                                                                                     Advances
    P: 4%, B: 5%

                                                                                                        Mortgages

                                                                                                         Business
              England & Wales
              P: 85%; B: 82%
                                                                                                         Banking

        % of total customers
                                                                                                                     6
Note(s): (1) Personal figures as at March 18, Business figures as at January 18
UK Personal & Business Banking Investor Seminar - 24th September 2018 - NatWest ...
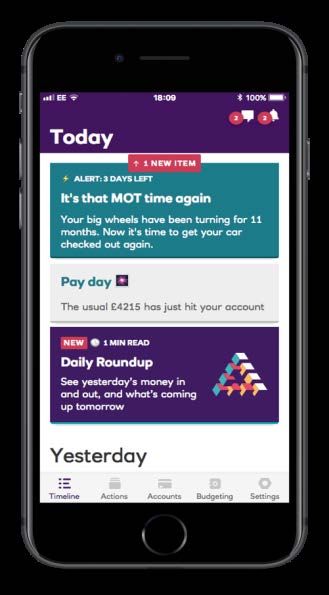
We are driving from a position of strength
                  Business Strength                                                     Customer Growth1                                                          Product Growth
                                                                         New Business Market Share (UK PBB)1                                   UK PBB balance net growth vs market2
             Commercial
                                                                         12mths ending June                                                                                                     RBS           Market
                                                                                                                                                Mortgages
             Growing operating profit                                                         11.4%
                                                                                                                                                                   11.0%
                                                                                                                               10.4%                9.7%
                                                                                9.7% 9.6%
             Steady trajectory on cost                                                                                  9.2%                                                        6.9%
             reduction                                                                                           7.9%
                                                                                                                                                           2.6%           2.8%             3.2%

             Strong and stable RoE                                                                                                                                                                      0.4% 0.9%
                                                                                                                                                     2015             2016            2017          H1 2018

             Customer                                                                                                                           Personal Deposits

                                                                                                                                                                        6.1%        6.4%
             Customer scale and depth                                                                                                               4.9%            4.9%
                                                                                                                                                           3.9%
             of relationship                                                      Premier
                                                                                                                 Established
                                                                                                                                                                                           2.6%
                                                                                                                 Households
                                                                                                                                                                                                        0.8% 1.0%
             Market-leading digital
                                                                                    June ‘16          June ‘17          June ‘18
             adoption
                                                                                                                                                     2015             2016            2017          H1 2018

Note(s): (1) Source: GfK Financial Research Survey (FRS) 12-months ending June 2018/2017/2016. Share of current account new business excluding internal transfers for RBSG in GB; (2) Source: Bank of           7
England; Note:2015 excludes W&G
UK Personal & Business Banking Investor Seminar - 24th September 2018 - NatWest ...
We have made progress on our priorities…
                Customer                                 Simplifying                           Supporting                                   Strength &                                  Employee
               Experience                                 the Bank                         Sustainable Growth                              Sustainability                              Engagement

    Personal NatWest NPS1                          Cost: Income Ratio                    Total loans & advances                          Return on Equity                         Engagement Score2

                                +13                   76%                                                     £163.4bn                                       29%                                        +87
                                                                                           £141.9bn

                                                                          50%                           +15%
              +8
              +8                                                                                                                         14%                                         +78

         H1 2015            H1 2018                  2015             H1 2018                 2015             H1 2018                   2015            H1 2018                 Q1 2015               Q1 2018

Note(s): (1) NatWest NPS; Source: GfK FRS 6 month rolling data Jan to June 2015 and 2018, England & Wales. Latest base size: 3103. Based on the question: "How likely is it that you would recommend          8
NatWest to a relative, friend or colleague in the next 12 months for current account banking?” Base: Claimed main banked current account customers (2) Global Financial Services Norm = +82
UK Personal & Business Banking Investor Seminar - 24th September 2018 - NatWest ...
…while maintaining a low risk profile
        Low income volatility with         Lower proportion of unsecured       Small proportion of SVR
           balanced portfolio                        balances                        mortgages
                                             % Personal balances that are
             % income by portfolio                                            % mortgage balances by type
                                                     unsecured

                                                 8.9%
               Other    1%           1%
                        19%          19%                        7.7%
Business & Commercial

    Personal Deposits   13%          15%

  Personal Unsecured    25%          24%
                                                                            Non-SVR      87%

           Mortgages    42%          41%

                                                                               SVR       13%
                        2015     H1 2018         2015          H1 2018                  H1 2018

                                                                                                            9
UK Personal & Business Banking Investor Seminar - 24th September 2018 - NatWest ...
We have a clear customer focused vision

                                      Help me manage my everyday
                                      banking

                                      Help me manage my short-term
Acting as the gateway to all of our   borrowing
    customers’ financial needs
                                      Help me manage my home buying &
                                      ownership
                                      Help me manage my business

                                                                     10
Digital customer base & capabilities growth
       while reducing our physical footprint…
                                                   Digital growth
                                                                                       Mobile                        Mobile App                        Digital sales in
                                                      6m Mobile
                                                                                     Payments2                         logins                             UK PBB
                                                      App users
                                                                                     up 26% on                       up 20% on                         up 27% on H1
                                                      (H1 2018)1
                                                                                      H1 2017                         H1 2017                               2017

                                                   Physical reduction
                                                       Physical Branches                             Branch counter                                     Cheque usage
                                                       down from ~1,930                               transactions                                      down 16% on
                                                        (2014) to ~8503                            down 7% on H1 20174                                    H1 2017

                 Protect and                                            Lower cost, more resilient,                                                             Better customer
                grow income                                               and better controlled                                                                   experience
Note(s): (1) # Mobile users is all UK PBB; (2) Includes mobile payments and funds transfers; (3) ~1,930 as at end of 2014; ~850 represents branch network by end January 2019; branch numbers include Ulster NI   11
& W&G; (4) Based on volumes from May 2017 to May 2018 and strips out the effect of branch closures
…and delivering market-leading innovation
  into the hands of customers
                                                                     Successfully
                       Leading the way on                         partnered with and
                        AI with our digital                        acquired fintech
                         assistant Cora                               FreeAgent
                          Q1 2017                                    Q1 2018

   H2 2014                                      Q3 2017                                   Q2 2018
First bank in the UK                          Launched the UK’s                           Building new
 to launch TouchID                              first paperless                        ecosystems such as
                                                   mortgage                             our Home Agent
                                                                                           proposition

                                                                                                            12
We are investing in delivering long-term
      sustainable growth…
                                         Customer          Digital                           Strength &
                                                                         Simplification
                                        Propositions     Capabilities                       Sustainability

                                      Innovative digital                 Expansion of
                                                           Building &                       Core Banking

                                                                                                              Future1
                                      propositions using                   Artificial
                                                         connecting to                        Platform
                                        Open Banking                     Intelligence/
                                                          ecosystems                        modernisation
                                            APIs                             Cora

                                                                                                             Previous1
                                          Paperless    Mobile platform Physical footprint    Technology
                                          Mortgage      investments       reduction           resilience

Note(s): (1) Examples of Investment                                                                          13
…and are adapting how we work to remain
competitive
                      Digital first, customer led, agile at scale

                                 Strategy and Innovation
         Home Buying and
           Ownership         Everyday Banking   Short Term Borrowing   Business Banking

                                           Technology
                              Centres of Excellence
               Personal Banking                 Digital Banking

                                            Functions
                                                                                          14
UK Personal & Business Banking
                                                                    1

            Delivering strong                                      Strong market positions,
         sustainable RoE driving                                     established trust and
          the Group to its 2020                                         clear customer
                 targets                     Well positioned in              vision
                                             a rapidly evolving
                                             digital market for
                                                 long term
                      Growing in            sustainable growth         Reduced physical
                   chosen markets                                     footprint, investing
                  while maintaining                                  in digital capabilities
               conservative risk appetite                         and leading digital adoption

Note(s): (1) UK PBB                                                                           15
Frans Woelders
UK PBB Chief
Digital Officer
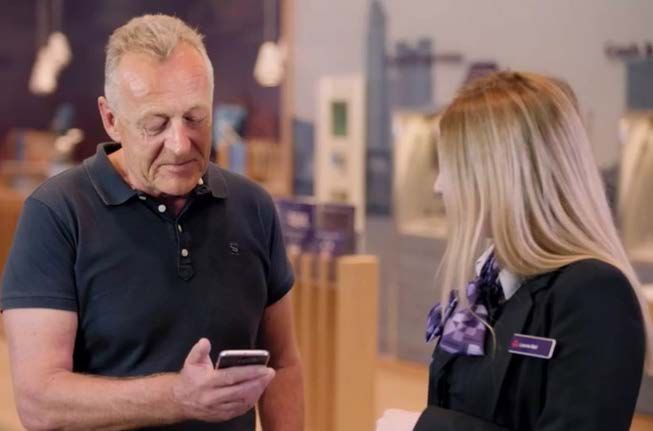
Helping customers adopt digital banking…
 Using data to proactively engage customers across all frontline channels

• Web, mobile and email campaigns to    • >850 TechXperts, minimum of one    • >5m personalised customer insight
  drive adoption and usage                accessible in every branch           prompts displayed in-app every day
• Segment targeted                      • Digital training given to >5,000   • ‘Always on’ product offers reaching
                                          frontline staff                      >2m customers a month with
• In-branch & contact centre customer
                                                                               personalised lending messages
  insight prompts
                                                                             • >35k per month linked product sales
                                                                                                                 17
…and delivering the experience customers want…
       Simplicity and an intuitive user experience are key to adoption and continued digital engagement

                       Drivers of NatWest app advocacy1                                                              We continually refine our app’s user
                                                                                                                     experience:
                                                                                                                     • Clean, uncluttered, easy to understand
                                                                                                                     • Quick access to most used features
                                                                                                                     • In-app help and support
                           19%
                                                                                       Simplicity
                                                                                       Functionality
                                                                                                                     We co-develop app functionality with
                    3%
                                                                                                                     customers and involve them in testing
                                                                                       Speed
                   9%                                                                                                throughout the development lifecycle
                                                            58%                        Easy login
                                                                                       Other
                                                                                                                     Voted by customers the
                      11%                                                                                            Best Banking App
                                                                                                                     2 years running2

Note(s): (1) Sources: sNPS Mobile verbatim analysis, Feb 2018; Mobile sNPS re-contact study, May 2018; (2) NatWest                                              18
…while transforming our assisted channels
                     Adapting to changing customer behaviours                                                                            Adding value in different ways

                             Branch visits1
                40                                                                                                        Testing new
                                     - 26%                                                                                formats and
     Millions

                20                                                                                                        experiences
                                                                                                                           for assisted
                0                                                                                                           self-serve
                          H1 2016               H1 2018                                 97%
                            # of   branches2
    100%                                                                        Transactions
                                                                                and enquiries                                           400k Secure messages per month4
                                                                                through self-
        75%                                                                    serve channels3
                                                                                                                                                    Staff prompts to provide helpful
                                                                                                                                          9m customer insights5
        50%
           2014                   2015       2016            2017
                     Royal Bank      NatWest          UK Average                                                                         45k Customer feedback followed up6

Note(s): (1) Recorded visits based on customer being identified in a NatWest or Royal Bank of Scotland branch; (2) Indexed to 2014; (3) 2017, self service includes online, mobile, ATM and CDM for   19
NatWest and Royal Bank of Scotland; (4) Average for June/July 2018; (5) H1 2018, sales & service; (6) up to end August 2018
More customers are choosing to bank digitally…
                                                                                         1
              Leading the way in mobile adoption                                                                  Meeting more needs through digital channels2

                                                                                                                                                     Branch                    Digital
                                                                                      6.0m
                                                                                                                 Sales                             800
                                                                                                                                                                                      (9%) +38%

                                                                                                                                       Thousands
                                          # mobile app users                                                                                       700
                                                                                                                 volume                            600
                                                                                                                 fulfilled                         500
                4.2m                                                                  >50%
                                                                                                                                                   400
                                                                                                                                                              H1 2016                 H1 2018
                                               Adoption by
                                                customers
               c.35%                                                                                             Funds                                                                        +41%
                                                                                                                                                   200
                                                                                                                 transfer &

                                                                                                                                         Millions
                                                                                                                 3rd party                         100
             H1 2016                                                                H1 2018                      payments                                                             (7%)
                  Mid                       Adoption by                                                                                             0
                 table                  customers vs market                              #1                      volume by
                                                                                                                 channel                                      H1 2016                 H1 2018

Note(s): (1) # Mobile app users is all UK PBB. Adoption by customers is % of NatWest non-dormant current account customers that are mobile active. Internal sources and eBenchmarkers; (2) NatWest and Royal   20
Bank of Scotland; Percentages indicate change in volume over time
…engaging deeply with our brands
       Digital propositions which benefit both customer and bank
                                                         Saving time & money for customers & the bank
                   Mobile active customers vs.                        Pay someone new2
                        non mobile active 1
                                                                                                                                               Branch                  Telephony                  Mobile app

                                                                                                                 Travel time                10-30 mins                         -                            -
                              # of interactions                                     x 6.2
                                                                                                                 Wait time                   0-10 mins                  0-10 mins                           -

                              # of products per                                                                  Transaction                 3.30 mins                  6.29 mins                  0.57 mins
                              customer                                             + 29%                         time

                                                                                                                 Total
                              Brand NPS                                              + 16                        customer
                                                                                                                 time
                                                                                                                                          13-43 mins                  6-16 mins
Aligning customer experience and cost efficiency
       Applying innovative technology to help customers self-serve with confidence

                                                                We are actively exploring extended
                      Cora – our digital assistant,             use cases for Cora, e.g.:
                    powered by artificial intelligence
                                                                •   Answer questions on
                            >500k conversations with                customer transactions
                            customers per month1
                                                                •   Carry out simple transactions
                            Can answer questions on over        •   Voice interface
                            200 topics (and is learning more)       (phone, smart speaker)

                            Helping both Personal and
                            Corporate customers

                            Available in the mobile app
                            as well as online

Note(s): (1) Average of June / July 2018 conversations                                               22
Transforming experience through customer led
       design
                                                                       • Available for all new to bank
                                                                         customers
                           16 questions
                                                                       • Built mobile first, but adaptable
                           (down from 120)
                                                                         to any device or channel
                           6 mins to open                              • End-to-end automation
                           (down from 16)
                                                                       • Piloting instant in-app identity
                           93k accounts                                  verification with partner HooYu
                           opened1
                                                                       • One of the first UK high street
                                                                         banks to provide account
                           100% paperless
                                                                         number at end of every
                           fulfilment2
                                                                         application

Note(s): (1) 2018 YTD volumes (2) For customers that choose to do so                                     23
Strengthening customer relationships
        Customers find managing their financial lives a challenge and want help.
       We are testing two different kinds of solution, harnessing the power of data

         Personal Financial Manager                           Broader Ecosystem

         Data driven financial insights                       Chat-based Al enabled financial
         that are simple to understand                        assistant
         and effortless to act on
         •   Spend categorisation                             •   Pro-active life admin support

         •   Personalised insights                            •   Personalised insight & actions

         •   Personalised product offers                      •   Personalised partner offers and
                                                                  introductions

                                                                                                   24
We are organising around the customer and
positioning ourselves for the future
We are taking advantage of opportunities in a rapidly evolving world

                                                                         We are working with
    Digital first          Quickly identifying        Working with the    FinTechs and are
technology platform          winning bets              right partners    already building our
                                                                              capability
• Open architecture –
  API based                • Customer research            In-house
                             and testing
• Flexible, enables
  modular expansion        • Rapid prototyping

• Simple connectivity,     • Agile design and             Partner
  including 3rd parties      delivery

• Future proof for         • Many candidates;
  emerging                   selected winners             Acquire
  technologies

                                                                                         25
Key messages

    1   Proactive, digital-first journeys designed around the customer

        2    Help more customers do more of their everyday banking digitally

        3    Deepening customer engagement

        4   Reducing cost and growing digital sales and service

        Positioning ourselves to take advantage of opportunities in a rapidly evolving
    5   market

                                                                                         26
Lloyd Cochrane
Product Director, Home
Buying & Ownership
Business performance
       Strong growth but margins under pressure due to increasingly aggressive competitor pricing
        New business flow and stock                                                Stock growth                 Market share1         Competitors2
               movements
                                                                                                                                  0             60% LTV
                                                                                                              H1 2018                       2 Year Fixed
                 ~£32bn ~£31bn                                                                                          11%             Initial Product Cash
                                                                                         £137.4bn                                                 Fee
                                                                                 £136.8bn                                                Rate           Back
 ~£25bn                                                                   £134.0bn
                                       ~£22bn                                                                                   1st     1.70%    £299      £0
                                                                                                              Flow
                       ~£19bn                                                                                                   2nd     1.49%    £995      £0
                                                 ~£14bn
      ~£14bn                                          ~£13bn                                                                    3rd     1.49%    £999      £0

                                                                                                                        10%     4th     1.54%    £995      £0
                                                                                                                                5th     1.54%    £999      £0

      2015            2016            2017         H1 2018                   H1 17         H2 17      H1 18   Stock             6th     1.89%    £995     £1,000
                                                                                                                                7th     1.39% £1,499       £0
              Gross new lending
                                                                                                                                8th     1.65%    £995      £0
              Redemptions                                                                                                       9th     1.96%    £995      £0
                                                                                                                                                          28
Note(s): (1) Source: Bank of England; (2) Source: Defaqto. Rates effective from 17th September 2018
UK PBB Mortgages Overview
                                             Book LTV                                                                                     BTL vs. Owner occupied mix
          >100% 0.3                                                    H1 2018 average                                        FY 2017                                                      H1 2018
                                                                       book LTV
80%
Driving customer advocacy
       Delivering journey improvements through paperless mortgages and digital switching

          UK’s 1st Paperless                                  Increased mortgage                             Reducing application to            Resulting in market
         mortgage application                                 switching via digital                          offer time and delivering      leading NPS for customers
                                                                   channels                                   customer satisfaction           taking a new mortgage3
                                                                          H1 2017

            91% of all organic                                                                                                              NatWest                  32
                                                                          34%
             applications are                               Digital                66%
               paperless1                                                                    Other                Average application       Lender 1            22
                                                                                                                  to offer in 11 days –
                                                                                                                     down from 23           Lender 2           18
                                                                                         +23%
                                                                                                                 Paper vs paperless NPS2
                                                                          H1 2018                                                           Lender 3           16
                                                                                                                  54 79               83
                                                                                                                                 53         Lender 4       9
                                                            Digital 57% 43%
                                                                                                                                            Lender 5   3
                                                                                            Other                  Oct 17        Dec 17
                                                                                                                    Paper       Paperless
                                                                                                                                                                     30
Note(s): (1) H2 to date (2) Source: Operational NPS (oNPS) – December 2017 (3) Source: Strategic NPS (sNPS) survey - May 2018
Video

        31
Managing customer retention
Focussed on customer retention in an increasingly price competitive market
Product development     Ecosystem development       Contact strategy         Pricing
                                                       initiatives

                                                                                       32
Innovation agenda
       Our key areas of focus will position us to thrive in an evolving market context, improving
       customer experience while cutting cost to serve
                                                                                                                      Pursuing a digital first
                                                                                                                      strategy assisted by
     Expanding experience both                                                                                        people when it matters
         before and after a                                                                      Digitisation
     customer gets a mortgage                                                                                                                    Utilising AI and
                                                                                                                                                 robotics to
                                                                                                                                                 increase speed &
                                                   Ecosystem                                                              Automation             efficiency

    Developing next                                              Product                                        Connectivity         Developing APIs1 to
       generation of                                            Flexibility                                                          enable seamless
  mortgage products                                                                                                                  connectivity

                                                                                                                                                              33
Note(s): (1) Application programming interfaces which provide access to 3rd party data and processes
Home Agent
Moving from product and advice towards being a relevant and engaging customer ecosystem
      Thinking of moving                Apply                Move                     Manage and renew
                   Home Agent (current MVP - more upcoming features)                                Post-MVP

                                                                                                          Your Equity

                                                                                                      You have £30,000
                                                                                                       available now

  Set my          Find my next        Apply and         Help me move          Improve my        Track     Manage my
  budget              home            complete                                   home       property value mortgage

 Clear on the role we play in    • Make it easier for the customer to find,   • Gateway to required tools and experts
   the home ecosystem by           buy and manage their home
 looking beyond mortgages                                                     • Track progress and activity so the
  and adding value for our       • Focus on what the customer owns, not         customer knows what to expect and is
         customers                 what they owe                                in control                         34
Key messages

        Established top 4 mortgage lender with ~12% new business share. Targeting
    1   stock growth above market levels while continuing to reduce cost & manage risk

            Driving customer advocacy via high quality customer experience and
        2   service (highest ‘Apply & Set up’ NPS)

             Successful delivery of digital journeys (e.g. Paperless application process
        3    and digitised switching service)

            Innovating to establish UK PBB as a digital Home Buying and Ownership
        4   platform (Home Agent)

    5   Focused on customer retention in an increasingly competitive market

                                                                                           35
Claire Baird
UK PBB Financial Director
UK Economy remains resilient
                                      GDP growing, but very slowly1                                                                    Unemployment at historically low levels1
                        3.5%                                                                                                      9%
     GDP YoY % growth

                                                                    GDP growth

                                                                                                                 % Unemployment
                        3.0%                                                                                                      8%
                                                                    GDP forecast
                        2.5%                                                                                                      7%
                        2.0%                                                                                                      6%

                        1.5%                                                                                                      5%

                        0.0%                                                                                                      0%
                            2012        2014        2016             2018             2020             2022                            2006     2008      2010   2012   2014    2016   2018
                                   Interest rates lower for much longer2                                                                 Housing market continues to grow2
                              6%                                                                                                  Mortgage Market Stock Lending
                                                                    BoE Bank rate                                       £1.6trn
                              4%
                Bank Rate %

                                                                    Market Implied
                                                                                                                        £1.4trn
                              2%
                                                                                                                        £1.2trn
                              0%                                                                                        £1.0trn
                                       2010                2015                      2020                                              2012        2014     2016    2018       2020    2022
Note(s): (1) Sources: U.K. Office for National Statistics (ONS); Moody's Analytics Forecast; (2) Sources: Bank of England; Moody's Analytics Forecast                                    37
Consistently strong financial performance
                                                                                                                 FY                 FY                  FY                  H1
                                                                                                                2015               2016                2017                2018
                                      Income (£m)                                                               6,033              6,127               6477¹
                                                                                                                                                        ,                  3,161

                                      NIM (%)                                                                  3.13%               2.97%              2.86%               2.81%

                                      Costs (£m)                                                              (4,564)             (4,276)             (3,829)            (1,582)

                                      Cost: Income (%)                                                           76%                70%                 59%                 50%

                                      Impairments (£m)                                                            (8)               (125)              (235)               (147)

                                      Operating Profit (£m)                                                     1,461               1,726              2,413               1,432

                                      Gross Loans and Advances (£bn)                                            141.9              154.2               163.0               163.4

                                      Customer Deposits (£bn)                                                   161.9              170.0               180.6               182.2

                                      Risk Weighted Assets (£bn)                                                 43.2               42.3                43.0                43.4

                                      Return on Equity (%)                                                       14%                16%                 24%                 29%

Note(s): Except and unless otherwise noted, all financial information in this presentation is for the Royal Bank of Scotland Group plc and prepared on a consolidated basis; (1) 2017 includes £185m debt sale   38
proceeds
Consistently strong financial performance
       Strong Balance Sheet growth in a competitive environment. C:I ratio continues to improve as we
       simplify the bank
    Above-market loan growth funded by strong deposit growth…                                           …maintaining income levels in a competitive environment…

   Balance Sheet (£bn)                                                                  Growth        Income (£m)            Growth
                                                                                     (2015 – H1 18)                       (2015 -2017)
                                                                                                                                4%       185
 Lending              141.9                  163.0                  163.4                   +15%          Debt sale
 Deposits                                                                                                 Income       6,033          6,292             26
                      161.9                  180.6                  182.2                   +13%                                                      3,135
                        2015                   2017                H1 2018                                             2015            2017          H1 2018
     … while increased digital adoption drives lower physical                                           Delivering positive operating jaws & strong and improving
                    presence and headcount                                                                                        returns
                                                     Growth
 FTE        26.1k         19.8k         18.6k                                                         Expenses (£bn)
                                                  (2015 – H1 18)
 Mobile                                                                                               Operating
                                                      +54%                                                                4.6             3.8
 adoption   3.9m          5.5m          6.0m                                                          expenses                                          1.6
 Branch                                                             1,080                                                2015            2017         H1 2018
                       1,650                  1,330                                         -35%
 numbers                                                                                              RoE¹                                24%
                                                                                                                          14%                          29%
                                               2017                H1 2018                            Cost: Income
                        2015                                                                                              76%             59%          50%
Note(s): (1) Return on Equity presented including Strategic, Conduct and Litigation costs             Ratio                                                     39
Cost Benefits from digital led strategy
       Customer transition from physical to digital supports cost efficiency
    Reduced impact of legacy issues allowing focus on investing for the                                                  Digital adoption has increased resulting in lower branch
                                 future                                                                                         numbers, headcount and lower staff costs…
   Total Operating expenses breakdown (£m)
   C:I ratio                         76%                       59%                        50%                             FTE            26.1k                        19.8k                         18.6k
                                           972                        210                                                                 Branch numbers     Direct staff costs
          Conduct                195                        461                                                                   1,650
                                                                                                                                                 1,330
          Strategic                                                                          4                                         £950m                     1,080
                                    3,397                     3,158                  122                                                               £773m
          Expenses                                                                    1,456                                      1,650 £950m     1,330          1,080 £374m
                                                                                  1,456                                                                                £374m
                                   2015                        2017                  H1 2018                                         2015            2017          H1 2018
                                          Increased levels of digital interactions as branch and telephony transactions decline

                                             Digital growth                         Mobile                         Mobile App                     Digital sales in UK
                                                6m Mobile App                     Payments2                           logins                              PBB
                                                    users                        up 26% on H1                     up 20% on H1                   up 27% on H1 2017
                                                  (H1 2018)1                         2017                              2017
                                             Physical reduction
                                                                                                    Branch counter                                   Cheque usage
                                                 Physical Branches down                              transactions                                   down 16% on H1
                                                  from ~1,930 (2014) to                           down 7% on H1 20174                                    2017
                                                          ~8503
Note(s): (1) # Mobile users is all UK PBB; (2) Includes mobile payments and funds transfers; (3) ~1,930 as at end of 2014; ~850 represents branch network by end January 2019; branch numbers include Ulster   40
NI & W&G; (4) Based on volumes from May 2017 to May 2018 and strips out the effect of branch closures
Short Term Borrowing
       Strong growth in Personal Loans, with digital loans sales up from 38% of total in 2015 to 56% in H1 2018,
       partly offset by lower Credit Card balances as we remain out of the 0% balance transfer market
   Reduced the level of unsecured lending exposure in credit                                            … leading to lower underlying unsecured income as we
        cards with targeted growth in personal loans…                                                         reduce the level of unsecured exposure…
  Balance sheet split (£bn)                       Growth                                              Income split (£m)
                                              (2015 – H1 18)                                                                       1,741
Personal Advances                                                                                                                   185
(Loans & Overdrafts) 6.9       7.1      7.4        +7%                                                  One-off     1,505
                                                                                                       debt sales
Credit cards                            4.4            4.0            4.0
                                                                                          -9%                                       563
                      2015     2017 H1 2018                                                          Credit Cards    666
     …with risk metrics remaining stable and low impairment
                            charges                                                                                                                778
                     5.0%
                                         Impairment Charge as a % of                                                                                26
                     4.0%
                                          Gross Loans and Advances¹                                                                                255
   Personal
   Advances          3.0%                                                                               Personal                    993
                                                                                                                     839
   (Loans &
                     2.0%
                                                                                                        advances
   Overdrafts)                                                                                                                                     497
                     1.0%
    Credit
    Cards            0.0%
                                H1-16          H2-16          H1-17          H2-17          H1-18
Note(s): (1) Calculated as impairment charge / (release) as a % of simple average L&A in the half.
                                                                                                                    2015           2017          H1 2018   41
Mortgage income level maintained
       Mortgage market remains highly competitive with pricing pressure largely offset by strong
       balance growth
                              Intense competition and higher funding rates have led to a contraction in mortgage margins

Indicative product margin¹                            2.20%                               2.00%                               1.93%                               1.89%

Total Income (£m)                                  2,534                                2,560                               2,641
                                                                                                                                                                1,288

                                                     2015                                2016                                2017                              H1 2018
                                                        We continue to make profitable returns on our mortgage book

                                             Return on equity                      Indicative return post additional regulatory requirement 4

                                                   >30%
                                                                               >20%                                               >20%
                                                                                                                                                             >15%

                                                 Q2 2018 Actual total book²                                                    Q2 2018 New business³
Notes(s): (1) Product margin is total mortgage income on spot loans at period end; (2) Book RoE excludes strategic, conduct and litigation costs; (3) New business RoE based on in deal profitability and includes   42
conservative expected impairment losses ~25% - 40% above current observed loss rates depending on LTV position; (4) Indicative return post regulatory uplift with 15% credit RWA of drawn balance.
Strong and disciplined Mortgage growth
       New lending share consistently ahead of stock market share, while maintaining risk discipline
                                 Strong mortgage balance growth while reducing our exposure to higher risk segments…
  Balance Split (£bn)                              Low share of interest only and Buy to Let mortgages
        Interest Only                   Mixed    Other                                                                   Buy to Let          Other
Total                         £115bn            £137bn          £137bn            Total               £115bn          £137bn               £137bn
                                        22%              17%             16%                                   13%             13%                  12%
Split                                    5%              4%               4%      Split

Total stock                    ~9%              ~10%             ~10%             New lending          ~11%            ~12%             ~11%
market Share1                                                                     market Share1                                         £14bn
                                                                                                      £25bn           £31bn
                               2015              2017          H1 2018
                                                                                                       2015            2017            H1 2018
                                                         …while maintaining stable LTV risk profile
                                                    Low concentration of high LTV customers                                     Book avg.
  LTV Split
Deposit funding structure a competitive advantage
                We are well placed to benefit from rising rate environment, with deposits a natural hedge to
                increased mortgage margin pressures
                Strong current account deposit growth has provided an
                                                                                                                             Personal Deposit Income
                               inexpensive funding base
         Total Deposit (£bn)                                                                               Total Personal Deposit Income (£m)
                                                                                                                              Growth
                Personal savings               Personal current                      Business &                            (2015 -2017)
                                               account                               commerical
                                                                                                                                3%
           2015           87                41         34     162                              0.66%
           2017            93                  50           38      181       +13%             0.16%

H1 2018                    93                  50           39      182                        0.27%
                                                                                       Interest Paid %¹
                         Rising rates support deposit income2                                                      817                    841
                                 BoE Bank rate                    Market Implied
                1.5%
  Bank Rate %

                                                                                                                                                        466
                1.0%
                0.5%
                0.0%
                   2016 2017 2018 2019 2020                                2021 2022 2023                          2015
                                                                                                                    2015                  2017
                                                                                                                                           2017        H1
                                                                                                                                                        H1 2018
                                                                                                                                                           2018
Note(s): (1) Third party customer funding rate; (2) Sources: Bank of England; Moody's Analytics Forecast                                                          44
Business Banking
       Lending growth supported by strong deposit base, with strong and improving financial performance
       Lending growth ahead of market supported by very strong                                                            Income improves while keeping the cost base under
                   deposit base with an LDR of 29%                                                                                            control…
    Balance sheet split (£bn)                                            Growth (2015 – H1 18)                      Income (£m)
                                                                                                                                              Growth
                                                                            UK PBB1 Market2                                                (2015 -2017)
 Lending
                      5.3                    6.8                   6.9             +7%           +2%                                                8%

 Deposits            19.6                  23.9                  24.1
                                                                                  +12% +17%
                     2015           2017       H1 2018
                              …and maintaining risk discipline
                                                                                                                                                                   781
         1.0%            Impairment Charge / (Releases) as a % of                                                                 726
         0.8%                  Gross Loans and Advances3
         0.6%
         0.4%
                                                                                                                                                                                                    396
         0.2%
         0.0%                                                                                                                                                                            23.7%
        (0.2%)        H1-16             H2-16             H1-17             H2-17             H1-18
        (0.4%)
        (0.6%)                                                                                                                   2015                              2017                          H1 2018
Notes: (1) UK PBB % growth adjusted for internal transfers; (2) Bank of England outstanding loans to Small and medium sized enterprises and deposits from private non financial institutions; (3) Calculated as   45
impairment charge / (release) as a % of simple average L&A in the half.
Overall financials - Medium Term Outlook
       Loan growth expected to continue to outperform the market, supported by strong funding position.
       Mortgage margin pressures expected to be largely mitigated by improved deposit returns
                                                                                             FY                FY               FY                H1            Medium Term
                                                                                            2015              2016             2017              2018             Outlook²
                       Income (£m)                                                          6,033            6,127            6,477¹            3,161

                       Costs (£m)                                                          (4,564)          (4,276)           (3,829)          (1,582)

                       Cost: Income (%)                                                      76%              70%               59%              50%

                       Impairments (£m)                                                       (8)             (125)            (235)             (147)

                       Operating Profit (£m)                                                1,461             1,726            2,413             1,432

                       Gross Loans and Advances (£bn)                                       141.9            154.2             163.0            163.4

                       Customer Deposits (£bn)                                              161.9            170.0             180.6            182.2

                       Risk Weighted Assets (£bn)                                            43.2              42.3             43.0              43.4

                       Return on Equity (%)                                                  14%              16%               24%              29%
Note: Except and unless otherwise noted, all financial information in this presentation is for the Royal Bank of Scotland Group plc and prepared on a consolidated basis; (1) 2017 includes £185m debt sale
proceeds; (2) Arrows and associated commentary represents management’s current expectations and are subject to change, including as a result of the risk factors described in the Group’s 2017 Report and     46
Accounts and H1 2018 IMS
Key messages

    1   Strong Return on Equity supported by robust pricing and profitability discipline

             Targeted above-market lending growth supported by strong overall
        2    funding position

             Deposit base provides a competitive funding and liquidity advantage and
        3    we are well placed to benefit from a rising rate environment

            Transition from physical to digital supporting simpler customer journeys
        4   resulting in cost efficiency and an improving C:I ratio

        Balanced risk appetite with disciplined risk management supporting stable
    5   default rates and low impairments

                                                                                           47
Questions
Disclaimer

The targets, expectations and trends discussed in this presentation represent management’s current expectations and are subject to change, including as a
result of the factors described in the “Summary Risk Factors” on pages 48 and 49 of the H1 2018 IMS for The Royal Bank of Scotland Group plc (“RBSG”) and
the “Risk Factors” on pages 372 to 402 of the RBSG Annual Report and Accounts 2017.
Forward-looking statements
 This presentation contains forward-looking statements within the meaning of the United States Private Securities Litigation Reform Act of 1995, including (but
not limited to) those related to RBSG and its subsidiaries' regulatory capital position and funding requirements, financial position, ongoing litigation and
regulatory investigations, profitability and financial performance (including financial performance targets and expectations), structural reform and the
implementation of the UK ring-fencing regime, the implementation of RBSG’s restructuring and transformation programme, impairment losses and credit
exposures under certain specified scenarios, increasing competition from new incumbents and disruptive technologies and RBSG’s exposure to political and
economic risks (including with respect to Brexit), operational risk, conduct risk, cyber and IT risk and credit rating risk. In addition, forward-looking statements
may include, without limitation, the words ‘expect’, ‘estimate’, ‘project’, ‘anticipate’, ‘commit’, ‘believe’, ‘should’, ‘intend’, ‘plan’, ‘could’, ‘probability’, ‘risk’,
‘Value-at-Risk (VaR)’, ‘target’, ‘goal’, ‘objective’, ‘may’, ‘endeavour’, ‘outlook’, ‘optimistic’, ‘prospects’ and similar expressions or variations on these expressions.
These statements concern or may affect future matters, such as RBSG's future economic results, business plans and current strategies. Forward-looking
statements are subject to a number of risks and uncertainties that might cause actual results and performance to differ materially from any expected future
results or performance expressed or implied by the forward-looking statements. Factors that could cause or contribute to differences in current expectations
include, but are not limited to, legislative, political, fiscal and regulatory developments, accounting standards, competitive conditions, technological
developments, interest and exchange rate fluctuations and general economic and political conditions. These and other factors, risks and uncertainties that may
impact any forward-looking statement or RBSG's actual results are discussed in RBSG's UK 2017 Annual Report and Accounts (ARA) and materials filed with, or
furnished to, the US Securities and Exchange Commission, including, but not limited to, RBSG's most recent Annual Report on Form 20-F and Reports on Form
6-K. The forward-looking statements contained in this document speak only as of the date of this document and RBSG does not assume or undertake any
obligation or responsibility to update any of the forward-looking statements contained in this document, whether as a result of new information, future events or
otherwise, except to the extent legally required.

                                                                                                                                                                         49
You can also read