Investor Presentation (Q2 2021) - John Iannone Senior Vice President, Investor & Public Relations
←
→
Page content transcription
If your browser does not render page correctly, please read the page content below
Investor Presentation (Q2 2021)
   (WSBC financials as of the three months ended 31 March 2021)

                       John Iannone
    Senior Vice President, Investor & Public Relations
                     304-905-7021
Forward-Looking Statements and Non-GAAP Financial Measures
Forward-looking statements in this report relating to WesBanco’s plans, strategies, objectives, expectations, intentions and adequacy of resources, are made
pursuant to the safe harbor provisions of the Private Securities Litigation Reform Act of 1995. The information contained in this report should be read in
conjunction with WesBanco’s Form 10-K for the year ended December 31, 2020 and documents subsequently filed by WesBanco with the Securities and
Exchange Commission (“SEC”), which are available at the SEC’s website, www.sec.gov or at WesBanco’s website, www.WesBanco.com. Investors are
cautioned that forward-looking statements, which are not historical fact, involve risks and uncertainties, including those detailed in WesBanco’s most recent
Annual Report on Form 10-K filed with the SEC under “Risk Factors” in Part I, Item 1A. Such statements are subject to important factors that could cause actual
results to differ materially from those contemplated by such statements, including, without limitation, the effects of changing regional and national economic
conditions including the effects of the COVID-19 pandemic; changes in interest rates, spreads on earning assets and interest-bearing liabilities, and associated
interest rate sensitivity; sources of liquidity available to WesBanco and its related subsidiary operations; potential future credit losses and the credit risk of
commercial, real estate, and consumer loan customers and their borrowing activities; actions of the Federal Reserve Board, the Federal Deposit Insurance
Corporation, the SEC, the Financial Institution Regulatory Authority, the Municipal Securities Rulemaking Board, the Securities Investors Protection Corporation,
and other regulatory bodies; potential legislative and federal and state regulatory actions and reform, including, without limitation, the impact of the
implementation of the Dodd-Frank Act; adverse decisions of federal and state courts; fraud, scams and schemes of third parties; cyber-security breaches;
competitive conditions in the financial services industry; rapidly changing technology affecting financial services; marketability of debt instruments and
corresponding impact on fair value adjustments; and/or other external developments materially impacting WesBanco’s operational and financial performance.
WesBanco does not assume any duty to update forward-looking statements.

In addition to the results of operations presented in accordance with Generally Accepted Accounting Principles (GAAP), WesBanco's management uses, and
this presentation contains or references, certain non-GAAP financial measures, such as pre-tax pre-provision income, tangible common equity/tangible assets;
net income excluding after-tax restructuring and merger-related expenses; efficiency ratio; return on average assets; and return on average tangible equity.
WesBanco believes these financial measures provide information useful to investors in understanding our operational performance and business and
performance trends which facilitate comparisons with the performance of others in the financial services industry. Although WesBanco believes that these non-
GAAP financial measures enhance investors' understanding of WesBanco's business and performance, these non-GAAP financial measures should not be
considered an alternative to GAAP. The non-GAAP financial measures contained therein should be read in conjunction with the audited financial statements
and analysis as presented in the Annual Report on Form 10-K as well as the unaudited financial statements and analyses as presented in the Quarterly
Reports on Forms 10-Q for WesBanco and its subsidiaries, as well as other filings that the company has made with the SEC.
                                                                                                                                                               1
Evolving Regional Financial Services Institution
Strong market Strong Market Presence in Major Markets
presence across
legacy and major #16 in OH Pittsburgh
metropolitan markets Wheeling
#11 Pgh
Indianapolis MSA
Dayton Columbus
#9 in MD
Morgantown
Balanced loan and Cincinnati
Baltimore
deposit distribution Washington D.C.
#3 in WV
across diverse #11 in KY Huntington
Lexington Park
Charleston
regional footprint Louisville Frankfort
Lexington
Fort Knox
Diversified revenue Broad and Balanced Market Distribution
Loans Deposits
generation engines
supported by unique MD
WV MD
19% 17% WV
long-term advantages 24% 29%
KY
15%
KY
Well-executed long- 14%
OH
IN
IN 26% OH
term growth strategies 5% PA
5% PA 13%
21%
12%
Note: loan and deposit data as of 3/31/2021 (loans exclude Small Business Administration’s Paycheck Protection Program (“SBA PPP”) loans); location data as of 5/1/2021; market 2
share based on 2020 deposit rankings (exclusions: Pittsburgh MSA – BNY Mellon; state of OH – National Consumer Cooperative Bank) (source: S&P Global Market Intelligence)
Investment Rationale
Balanced loan and deposit distribution across footprint
Balanced and Diversified earnings streams built for long-term success, led by
Diversified with century-old, $5.2B trust and wealth management business
Unique Long- Strong presence in economically diverse, major markets
Term Advantages supported by positive demographic trends
Robust legacy deposit base provides pricing advantage
Emphasis on digital capabilities and customer service to ensure
relationship value that meets customer needs efficiently and
Distinct and effectively
Well-Executed
Established lending and wealth management teams
Long-Term
Growth Strategies Focus on positive operating leverage built upon a culture of
expense management, enhanced by consolidated back-office
functions in lower cost markets
Legacy of Credit Well-capitalized with solid liquidity and strong credit quality and
Quality, Risk regulatory compliance
Management, and Seven consecutive “outstanding” CRA ratings since 2003
Shareholder Critical, long-term focus on shareholder return through earnings
Focus growth and effective capital management
3
Note: trust assets under management as of 3/31/2021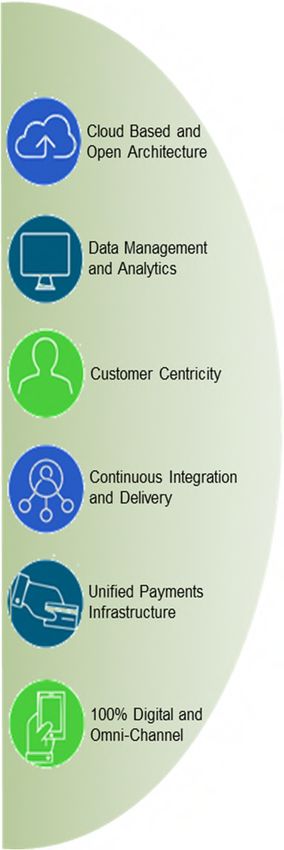
Strategies for Long-Term
        Success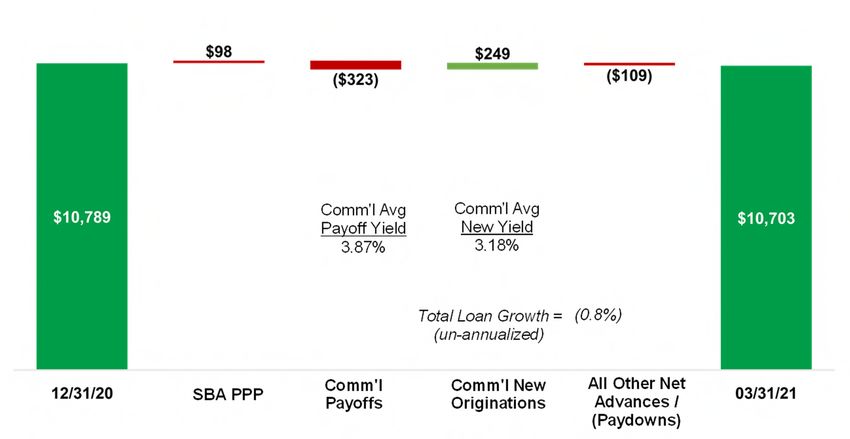
Long-Term Growth Strategies

          Diversified
                                            Digital
            Loan                                          Franchise-
                         Long History      Banking
           Portfolio                                      Enhancing
                          of Strong        Service
          with C&I                                        Expansion
                           Wealth         Strategies
          and Home                                          within
                         Management        & Core
           Lending                                        Contiguous
                         Capabilities      Deposit
            Focus                                          Markets
                                          Advantage

                Focus on Delivering Positive Operating Leverage

       Strong Legacy of Credit Quality, Risk Management, and Compliance

                                                                          5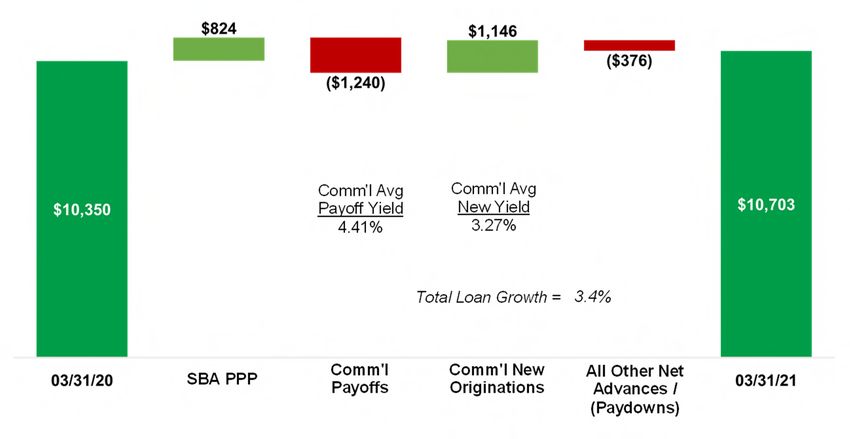
Diversified Loan Portfolio
Focus on strategic diversification, $10.7 Billion Loan Portfolio
growth, and credit quality Commercial
Comm'l R/E: & Industrial
Balance disciplined loan origination Improved
Property
15%
with prudent lending standards 47%
Focus on C&I and home equity lending SBA PPP
8%
Key offerings include treasury Consumer
3%
management, foreign exchange, cyber
HELOC
security, and lockbox services 6%
Comm'l R/E: Land,
Strong residential mortgage program Construction Residential R/E
6% 15%
Average loans to average deposits ratio of 85.3% provides opportunity for
continued loan growth
Low cost of deposits provides a competitive advantage in the typical higher
cost Mid-Atlantic market
Manageable lending exposures
De-emphasized consumer and several CRE categories in recent years
6
Note: loan and deposit data as of quarter ending 3/31/2021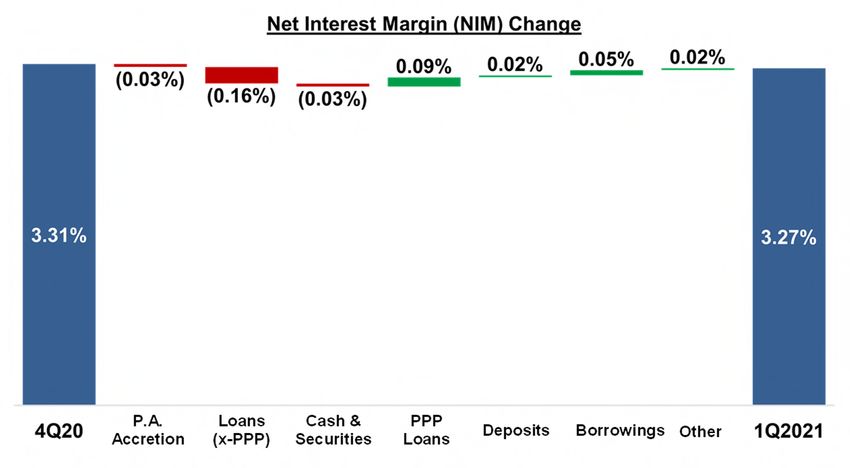
Strong Wealth Management Capabilities
Trust & Investments Insurance
Trust Assets
$5.2B of trust and mutual fund (Market Value as of 12/31) ($B) Personal, commercial, title,
assets under management $4.3
$5.2 health, and life
CAGR
6,000+ relationships $2.3 $2.4
$3.2 4.6% Expand title business in all
Growth opportunities from markets
shale-related private wealth Applied quotation software
2002 2008 2012 2018 2021
management 3/31 utilization (personal)
Expansion opportunities in Third-party administrator (TPA)
KY, IN, and the Mid-Atlantic services for small business
WesMark Funds – six healthcare plans
proprietary funds across
equities, bonds, and tactical
assets
Securities Brokerage Private Banking
Securities investment sales $980MM in private banking
Licensed banker program Private Banking Loans and Deposits
loans and deposits
Investment advisory services
(as of 12/31) ($MM)
3,350+ relationships
Regional player/coach program $770
$980
Growth opportunities from
$540 CAGR
Expand external business $270
37% shale-related private wealth
development opportunities
$100 management
Expansion opportunities in KY, 2013 2015 2017 2019 2021 Expansion opportunities in KY,
3/31
IN, and Mid-Atlantic
Loans Deposits IN, and Mid-Atlantic
7
Note: assets, loans, deposits, and clients as of 12/31/2020; chart financials as of 12/31 unless otherwise stated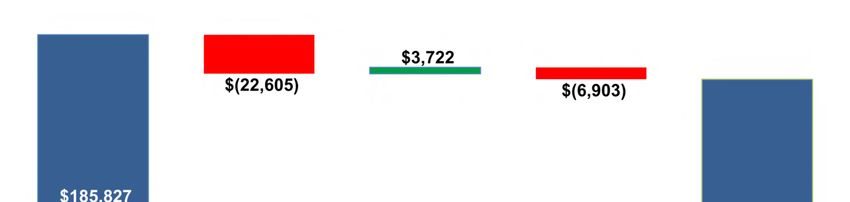
Digital Platforms Drive Engagement & Efficiency
Digital banking utilization
~74% of retail customers utilize online digital banking services
~4.5 million web and mobile logins per month
• Mobile 50% of total, with an average of 17 monthly logins per customer
Mobile wallet & mobile deposits increased 55% & 50% YoY, respectively
Zelle® to be utilized as a payment service beginning 2H2021
Digital acquisition
~50% of residential mortgage applications submitted via online portal
~200 deposit accounts opened per month
WesBanco Insurance Services launched white-label insurance capabilities
with a web-based term-life insurance platform, and a fully-integrated digital
property & casualty insurance for consumers and small businesses
Core upgrade in 2021
Omni-channel presence – real-time account activity across all channels
Improved customer service through reduced manual activities
More efficient processing cost structure
Cloud-based architecture utilization
Early adoption to leverage modernized data and application platforms,
combined with significant expense and performance benefits
Actively harnessing advanced artificial intelligence (AI) and robotic process
automation (RPA) technologies to automate business processes
Note: digital statistics as of 1Q2021; online residential mortgage applications and deposit account opening capabilities launched July 2019; WesBanco Insurance Services online term-life and P&C 8
insurance capabilities launched November 2020 and January 2021, respectively
Benefits of Core Deposit Funding Advantage
Robust legacy deposit base, enhanced by shale energy-related royalties,
provides funding advantage in Mid-Atlantic market
Reflecting the significantly lower interest rate environment, aggressively
reduced deposit rates since March 2020
During the last five years:
Total deposits (excluding CDs) have grown organically at a 11% CAGR
Total demand deposits have grown organically at a 15% CAGR to represent
~57% of total deposits
Avg Deposits as of 3/31/2016 Avg Deposits as of 3/31/2020 Avg Deposits as of 3/31/2021
CDs Non-int
CDs Non-int CDs Non-int 12% Bearing
26% Bearing 18% Bearing DD
DD
DD 33%
21% Total
29%
DD
Savings
40%
18%
Total
Total DD
Int Savings DD 56%
Bearing 18% 50%
DD
19%
Savings Int Money Int
18% Bearing Mkt Bearing
Money 14% DD
Money DD
Mkt 23%
Mkt 21%
16%
14%
Funding Cost Funding Cost Funding Cost
Interest-Bearing = 0.32% Interest-Bearing = 0.55% Interest-Bearing = 0.20%
Total Deposits = 0.25% Total Deposits = 0.39% Total Deposits = 0.14%
[Peer Average Total Deposit Cost = 0.29%] [Peer Average Total Deposit Cost = 0.67%] [Peer Average Total Deposit Cost = 0.21%]
Note: text reflects period-end data and pie charts reflect quarterly averages; peer bank group includes all U.S. banks with total assets of $10B to $25B (as of most recent period) 9
from S&P Global Market Intelligence (as of 5/3/2021) and represent simple averagesFranchise Expansion
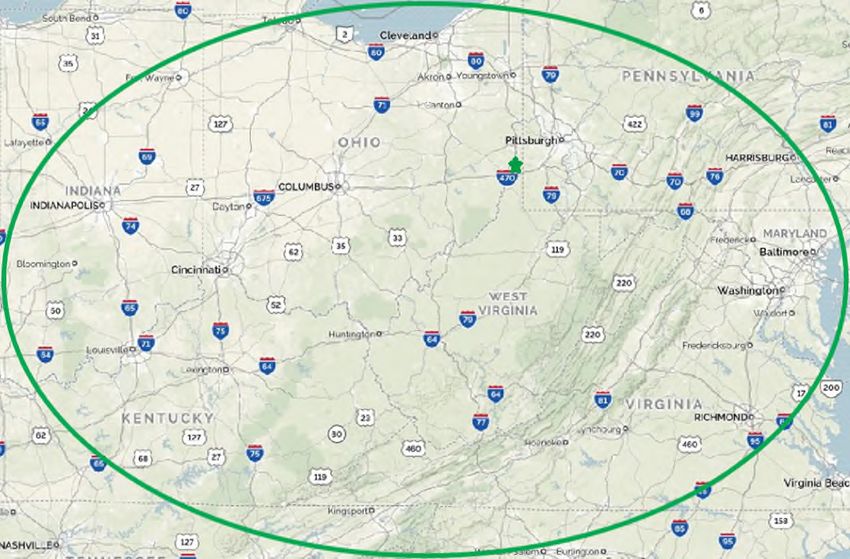
Targeted acquisitions in existing Contiguous Markets Radius
markets and new higher-growth
metro areas
ESB &
FSBI
Long-term focus on appropriate AmTrust
branches
capital management to enhance OAKF
shareholder value OLBK
FFKT FTSB
YCB
Strong capital and liquidity, along
with strong regulatory compliance
processes, provides ability to
execute transactions quickly
Franchise-Enhancing Acquisitions
Diligent efforts to maintain a OLBK: announced Jul-19; closed Nov-19
community bank-oriented, value- FFKT: announced Apr-18; closed Aug-18
FTSB: announced Nov-17; closed Apr-18
based approach to our markets
YCB: announced May-16; closed Sep-16
ESB: announced Oct-14; closed Feb-15
History of successful acquisitions FSBI: announced Jul-12; closed Nov-12
that have improved earnings AmTrust: announced Jan-09; closed Mar-09
OAKF: announced Jul-07; closed Nov-07
10
Note: AmTrust was an acquisition of five branchesFocus on Positive Operating Leverage
Disciplined growth, balanced by a fundamental focus on expense
management and supported by franchise-enhancing acquisitions, in order
to deliver positive operating leverage and enhance shareholder value
Start of
“Durbin Pandemic &
ESB YCB Amendment” Fed Funds
Merger Merger Impact Begun Rate Cut to
Assets Fidelity
(Feb-15) (Sep-16) (Jul-19) 0.0-0.25%
up 218% Merger (Mar-20)
(Nov-12)
Efficiency Ratio
$10B Asset FTSB Merger OLBK
down 410bp Lending & Revenue Threshold (Apr-18) Merger
Diversification Preparations FFKT Merger (Nov-19)
Strategy Begun Begun (Aug-18)
$18.0
60.81% 60.98% 60.99% 62.00%
$17.0
$16.0
$15.0
59.50% 59.59% 60.00%
$14.0
$13.0
$12.0 57.05% 56.69% 56.68% 56.71%
58.00%
$11.0 56.44% 56.38%
$10.0
$9.0 56.00%
$8.0 54.60%
$7.0
$6.0 54.00%
$5.0
$4.0
$3.0 52.00%
$2.0
$1.0 $5.4 $5.5 $6.1 $6.1 $6.3 $8.5 $9.8 $9.8 $12.5 $15.7 $16.4 $17.1
$0.0 50.00%
2010 2011 2012 2013 2014 2015 2016 2017 2018 2019 2020 2021
3/31
Operating
Leverage 9.6x 4.2x 0.7x 1.6x 10.9x 2.2x 1.9x 1.8x 2.5x 1.4x 1.8x 2.2x
Assets ($B) Efficiency Ratio (YTD)
Note: financial data as of 12/31; current year-to-date (YTD) data as of 3/31/2021; balance sheet data as of period ends; Efficiency Ratio presented on a fully taxable-equivalent (FTE) 11
and annualized basis; please see the reconciliations in the appendixStrong Risk Management and Capital Position
Strong legacy of credit and risk management and regulatory compliance
Based upon conservative underwriting standards and approval processes
supported by centralized back-office and loan funding functions
Mature enterprise risk management program headed by Chief Risk Officer
addressing key risks in all business lines and functional areas
Enhanced compliance and risk management system and testing platform
Strong and scalable BSA/AML function
Examined by CFPB for consumer compliance supervision
Seven consecutive “outstanding” CRA ratings since 2003
Strong and improving regulatory capital ratios significantly above
regulatory requirements, and high tangible common equity (TCE) levels
Tier 1 Risk-Based Capital Ratio Tier 1 Leverage Capital Ratio
10.47% 10.59%
13.66% 10.27%
13.41%
12.81% 12.90% 9.85%
12.66% memo 9.56% memo
Well- Well-
Capitalized Capitalized
8.0% 5.0%
14.12% 15.09% 12.89% 14.72% 14.95% Required 10.39% 10.74% 11.30% 10.51% 10.74% Required
6.0% 4.0%
2017 2018 2019 2020 1Q21 2017 2018 2019 2020 1Q21
WSBC $10-25B Banks WSBC $10-25B Banks
Note: capital ratios enhanced by August 2020 issuance of $150MM of preferred stock; effective 4Q2019, as required by the Dodd- Frank Act for financial institutions with total assets
>$15B, Tier 1 Capital Ratios negatively impacted by the movement of ~$130MM of TruPS from Tier 1 to Tier 2 risk-based capital; peer bank group includes all U.S. banks with total 12
assets of $10B to $25B (as of each period) from S&P Global Market Intelligence (as of 5/3/2021) and represent simple averagesRecent Successes and Accolades
Based 100% on customer satisfaction and consumer feedback, WesBanco Bank
was again named, for the third year, one of the World’s Best Banks in an
independent ranking
WesBanco Bank received the America Saves Designation of Savings Excellence
for Banks, a designation from America Saves
For the 11th time since the list’s inception in 2010, WesBanco Bank was named to
the Forbes list of the Best Banks in America – coming in as the 12th best bank
Named to Newsweek magazine's inaugural ranking of America's Best Banks,
recognizing those banks that best serve their customers needs, as well as being
named the Best Big Bank in the state of West Virginia
Bauer Financial again awarded WesBanco their highest rating as a “five-star” bank
The Central Ohio market of WesBanco Bank was awarded a “Top Workplaces”
honor by Columbus C.E.O. magazine for the fifth consecutive year
The Western Pennsylvania market of WesBanco Bank was awarded a “Top
Workplaces” honor by The Pittsburgh Post Gazette for the third consecutive year
The FDIC awarded WesBanco Bank it’s 7th consecutive composite “Outstanding”
rating for its most recent CRA performance
Kroll Bond Rating Agency assigned senior unsecured debt ratings of BBB+ to
WesBanco, Inc. and A- to WesBanco Bank, Inc.
13
Note: Kroll Bond Rating Agency rating report issued 8/4/2020Financial Overview
Q1 2021 Financial and Operational Highlights
Strong growth in pre-tax, pre-provision income Pre-Tax, Pre-Provision Income(1)
$64.2 million, +3.6% YoY
Continued emphasis on expense management
Improving macro-economic factors drove a $28 Net Income Available to Common
million release of provision for credit losses Shareholders and Diluted EPS(1)
$71.3 million; $1.06/diluted share
Key credit quality metrics remained at low levels
and favorable to peer bank averages Efficiency Ratio(1)
56.71%
Positive growth in both loans and deposits
Mortgage banking income increased due to a Mortgage Banking Income
high volume of originations $4.3 million, +234.2% YoY
WesBanco is well-capitalized with solid liquidity Loan Growth
and a strong balance sheet
+3.4% YoY
Recent Board authorized stock repurchase
program, when combined with the remainder of the
previous authorization, represents approximately Deposit Growth (x-CDs)
5% of outstanding shares +28.9% YoY
Note: financial and operational highlights during the quarter ended March 31, 2021; loan growth includes approximately $824 million of loans funded through the Small Business
Administration’s Paycheck Protection Program (“SBA PPP”), as established by the CARES Act 15
(1) Non-GAAP measure – please see reconciliation in appendixQ1 2021 Total Portfolio Loans ($MM)
~7,750 SBA PPP loans totaling
~$824 million (as of 3/31/2021)
During Q1 2021, ~2,330 customers
applied for and received forgiveness
of their 2020 SBA PPP loans totaling
$223 million; and, assisted >3,240
businesses with 2021 SBA PPP
loans totaling ~$344 million
C&I loan levels (x-SBA PPP) were
down year-over-year primarily due to
lower utilization of revolving lines of
credit (~33% vs. ~43% last year)
Q1 2021 residential real estate loan
levels impacted by retaining ~40% of
the $326 million of origination dollar
volume (~57% refi) on balance sheet
Home equity and consumer loan
levels negatively impacted by payoffs
driven by utilization of residential
mortgage refinancing and higher
personal savings
16Q1 2021 Net Interest Margin (NIM)
NIM negatively impacted by the low
interest rate environment
As a result of higher cash balances,
investment securities increased by
$0.9 billion during Q1 2021, mostly
during March
Aggressively reduced deposit rates
throughout the past year
Q1 2021 interest-bearing deposit
funding costs 20bp, or, when
including non-interest bearing
1Q2021 Commercial Loan Portfolio Index Mix
Variable Commercial Loan Repricing
deposits, 14bp
Variable
48 to 60
Rate >60 Months
65%
Months
47% 3% Period-end FHLB borrowings of
$0.4 billion, with remaining average
Fixed life of less than one year, down $1.2
Rate
35% 24 to 48 billion year-over-year
Months
3%
3 to 24
SBA PPP loans benefited Q1 2021Q1 2021 Non-Interest Income
Quarter Ending % H / (L) % H / (L)
Mortgage banking fees increased
due to an ~50% year-over-year
($000s) 03/31/21 03/31/20 12/31/20 increase in 1-to-4 family residential
mortgage origination dollar volume,
Trust fees $7,631 9.8% 13.0% and the associated sale of ~60% of
those into the secondary market
Service charges on deposits 4,894 (26.0%) (13.7%)
Trust fees increased due to equity
Electronic banking fees 4,365 2.6% (1.3%)
market improvement and organic
growth in trust assets
Net securities brokerage revenue 1,524 (9.2%) 8.7% Other income increased due to
higher loan swap-related income,
Bank-owned life insurance 1,709 (3.4%) (2.4%) which was primarily the result of
$2.8 million of fair market value
Mortgage banking income 4,264 234.2% (21.6%)
adjustments in the current period as
compared to a negative $2.8 million
Net securities gains 279 (81.3%) (59.7%)
adjustment last year
Net gain on OREO & other assets 175 3.6% nm Service charges on deposits were
lower due to higher consumer
Other income 8,367 120.1% 27.7% deposits associated with the three
rounds of stimulus to-date and
Total non-interest income $33,208 18.6% 1.5%
lower general consumer spending,
resulting in fewer eligible account
fees
18
Note: OREO = other real estate ownedQ1 2021 Non-Interest Expense
Quarter Ending % H / (L) % H / (L) Total operating expenses remained
well-controlled through company-
($000s) 03/31/21 03/31/20 12/31/20 wide efforts to manage open
positions and certain discretionary
Salaries and wages $36,890 (5.2%) (5.7%)
expenses
Employee benefits 10,266 (1.0%) (3.2%) Efficiency ratio improved 98bp year-
over-year to 56.71%
Net occupancy 7,177 1.3% 6.0% Lower salaries and wages reflect the
recent financial center closures and
Equipment 6,765 12.0% (0.7%)
the management of FTEs
Marketing 2,384 109.5% 42.3%
Anticipated gross cost savings of ~$6
million from closures remain on track
FDIC insurance 1,282 (39.3%) 0.3%
to be fully realized during Q2 2021
Marketing expense was higher due to
Amortization of intangible assets 2,896 (14.2%) (13.0%) increased product advertising and
brand awareness campaigns that
Other operating expenses 17,816 4.0% (0.9%)
were delayed from 2020 due to the
Sub-total non-interest expense $85,476 (0.8%) (2.4%)
COVID-19 pandemic
Q1 restructuring & merger-related
Restructuring & merger-related 851 (83.5%) 75.8% charges related to the financial
center optimization plan that was
Total non-interest expense $86,327 (5.5%) (2.0%)
completed during January 2021
19Comparable Operating Metrics
Disciplined execution upon growth strategies providing strong performance
compared to all U.S. banks with total assets from $10B to 25B
(note: 2020 comparability impacted by timing of the adoption of CECL accounting standard and economic assumptions used by each bank)
Return on Average Tangible Equity Return on Average Assets
1.74%
17.8% 18.4%
1.39% 1.34%
15.1% 1.09%
13.9% 1.34% 1.34% 1.35%
15.5% 0.77%
14.9% 14.6% 1.04%
9.2%
0.89%
11.5% 11.3%
12.2% 16.2% 14.0% 8.6% 18.2% 0.96% 1.26% 1.24% 0.73% 1.72%
2017 2018 2019 2020 2021 (3/31) 2017 2018 2019 2020 2021 (3/31)
WSBC (x- merger & DTA revalue costs) WSBC $10-25B Banks WSBC (x- merger & DTA revalue costs) WSBC $10-25B Banks
Efficiency Ratio Net Interest Margin
3.86% 3.79%
3.71%
57.2% 3.35%
56.1% 3.15%
55.4% 55.2%
54.0%
56.4% 54.6% 56.7% 56.4% 56.7% 3.44% 3.52% 3.62% 3.37% 3.27%
2017 2018 2019 2020 2021 (3/31) 2017 2018 2019 2020 2021 (3/31)
WSBC $10-25B Banks WSBC $10-25B Banks
Note: financial data as of 12/31 YTD; current YTD data as of 3/31/2021; Current Expected Credit Losses (“CECL”) accounting standard adopted January 1, 2020 by WSBC; peer
bank group includes all U.S. banks with total assets of $10B to $25B (as of each period) from S&P Global Market Intelligence (as of 5/3/2021) and represent simple averages
(ROATE & ROAA are S&P calculations; Efficiency & NIM are company-reported); Efficiency & NIM presented on a fully taxable-equivalent (FTE) and annualized basis; please see 20
the reconciliations in the appendixSolid Legacy of Credit Quality
Favorable asset quality measures compared to all U.S. banks with total
assets from $10B to 25B
(note: 2020 ACL comparability impacted by timing of the adoption of CECL accounting standard and economic assumptions used by each bank)
Criticized & Classified Loans as % of Total Loans Non-Performing Assets as % of Total Assets
4.76% 0.89%
3.76% 0.71%
3.16% 0.60% 0.60% 0.57%
2.98% 3.02%
1.17% 1.08% 2.17% 4.59% 4.26% 0.50% 0.35% 0.35% 0.25% 0.23%
2017 2018 2019 2020 2021 (3/31) 2017 2018 2019 2020 2021 (3/31)
WSBC $10-25B Banks WSBC $10-25B Banks
Net Charge-Offs as % of Average Loans (annualized) Allowance for Credit Losses as % of Total Loans
0.22% 0.22%
0.20% 0.20%
1.51% 1.49%
0.13% 0.95% 0.87% 0.80%
0.71% 0.64% 0.51% 1.72% 1.50%
0.13% 0.06% 0.09% 0.06%
0.02% 2017 2018 2019 2020 2021 (3/31)
2017 YTD 2018 YTD 2019 YTD 2020 YTD 2021 (3/31)
WSBC $10-25B Banks WSBC $10-25B Banks
Note: financial data as of quarter ending 12/31; current year data as of 3/31/2021; Current Expected Credit Losses (“CECL”) accounting standard adopted January 1, 2020 by WSBC; 21
peer bank group includes all U.S. banks with total assets of $10B to $25B (as of each period) from S&P Global Market Intelligence (as of 5/3/2021) and represent simple averagesReturning Value to Shareholders
Focus on appropriate capital allocation to provide financial flexibility while
continuing to enhance shareholder value through earnings growth and
effective capital management
Capital management strategy: dividends, share repurchases, acquisitions
Q1 2021 dividend yield 3.5%, compared to 2.2% for bank group
On April 22, 2021, WesBanco’s Board of Directors authorized the adoption of a
new stock repurchase program, which, when combined with the remainder of
the previous authorization, represents ~5% of outstanding shares
Quarterly Dividend per Share ($) Tangible Book Value per Share ($)
$0.33 $22.21
+136% +84%
$12.09
$0.14
4Q10 1Q21 4Q10 1Q21
Note: dividend through February 2021 declaration announcement; WSBC dividend payout ratio based on earnings per share excluding merger-related costs and including impact from
adoption of the Current Expected Credit Losses (“CECL”) accounting standard; WSBC dividend yield based upon 5/3/2021 closing stock price of $37.28; peer bank group includes all 22
U.S. banks with total assets of $10B to $25B (as of most recent period) from S&P Global Market Intelligence (as of 5/3/2021) and represent simple averagesAppendix
Q1 2021 Key Metrics
                                                                 Quarter Ending    H / (L)    H / (L)

                                                                    03/31/21      03/31/20   12/31/20

  Return on Average Assets (1)(2)                                    1.74%         104bp      52bp

  PTPP Return on Average Assets (1)(2)                               1.57%         (1bp)       1bp

  Return on Average Tangible Equity (1)(2)                          18.39%        1,021bp     511bp

  PTPP Return on Average Tangible Equity (1)(2)                     16.78%         (97bp)     (22bp)

  Tangible Book Value per Share ($) (1)                             $22.21         4.0%       2.1%

  Efficiency Ratio (1)(2)                                           56.71%         (98bp)     (35bp)

  Net Interest Margin                                                3.27%         (27bp)     (4bp)

  Non-Performing Assets to Total Assets                              0.23%         (3bp)      (2bp)

  Net Loan Charge-offs to Average Loans (annualized)                 0.02%         (16bp)      0bp

  Note: PTPP = pre-tax, pre-provision
  (1) Non-GAAP measure – please see reconciliation in appendix                                          24
  (2) Excludes restructuring and merger-related expenses
Q1 2021 Current Expected Credit Loss (CECL)
The decrease in the allowance was driven by improvement in the macroeconomic
forecast and changes in portfolio mix slightly offset by COVID-19 pandemic related
adjustments
Allowance coverage ratio of 1.50%, or, excluding SBA PPP loans, 1.62%
Excludes fair market value adjustments on previously acquired loans representing 0.34%
of total portfolio loans
($000s)
Changes in
prepayment
Changes to Qualitative
speeds
macroeconomic adjustments for
variables COVID-19
pandemic, regional Changes in
portfolio mix
Includes changes macroeconomic
in both quantitative factors, and
hospitality industry Changes in
and qualitative
credit quality
economic factors classification loans
Aging of existing
portfolio
Economic Pandemic Portfolio
Factors Qualitative Factors Changes / Other
Note: ACL at 3/31/2021 excludes off-balance sheet credit exposures of $6.7 million; on January 1, 2020, WSBC adopted the CECL accounting standard (prior to this date, the 25
allowance for credit losses was calculated under the incurred method)Reconciliation: Efficiency Ratio & Operating Leverage
Three Months Ending Twelve Months Ending
($000s) 03/31/20 12/31/20 03/31/21 12/31/10 12/31/11 12/31/12 12/31/13 12/31/14 12/31/15 12/31/16 12/31/17 12/31/18 12/31/19 12/31/20
Non-Interest Expense $91,333 $88,069 $86,327 $141,152 $140,295 $150,120 $160,998 $161,633 $193,923 $208,680 $220,860 $265,224 $312,208 $354,845
Restructuring & Merger-Related
($5,164) ($484) ($851) ($175) $0 ($3,888) ($1,310) ($1,309) ($11,082) ($13,261) ($945) ($17,860) ($16,397) ($9,725)
Expense
Non-Interest Expense (excluding
restructuring & merger-related $86,169 $87,585 $85,476 $140,977 $140,295 $146,232 $159,688 $160,324 $182,841 $195,419 $219,915 $247,364 $295,811 $345,120
expense)
Net Interest Income (FTE-basis) $121,346 $120,790 $117,517 $172,235 $175,885 $175,027 $192,556 $200,545 $246,014 $263,232 $300,790 $352,760 $405,222 $483,999
Non-Interest Income $28,009 $32,705 $33,208 $59,599 $59,888 $64,775 $69,285 $68,504 $74,466 $81,499 $88,840 $100,276 $116,716 $128,185
Total Income $149,355 $153,495 $150,725 $231,834 $235,773 $239,802 $261,841 $269,049 $320,480 $344,731 $389,630 $453,036 $521,938 $612,184
Efficiency Ratio 57.69% 57.06% 56.71% 60.81% 59.50% 60.98% 60.99% 59.59% 57.05% 56.69% 56.44% 54.60% 56.68% 56.38%
Net Interest Income (before provision
$120,162 $119,712 $116,478 $166,092 $169,365 $168,351 $185,487 $193,228 $236,987 $253,330 $290,295 $347,236 $399,904 $479,480
expense)(non-FTE)
Non-Interest Income $28,009 $32,705 $33,208 $59,599 $59,888 $64,775 $69,285 $68,504 $74,466 $81,499 $88,840 $100,276 $116,716 $128,185
Total Revenue $148,171 $152,417 $149,686 $225,691 $229,253 $233,126 $254,772 $261,732 $311,453 $334,829 $379,135 $447,512 $516,620 $607,665
YoY Change in Total Revenue $1,515 $2,730 $3,562 $3,873 $21,646 $6,960 $49,721 $23,376 $44,306 $68,377 $69,108 $91,045
YoY Change in Non-Interest Expense
(excluding restructuring & merger- ($693) ($6,856) ($682) $5,937 $13,456 $636 $22,517 $12,578 $24,496 $27,449 $48,447 $49,309
related expense)
Operating Leverage 2.2x 9.6x 4.2x 0.7x 1.6x 10.9x 2.2x 1.9x 1.8x 2.5x 1.4x 1.8x
Note: “efficiency ratio” is non-interest expense excluding restructuring and merger-related expense divided by total income; FTE represents fully taxable equivalent; Old Line Bancshares
merger closed November 2019; Farmers Capital Bank Corporation merger closed August 2018; First Sentry Bancshares merger closed April 2018; Your Community Bankshares merger26
closed September 2016; ESB Financial merger closed February 2015; Fidelity Bancorp merger closed November 2012; AmTrust 5 branch acquisition closed March 2009Reconciliation: Pre-Tax, Pre-Provision Income (PTPP) and Ratios
Three Months Ending
($000s) 03/31/20 12/31/20 03/31/21
Income before Provision for Income Taxes $27,017 $64,557 $91,317
Provision for Credit Losses 29,821 (209) (27,958)
Pre-Tax, Pre-Provision Income ("PTPP") $56,838 $64,348 $63,359
Restructuring and Merger-Related Expense 5,164 484 851
PTPP (excluding restructuring and merger-related expense) $62,002 $64,832 $64,210
PTPP (excluding restructuring and merger-related expense) $62,002 $64,832 $64,210
Average Total Assets 15,784,939 16,546,761 16,636,258
PTPP Return on Average Assets 1.58% 1.56% 1.57%
PTPP (excluding restructuring and merger-related expense) $62,002 $64,832 $64,210
Amortization of Intangibles 3,374 3,327 2,896
PTPP before Amortization of Intangibles (excluding restructuring and merger-related expense) $65,376 $68,159 $67,106
Average Total Shareholders' Equity $2,594,069 $2,744,936 $2,770,416
Average Goodwill and Other Intangibles (net of deferred tax liability) (1,112,327) (1,150,184) (1,148,171)
Average Tangible Equity $1,481,742 $1,594,752 $1,622,245
PTPP Return on Average Tangible Equity 17.75% 17.00% 16.78%
27
Note: Old Line Bancshares merger closed November 2019Reconciliation: Net Income, EPS & Tangible Book Value per Share
Three Months Ending
($000s, except earnings per share) 12/31/10 03/31/20 12/31/20 03/31/21
Net Income Available to Common Shareholders n/a $23,396 $50,210 $70,584
Restructuring and Merger-Related Expense (net of tax) n/a 4,080 383 672
Net Income Available to Common Shareholders (excluding restructuring
n/a $27,476 $50,593 $71,256
and merger-related expense)
Net Income Available to Common Shareholders per Diluted Share ($) n/a $0.35 $0.75 $1.05
Restructuring and Merger-Related Expense (net of tax) n/a 0.06 0.01 0.01
Net Income Available to Common Shareholders per Diluted Share ($)
n/a $0.41 $0.76 $1.06
(excluding restructuring and merger-related expense)
Average Common Shares Outstanding – Diluted (000s) n/a 67,587 67,304 67,335
Total Shareholders's Equity (period-end) $606,863 $2,586,060 $2,756,737 $2,785,522
Goodwill & Other Intangible Assets (net of deferred tax liability)(period-end) (285,559) (1,154,033) (1,149,161) (1,146,874)
Preferred Shareholders' Equity 0 0 (144,484) (144,484)
Tangible Common Equity (period-end) $321,304 $1,432,027 $1,463,092 $1,494,164
Common Shares Outstanding (period-end) (000s) 26,587 67,058 67,255 67,282
Tangible Common Book Value per Share ($) $12.09 $21.36 $21.75 $22.21
28
Note: Current Expected Credit Losses (“CECL”) accounting standard adopted January 1, 2020 by WSBC; Old Line Bancshares merger closed November 2019Reconciliation: Return on Average Assets
Three Months Ending Twelve Months Ending
($000s) 03/31/20 03/31/21 12/31/17 12/31/18 12/31/19 12/31/20
Net Income Available to Common Shareholders $23,396 $70,584 $94,482 $143,112 $158,873 $119,400
Restructuring and Merger-Related Expenses (net of tax) $4,080 $672 $614 $14,109 $12,954 $7,683
Net Income Available to Common Shareholders (excluding restructuring
$27,476 $71,256 $107,876 $157,221 $171,827 $127,083
& merger-related expense)
Average Assets $15,784,939 $16,636,258 $9,854,312 $11,337,379 $12,853,920 $16,442,704
Return on Average Assets 0.60% 1.72% 0.96% 1.26% 1.24% 0.73%
Return on Average Assets (excluding restructuring & merger-related
0.70% 1.74% 1.09% 1.39% 1.34% 0.77%
expense)
Note: Current Expected Credit Losses (“CECL”) accounting standard adopted January 1, 2020 by WSBC; Old Line Bancshares merger closed November 2019; Farmers Capital 29
Bank Corporation merger closed August 2018; First Sentry Bancshares merger closed April 2018; Your Community Bankshares merger closed September 2016Reconciliation: Return on Average Tangible Equity
Three Months Ending Twelve Months Ending
($000s) 03/31/20 03/31/21 12/31/17 12/31/18 12/31/19 12/31/20
Net Income Available to Common Shareholders $23,396 $70,584 $94,482 $143,112 $158,873 $119,400
Amortization of Intangibles (1) $2,665 $2,288 $3,211 $5,514 $8,169 $10,595
Net Income Available to Common Shareholders before Amortization
$26,061 $72,872 $97,693 $148,626 $167,042 $129,995
of Intangibles
Restructuring and Merger-Related Expenses (net of tax) $4,080 $672 $614 $14,109 $12,954 $7,683
Net Income Available to Common Shareholders before Amortization
$30,141 $73,544 $111,087 $162,735 $179,996 $137,678
of Intangibles and Restructuring & Merger-Related Expenses
Average Total Shareholders Equity $2,594,069 $2,770,416 $1,383,935 $1,648,425 $2,119,995 $2,651,402
Average Goodwill & Other Intangibles, Net of Deferred Tax Liabilities ($1,112,327) ($1,148,171) ($584,885) ($732,978) ($927,974) ($1,141,528)
Average Tangible Equity $1,481,742 $1,622,245 $799,050 $915,447 $1,192,021 $1,509,874
Return on Average Tangible Equity 7.07% 18.22% 12.23% 16.24% 14.01% 8.61%
Return on Average Tangible Equity Excluding Restructuring & Merger-
8.18% 18.39% 13.90% 17.78% 15.10% 9.12%
Related Expenses
(1) amortization of intangibles tax effected at 21% for 2018 forward, and 35% for all prior periods
Note: Current Expected Credit Losses (“CECL”) accounting standard adopted January 1, 2020 by WSBC; Old Line Bancshares merger closed November 2019; Farmers Capital 30
Bank Corporation merger closed August 2018; First Sentry Bancshares merger closed April 2018; Your Community Bankshares merger closed September 2016You can also read