Small Business Counts - Small business in the Australian Economy October 2020 - Small Business Counts December 2020
←
→
Page content transcription
If your browser does not render page correctly, please read the page content below

Small Business Counts
 Small business in the Australian Economy
 October 2020

Small Business Counts
December 2020
© Commonwealth of Australia 2020

This publication is available for your use under a Creative Commons BY Attribution 3.0 Australia licence, with
the exception of the Commonwealth Coat of Arms, the Ombudsman logo, photographs, images, signatures
and where otherwise stated.

The full licence terms are available from http://creativecommons.org/licenses/by/3.0/au/legalcode.

Use of Ombudsman material under a Creative Commons BY Attribution 3.0 Australia licence requires you to
attribute the work (but not in any way that suggests that the Ombudsman endorses you or your use of the
work). Ombudsman material used ‘as supplied’.

Provided you have not modified or transformed Ombudsman material in any way including, for example, by
changing the Ombudsman text; calculating percentage changes; graphing or charting data; or deriving new
statistics from published Ombudsman statistics — then Ombudsman prefers the following attribution:

Source: The Australian Small Business and Family Enterprise Ombudsman.

Derivative material

If you have modified or transformed Ombudsman material, or derived new material from those of the
Ombudsman in any way, then the Ombudsman prefers the following attribution:

Based on The Australian Small Business and Family Enterprise Ombudsman data.

Use of the Coat of Arms

The terms under which the Coat of Arms can be used are set out on the It’s an Honour website (see
www.itsanhonour.gov.au).

Contact
Inquiries regarding this licence and any other use of this document can be directed to:

Communications and Media
Australian Small Business and Family Enterprise Ombudsman
02 6213 7410
Media@asbfeo.gov.au

Due care has been exercised in the preparation of this publication. Notwithstanding, the Office of the
Australian Small Business and Family Enterprise Ombudsman, its employees and advisers disclaim all
liability whatsoever, including liability for negligence and for any loss, damage, injury, expense or cost
incurred by any person as a result of accessing, using or relying upon any of the information in this final
report to the maximum extent permitted by law.

  Australian Small Business and Family Enterprise Ombudsman | Small Business Counts | Small business in the Australian Economy
                                                                                                                             2
Contents
Small Business Counts                                                                                                                            1

Foreword                                                                                                                                         4

Overview                                                                                                                                         5

1.         Introduction                                                                                                                          6

2.         Contribution to the economy                                                                                                           7
     2.1    Number of small businesses by employment .................................................................... 7
     2.2    Number of small businesses by turnover .......................................................................... 8
     2.3    Contribution to GDP .......................................................................................................... 8
     2.4    Contribution to employment ............................................................................................ 10
     2.5    Apprentice and trainee employment................................................................................ 13
     2.6    Contribution to tax revenue ............................................................................................. 14

3.         Small business characteristics                                                                                                      17
     3.1    Turnover and net income ................................................................................................ 17
     3.2    Survival over five years ................................................................................................... 17
     3.3    Nano businesses ............................................................................................................ 18
     3.4    Age ................................................................................................................................. 19
     3.5    Women in small business ............................................................................................... 19

4.         Innovative behaviour                                                                                                                21
     4.1    Innovation by activity and size ........................................................................................ 21
     4.2    Innovation and business performance ............................................................................ 21
     4.3    Investment in Research and Development...................................................................... 22
     4.4    Investment by sector ....................................................................................................... 22

5.         Being online                                                                                                                        24
     5.1    Internet usage ................................................................................................................. 24

6.         Exporting                                                                                                                           25
     6.1    By size of business ......................................................................................................... 25

7.         Challenges - COVID-19                                                                                                               26

8.         Challenges - Bushfires                                                                                                              31

 Australian Small Business and Family Enterprise Ombudsman | Small Business Counts | Small business in the Australian Economy
                                                                                                                            3
Foreword

                                                       2020 has been a year like no other in living memory. It has
                                                       also been a year that most of Australia’s 2.3 million small
                                                       businesses would prefer to forget.

                                                       Statistical reports like this one are important because they
                                                       help create a picture of small business in Australia and its
                                                       contribution to our economy.

                                                       This picture is complicated by the fact that we still don’t have
                                                       a consistent definition of small business across government.
                                                       This report uses two primary definitions: a small business is
                                                       one that employs less than 20 people (the ABS definition),
                                                       or that has a turnover under $10 million (the ATO definition)
                                                       and each section is clear on the definition being used.

This year’s report must come with two important qualifiers.

Firstly, because of the lags that are associated with national statistics, much of the data in this report paints a
picture of a past that already feels like a long time ago. A past before the bushfires and before COVID-19.
Bear that in mind as you look at the figures presented. We have included special sections on the impacts of
COVID-19 and the bushfires later in the report, but the analysis is only preliminary and limited by the
availability of data.

Secondly, behind every number in this report is a person. That is true every year, but it’s particularly
important to remember this year. When people talk about small business as the “engine room” of the
Australian economy, they are talking about millions of hard-working Australians. Those Australians have to
overcome obstacles every day to create value for customers, jobs for employees, and community for our
societies.

In 2020, the obstacles were enormous and the true toll of this year on small businesses, including the mental
health toll, won’t be clear for some time. However, it is also true that small businesses have shown this year
that they can be resilient and agile in the face of even the most challenging conditions.

Kate Carnell
Australian Small Business and Family Enterprise Ombudsman

  Australian Small Business and Family Enterprise Ombudsman | Small Business Counts | Small business in the Australian Economy
                                                                                                                             4
Overview
Small business and family enterprise in Australia represent the ‘engine room’ of the economy and the heart
of our community.

Small business accounts for between 97.4% and 98.4% of all businesses, depending on whether you define
a small business based on number of employees or turnover.

Small business contributed almost $418 billion to Gross Domestic Product (GDP) in 2018-19, equivalent to
over 32% of Australia’s total economy. Small business accounts for 76% of value added in the agriculture,
forestry and fishing sector and 74% of value added in the rental, hiring, and real estate services sector. In
terms of value, the largest contribution by small business to GDP is in the construction sector, where it
accounted for $71.3 billion in value added in 2018-19.

Small business employs over 4.7 million people and 41% of the business workforce, making it Australia’s
biggest employer. By sector, small business employment is largest in the construction sector, where it
employed almost 750,000 people in 2018-19. As at December 2019, small business also employed 165,197
apprentices and trainees, which represents 61% of Australia’s apprentices and trainees.

In terms of contribution to tax revenue, Australian Taxation Office (ATO) data shows that small companies
accounted for 22% of total tax revenue from companies in 2017-18.

In terms of profitability, turnover and net income fell for the median small business between 2016 and 2018,
while turnover increased but net income stayed flat for the mean small business over the same period. The
fact that mean turnover increased while mean net income stayed flat suggests that cost pressures are
keeping net incomes low. Small business also continues to have lower survival rates compared to medium
and large business.

40% of small business owners in Australia are aged 45-59 years with a further almost 33% aged 30-44
years. Over 19% of small business owners are over 60 years of age, proving the importance of that age
group to small business and the economy more broadly. Less than 8% are under 30 years of age.

While there is limited data available on women in small business, the available data suggests a steady
upwards trend in the proportion of women small business owners/managers over the last 20 years and an
increase in the number of both full-time and part-time women small business owner/managers.

In terms of innovation, small business makes up 84% of all innovating businesses in Australia. The data
shows that innovative small businesses outperform non-innovative ones on all key metrics, including
productivity and profitability. Small business also comprised 23% of total business research and
development (R&D) spending in 2017-2018, up from 19% in 2016-17.

Small business is increasingly digitally capable. Rates of internet access, web presence, social media
presence, and engagement in e-commerce increased from 2016-17 to 2018-19. However, small business
still lags medium and large business across all these measures of digital adoption.

The number of small businesses exporting merchandise continues to increase, while the share of small
business exporters amongst total exporters remains steady at 59%.

  Australian Small Business and Family Enterprise Ombudsman | Small Business Counts | Small business in the Australian Economy
                                                                                                                             5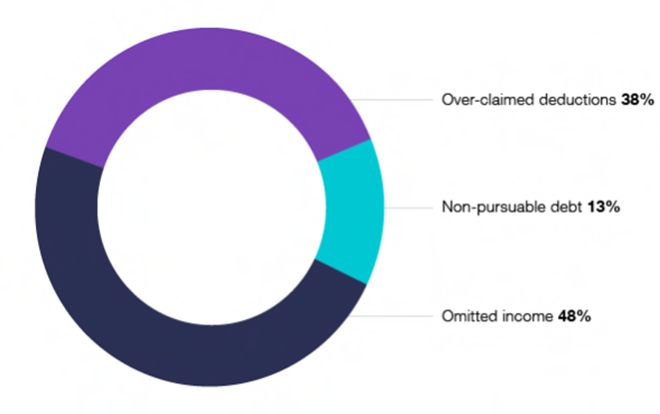
1. Introduction
This report draws from a variety of data sources, both Australian Government and non-government, to
present a statistical picture of the contribution of small business to the Australian economy. Its purpose is to
be an information resource for governments, public policy makers, and researchers to improve their
knowledge and understanding of the small business sector. It does not comment on policy issues.

This report uses two primary definitions of small business. A small business is one that employs less than
20 people (the ABS definition), or that has a turnover under $10 million (the ATO definition). Each section
will provide the definition of small business used in that analysis. Furthermore, unless otherwise stated, the
data will not include very small businesses that have an ABN but are not GST active. The data also
excludes self-managed super funds.

Charts and tables in this report use the Australian and New Zealand Standard Industrial Classification
(ANZSIC), 2006 (Revision 2.0). One of these classifications, ‘Other Services’, requires further explanation.
This classification includes:

        a) ‘Repair and Maintenance’: This includes Automotive Repair and Maintenance, Machinery and
           Equipment Repair and Maintenance, and Other Repair and Maintenance;
        b) Personal and Other Services: This includes Personal care Services, such as Hairdressing and
           Beauty Services, and Diet and Weight Reduction Centre Operations; Funeral, Crematorium and
           Cemetery Services; Religious Services; Civic Professional and Other Interest Group Services; and
        c) Other Personal Services, which includes Laundry and Dry-Cleaning Services, Brothel Keeping and
           Prostitution Services, and Other Personal Services not elsewhere classified; and Private Households
           Employing Staff and Undifferentiated Goods and Service-Producing Activities of Households for own
           use.1

Note that, due to rounding, not all totals of percentages equal 100 per cent.

1
    ANZSIC 2006 Division, Subdivision, Group and Class Codes and Titles, Australian Bureau of Statistics, Accessed October 2020.

     Australian Small Business and Family Enterprise Ombudsman | Small Business Counts | Small business in the Australian Economy
                                                                                                                                6
2. Contribution to the economy
2.1       Number of small businesses by employment

The definition of a small business applied in this section is the ABS definition related to employment (less
than 20 employees).

Small business continues to account for over 97% of all Australian businesses (Table 1). From June 2018 to
June 2019, the number of small businesses increased by over 55,000.

Table 1: Business size measured by employment as at June 2019

 Employees                                                         Firm Count                                        %

 0–19 (small)                                                       2,314,647                                      97.4

 20–199 (medium)                                                      56,835                                        2.4

 200+ (large)                                                          4,271                                        0.2

 Total                                                              2,375,753                                      100.0

Source: ABS Counts of Australian Business 8165.0, Table 13, February 2020 and ASBFEO Calculations (Excludes nano businesses with no GST role)

Most businesses are non-employing businesses (e.g. sole traders), which account for 62.8% of all
businesses (Chart 1). Micro businesses that employ 1-4 people account for a further 25.7% of all
businesses, while the remainder of the small business category is comprised of businesses that employ 5-19
people, which account for 8.9% of all businesses.

Chart 1: Counts of Australian businesses measured by employment size as at June 2019

                                      Business count by number of employees
                                                              2.4%             0.2%

                                                            8.9%                                                   0 (non-employing)
                                                                                                                   1–4 (micro)
                                            25.7%
                                                                                                                   5–19 (small)
                                                                                    62.8%                          20–199 (medium)
                                                                                                                   200+ (large)

Source: ABS Counts of Australian Business 8165.0 Table 13, Feb 2020 and ASBFEO calculations (excludes nano businesses)

   Australian Small Business and Family Enterprise Ombudsman | Small Business Counts | Small business in the Australian Economy
                                                                                                                              7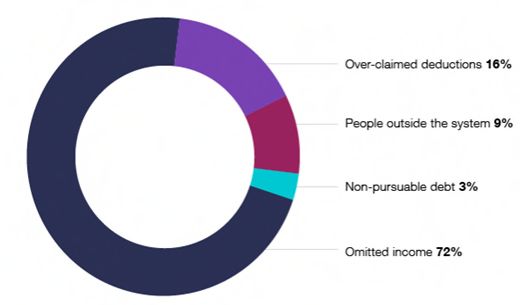
2.2       Number of small businesses by turnover

The definition of a small business applied in this section is the ATO definition related to turnover (turnover of
$10 million or less).

Using this definition, 98.4% of Australian businesses are small businesses. The vast majority (93%) of these
businesses have a turnover of less than $2 million. It is worth noting that, as businesses are not required to
register for GST unless their current or projected turnover is $75,000 or more, and businesses not registered
for GST are not captured in this data, the number of businesses listed in the $0-$50k turnover range is likely
an underestimate.

Table 2: Business numbers by annual turnover in 2018-19
                    Turnover                                        No. of businesses                                     %

               $0 to less than $50k                                        592,896                                       25.0

             $50k to less than $200k                                       810,470                                       34.1

             $200k to less than $2m                                        806,248                                       33.9

              $2m to less than $5m                                         95,032                                         4.0

             $5m to less than $10m                                         33,643                                         1.4

                  $10m or more                                             37,464                                         1.6

                        Total                                            2,375,753                                       100.0

Source: ABS Counts of Australian Business 8165.0, Table 17, Feb 2020 and ASBFEO calculations (excludes nano businesses with no GST role)

2.3       Contribution to GDP

Value added is the contribution to Australian Gross Domestic Product (GDP), which is the total value of all
the final goods and services produced in the Australian economy in a year. Small business contributed
almost $418 billion of value added in 2018-19, which represents over 32% of Australia’s total GDP (Table 3).

Table 3: Value added by business size from FY15 to FY19

  Value added by Business size                2014-15              2015-16              2016-17              2017-18              2018-19

                                                $m                    $m                   $m                   $m                   $m

           Small Business                     375,811              378,400              393,219              413,929              417,946

          Medium Business                     230,601              236,547              250,519              260,971              287,441

           Large Business                     463,512              468,918              490,991              534,065              583,893

                Total                        1,069,924            1,083,865            1,134,730            1,208,964            1,289,280

Source: ABS Counts of Australian Business 8155.0, Table 5, May 2020 and ASBFEO Calculations

   Australian Small Business and Family Enterprise Ombudsman | Small Business Counts | Small business in the Australian Economy
                                                                                                                              8
As well as the significant contribution to total value added, small business adds more value than any other
size of business in the following sectors (Table 4):
- Agriculture, forestry and fishing (76% of total)
- Rental, hiring and real estate services (74% of total)
- Construction (56% of total)
- Other services (56% of total)
- Professional, scientific and technical services (42% of total)
Table 4: Small business share of the total value added by industry 2018-19
Small Business
Industry sector Small Medium Large All
share
$m $m $m $m %
Agriculture, forestry and fishing 23,964 5,555 1,907 31,425 76%
Rental, hiring and real estate services 61,733 9,354 11,986 83,072 74%
Construction 71,310 27,386 29,307 128,003 56%
Other services 19,124 10,044 5,253 34,420 56%
Professional, scientific and technical services 56,798 36,037 42,910 135,745 42%
Health care and social assistance (private) 36,261 19,568 41,447 97,275 37%
Accommodation and food services 15,023 17,056 11,197 43,275 35%
Retail trade 20,418 17,539 40,969 78,927 26%
Transport, postal and warehousing 19,503 13,801 46,479 79,782 24%
Wholesale trade 16,689 25,275 28,335 70,300 24%
Arts and recreation services 3,400 4,486 7,015 14,901 23%
Manufacturing 24,710 32,140 55,420 112,271 22%
Administrative and support services 13,383 20,149 33,753 67,285 20%
Public administration and safety (private) 1,217 2,021 3,239 6,477 19%
Education and training (private) 5,533 9,825 15,397 30,756 18%
Mining 19,794 25,125 142,212 187,131 11%
Electricity, gas, water and waste services 5,295 6,597 39,522 51,414 10%
Information Media and Telecommunications 3,791 5,483 27,545 36,819 10%
Total selected industries 417,946 287,441 583,893 1,289,280 32%
Source: ABS Catalogue No. 8155.0 Australian Industry Table 5 2018-19, May 2020 and ASBFEO Calculations
Australian Small Business and Family Enterprise Ombudsman | Small Business Counts | Small business in the Australian Economy
9In dollar terms, the largest contributions by small business to GDP are in the following sectors (Chart 2):
- Construction ($71.3 billion);
- Rental, hiring and real estate services ($61.7 billion); and
- Professional, scientific and technical services ($56.8 billion).
Chart 2: Industry value added by business size 2018-19 ($ million)
Industry value add by business size
Construction
Rental, hiring and real estate services
Professional, scientific and technical services
Health care and social assistance (private)
Agriculture, forestry and fishing
Retail trade Small
Manufacturing
Transport, postal and warehousing Medium
Industry
Other services
Administrative and support services Large
Accommodation and food services
Wholesale trade
Mining
Electricity, gas, water and waste services
Education and training (private)
Information Media and Telecommunications
Arts and recreation services
Public administration and safety (private)
0 50,000 100,000 150,000 200,000
$ million
Source: ABS Catalogue No. 8155.0 Australian Industry Table 5 2018-19, May 2020 and ASBFEO Calculations
2.4 Contribution to employment
While the number of people employed by small business fell slightly from 2017-18 to 2018-19, small
business still employed over 4.7 million people and 41% of the business workforce in 2018-19, making it
Australia’s biggest employer (Table 5 and Chart 3).
Table 5: Employment by business size
Size 2014-15 2015-16 2016-17 2017-18 2018-19
('000) % ('000) % ('000) % ('000) % ('000) %
Small 4,739 45 4,731 44 4,768 44 4,940 44 4,718 41
Medium 2,495 24 2,489 23 2,616 24 2,694 24 2,919 25
Large 3,378 32 3,458 32 3,498 32 3,544 32 3,871 34
Total 10,612 101 10,678 99 10,882 100 11,177 100 11,508 100
Source: ABS Catalogue No. 8155.0 Australian Industry Table 5 2018-19, May 2020 and ASBFEO Calculations. Note rounding means that not all totals
equal 100 per cent.
Australian Small Business and Family Enterprise Ombudsman | Small Business Counts | Small business in the Australian Economy
10Chart 3: Employment by business size
Employment by business size
14,000,000
12,000,000
10,000,000
Employees
8,000,000
Large
6,000,000 Medium
Small
4,000,000
2,000,000
0
2014-15 2015-16 2016-17 2017-18 2018-19
Year
Source: ABS Catalogue No. 8155.0 Australian Industry Table 5 2018-19, May 2020 and ASBFEO Calculations
Small business is a particularly significant employer in the following industries (Table 6 and Chart 4):
- Agriculture, forestry and fishing (small business employs 359,000 people, representing 80% of total
employment in the sector);
- Rental, hiring and real estate services (small business employs 314,000 people, representing 75% of
total employment in the sector);
- Construction (small business employs 748,000 people, representing 67% of total employment in the
sector);
- Other services (small business employs 321,000 people, representing 62% of total employment in the
sector);
- Professional, scientific and technical services (small business employs 560,000 people, representing
48% of total employment in the sector);
- Accommodation and food services (small business employs 452,000 people, representing 44% of total
employment in the sector);
- Transport, postal and warehousing (small business employs 267,000 people, representing 43% of total
employment in the sector); and
- Wholesale trade (small business employs 197,000 people, representing 35% of total employment in the
sector).
Australian Small Business and Family Enterprise Ombudsman | Small Business Counts | Small business in the Australian Economy
11Table 6: Employment by industry, ordered by small business proportionate share – 2018-19
Small Medium Large All Small Business
Industry Sector
(‘000) (‘000) (‘000) (‘000) share (%)
Agriculture, forestry and fishing 359 66 26 451 80
Rental, hiring and real estate services 314 60 43 417 75
Construction 748 205 165 1,117 67
Other services 321 132 61 514 62
Professional, scientific and technical services 560 309 286 1,155 48
Accommodation and food services 452 332 247 1,031 44
Transport, postal and warehousing 267 101 253 620 43
Wholesale trade 197 193 167 557 35
Manufacturing 277 290 287 854 32
Arts and recreation services 69 68 80 216 32
Administrative and support services 258 251 445 954 27
Health care and social assistance (private) 356 348 615 1,319 27
Retail trade 345 328 658 1,331 26
Information media and telecommunications 41 31 95 167 25
Education and training (private) 104 136 189 430 24
Public administration and safety (private) 16 23 42 82 20
Electricity, gas, water and waste services 18 20 76 113 16
Mining 14 28 136 179 8
Total selected industries 4,716 2,919 3,871 11,508 41
Source: ABS Catalogue No. 8155.0 Australian Industry Table 5 2018-19, May 2020 and ASBFEO Calculations
Australian Small Business and Family Enterprise Ombudsman | Small Business Counts | Small business in the Australian Economy
12Chart 4: Total employment by industry ranked by number of employees, 2018-19
Employment by industry
Construction
Professional, scientific and technical services
Accommodation and food services
Agriculture, forestry and fishing
Health care and social assistance (private)
Retail trade
Other services
Rental, hiring and real estate services
Industry
Manufacturing
Small
Transport, postal and warehousing
Administrative and support services Medium
Wholesale trade Large
Education and training (private)
Arts and recreation services
Information media and telecommunications
Electricity, gas, water and waste services
Public administration and safety (private)
Mining
0 200 400 600 800 1,000 1,200 1,400
'000s of employees
Source: ABS Catalogue No. 8155.0 Australian Industry Table 5 2018-19, May 2020 and ASBFEO Calculations
2.5 Apprentice and trainee employment
Small business employed 165,197 apprentices and trainees as at December 2019. This makes small
business the largest employer of apprentices and trainees, representing 61% of the total (Chart 5). As part
of the 2020 budget the Australian Government announced the Boosting Apprenticeship Commencements
wage subsidy for new apprentices and trainees, which is expected to support 100,000 new apprenticeships
between October 2020 and September 2021. Based on current proportions, 61,000 of these will be
employed by small business.
Chart 5: Apprentices and trainees by employer size, in training Oct - Dec quarter 2019
Proportion of apprentices and trainees in training by business size
Medium
17%
Large
20%
Small
61%
Not known
2%
Source: VOCSTATS Apprentice and Trainee Collection , extracted on 07/09/2020.
Note: Changes in classification of data from VOCSTATS has resulted in a reduced number of “not known” business sizes.
Australian Small Business and Family Enterprise Ombudsman | Small Business Counts | Small business in the Australian Economy
13Chart 6 shows the small business share of apprentice and trainee employment across a range of sectors.
Small business accounts for over 75% of all apprentices and trainees in the rental, hiring and real-estate
services sector and the construction sector.
Chart 6: Apprentice and trainee employment by industry proportionate share, Oct – Dec quarter 2019
Rental, Hiring and Real Estate Services (L)
Construction (E)
Other Services (S)
Agriculture, Forestry and Fishing (A)
Professional, Scientific and Technical Services…
Manufacturing (C)
Health Care and Social Assistance (Q)
Arts and Recreation Services (R)
Small
Accommodation (H)
Retail Trade (G) Medium
Information Media and Telecommunication (J) Large
Electricity, Gas, Water and Waste Services (D)
Not known
Wholesale Trade (F)
Education and Training (P)
Transport, Postal and Warehousing (I)
Administrative and Support Services (N)
Financial and Insurance Services (K)
Mining (B)
Public Administration and Safety (O)
0% 25% 50% 75% 100%
Source: VOCSTATS Apprentice and Trainee Collection , accessed on 7 September 2020.
2.6 Contribution to tax revenue
Table 7 shows that small companies accounted for 22% of total tax revenue from companies in 2017-18.
This share decreased from 24% in 2015-16.
Table 7: Company tax revenue by business size
Business size classed by 2015-2016 2016-2017 2017-2018
revenue $m % $m % $m %
Small ($1 - < $10m) 16,239 24 16,988 22 18,320 22
Medium ($10m - < $100m) 10,158 15 10,832 14 11,788 14
Large ($100m or more) 40,219 60 47,764 63 54,747 65
Total 66,616 99 75,584 99 84,855 101
Source: ATO, Taxation Statistics 2017-18, Snapshot Table. Note rounding means that not all totals equal 100 per cent.
Table 8 shows that, for small businesses up to $5 million turnover, half of all income tax is paid by those
businesses with turnover between $200,000 and $2 million. These businesses also account for 71% of GST
paid.
Australian Small Business and Family Enterprise Ombudsman | Small Business Counts | Small business in the Australian Economy
14Table 8: Key numbers by annual turnover in 2017-18
%. of small % income tax paid by % net GST paid by
Turnover Financial Year 2018
businesses small business small business
$0 to less than $50k 25 11 1
$50k to less than $200k 40 38 26
$200k to less than $2m 35 50 71
$2m to less than $5m 1 2 2
Source: ATO sample datasets for 2017-18 and ASBFEO calculations (excludes nano businesses with no GST role). Note rounding means that the
percentage total does equal 100 per cent.
The ATO also calculates ‘tax gaps’ for specific categories of taxpayers and for the different types of tax
revenue. The tax gap represents the difference between the actual tax revenue the ATO collects and an
estimation of what would be collected if every taxpayer was fully compliant with the law.2 The ATO reports a
tax gap where it believes taxpayers have misreported, which could be due to an error or misunderstanding,
taking a tax position that differs from the ATO position, or by choice. It should be noted that the calculation
includes non-pursuable debt (e.g. a business in liquidation without sufficient assets to pay its tax debt) and
concealed income from unreported activity in the shadow economy, which can only ever be estimated.
For 2017–18 the ATO calculated the net income tax gap for the small business population to be $11.1 billion
or 11.5% of ‘total theoretical tax payable’.3 This means the ATO estimates that small business paid more
than 88% of the total theoretical tax payable in 2017–18. It is also important to note that, in percentage
terms, the small business tax gap has been getting smaller.
The main components of the small business income tax gap are:
- omitted income;
- over-claimed deductions;
- people outside the tax system, e.g. cash-only businesses operating without an Australian business
number (ABN); and
- non-pursuable debt, i.e. debt that is not economical for the ATO to pursue.
Charts 7-9 show the make-up of the small business income tax gap for small companies, individuals in
business, and for the combination of these two categories. For individuals, omitted income accounts for
almost three-quarters of the total tax gap and ‘people outside the system’ accounts for almost 10%. By
comparison, omitted income (48%) is less significant for companies, while over-claimed deductions (38%)
and non-pursuable debt (13%) account for a greater share.
2
‘Australian tax gaps – overview’, ATO webpage, October 2020
3
‘Small business income tax gap’, ATO webpage, October 2020
Australian Small Business and Family Enterprise Ombudsman | Small Business Counts | Small business in the Australian Economy
15Chart 7: Small business income tax gap for Chart 8: Small business income tax gap for
individuals in business small companies
Source: ATO, ‘Small business income tax gap’ webpage, October 2020 Source: ATO, ‘Small business income tax gap’ webpage, October 2020.
The combined group, shown in Figure 9, is dominated by individuals and so presents similarly to Figure 7.
Chart 9: Small business income tax gap for combined categories
Source: ATO, ‘Small business income tax gap’ webpage, October 2020.
Australian Small Business and Family Enterprise Ombudsman | Small Business Counts | Small business in the Australian Economy
163. Small business characteristics
3.1 Turnover and net income
Turnover increased for the mean small business but decreased for the median small business between 2016
and 2018 (Table 9). This suggests that some high turnover small businesses have lifted the mean but that
turnover for the ‘average’ small business has actually fallen.
Net income fell for the median small business and stayed flat for the mean small business over the same
period. The fact that mean turnover increased while mean net income stayed flat suggests that cost
pressures are keeping net income low.
Table 9: Key business metrics
Small Business
Financial Year 2016 Financial Year 2018
Median ($) Mean ($) Median ($) Mean ($)
Turnover 122,000 227,000 118,000 245,000
Net Income 15,000 24,000 13,000 24,000
Source: ATO, Taxation Statistics 2017-18, Snapshot Table
3.2 Survival over five years
Looking at the survival of businesses over a four-year period shows that larger businesses generally survive
for longer (Table 10). Non-employing businesses have the lowest survival rate at 60%, which is less than
the average survival rate of 65% and did not change from the previous period of June 2014 to June 2018.
Table 10: Business survival rates from June 2015 to June 2019
Survival rate
Employment Size Businesses June 2015 Survived to June 2019
%
Non-employing 1,284,615 772,711 60
1–4 Employees 584,744 405,838 69
5–19 Employees 197,164 152,968 78
20–199 Employees 50,995 41,931 82
200+ Employees 3,717 3,220 87
Total employing 836,620 603,957 72
Total 2,121,235 1,376,668 65 (Average)
Source: ABS Counts of Australian Business 8165.0, Table 15, Feb 2020 and ASBFEO Calculations (excludes nano businesses with no GST role)
Australian Small Business and Family Enterprise Ombudsman | Small Business Counts | Small business in the Australian Economy
173.3 Nano businesses
The ABS defines a business as a legal entity engaging in productive activity, with “productive activity” being
where the entity is registered for and remitting GST through Business Activity Statements (BAS).4 As the
compulsory threshold for GST registration is $75,000 turnover, the ABS definition does not capture very
small businesses. The ATO does collect information on these businesses, which we have called ‘nano
businesses’ in previous reports. In this year’s report, we look at the key characteristics of these small
businesses and how different definitions change the statistical picture.
Businesses that are not remitting GST will generally have turnover under the $75,000 threshold. These very
small businesses are also less likely to have employees. For these reasons, we look at three different
definitions and key business metrics of turnover and net income across each. The definitions are:
Definition 1: Less than $75,000 turnover.
Definition 2: Less than $75,000 turnover AND no employees.
Definition 3: Less than $75,000 turnover AND no employees AND zero net GST remitted.
Definition 3 is a subset of definition 2, which is in turn a subset of definition 1. Table 11.3 shows how the
number of businesses included falls from definitions 1 to 3.
What is common across the three definitions is that mean and median turnover has been falling over time,
while mean and median net income has been falling or flat depending on the definition.
In terms of differences, we can see that turnover falls between definition 1 and 2 and again between
definition 2 and 3. This means that, for businesses with less than $75,000 turnover, having employees and
remitting GST is associated with higher turnover, which is not surprising.
What is surprising is that, while turnover falls reading down the table from definition 1 to 3, mean and median
net income in 2016 actually increased from definition 1 to 3. Although the same pattern was not as clear in
the 2018 data, the fact that turnover and net income were inversely related in 2016 most likely relates to a
movement to sole (small) independent contractors with larger deductions for contractor expenses.
Table 11: Number of businesses by definition
Definition Financial Year 2016 Financial Year 2018
Definition 1 n = 4,927 n = 5,343
Definition 2 n = 4,746 n = 5,123
Definition 3 n = 3,183 n = 3,736
Source: ATO sample datasets for 2015-16 and 2017-18 and ASBFEO calculations. Figures rounded to the nearest thousand.
Table 12: Turnover for nano businesses in Financial Year 2016 and Financial Year 2018
Financial Year 2016 Financial Year 2018
Definition
Mean Turnover ($) Median Turnover ($) Mean Turnover ($) Median Turnover ($)
Definition 1 27,000 22,000 24,000 18,000
Definition 2 26,000 21,000 23,000 17,000
Definition 3 23,000 18,000 20,000 14,000
Source: ATO sample datasets for 2015-16 and 2017-18 and ASBFEO calculations. Figures rounded to the nearest thousand.
4
ABS, “Counts of Australian Businesses, including Entries and Exits methodology”, 2020
Australian Small Business and Family Enterprise Ombudsman | Small Business Counts | Small business in the Australian Economy
18Table 13: Net Income for nano businesses in Financial Year 2016 and Financial Year 2018
Financial Year 2016 Financial Year 2018
Definition
Mean Net Income ($) Median Net Income ($) Mean Net Income ($) Median Net Income ($)
Definition 1 9,000 5,000 9,000 5,000
Definition 2 9,000 6,000 9,000 5,000
Definition 3 11,000 7,000 10,000 5,000
Source: ATO sample datasets for 2015-16 and 2017-18 and ASBFEO calculations. Figures rounded to the nearest thousand.
3.4 Age
According to the data from the 2016 census, 40% of small business owners in Australia are aged 45-59
years with a further almost 33% aged 30-44 years (Table 12). Over 19% of small business owners are over
60 years of age, proving the importance of that age group to small business and the economy more broadly.
Less than 8% are under 30 years of age.
Younger business owners account for a higher percentage of non-employing small business owners than of
employing small business owners. People in the 45-59 age group account for a lower percentage of non-
employing businesses compared to employing businesses. This suggests a life-cycle for some business
owners who start young with a non-employing business and then take on employees as they get older.
Table 14: Age of small business owners
15-29 years 30-44 years 45-59 years 60+ years Total
# % # % # % # % #
No employees 83,293 9.6 280,264 32.2 331,267 38.0 176,581 20.3 871,405
1-19 employees 30,934 5.4 194,026 33.6 247,704 43.0 104,052 18.0 576,716
Total 114,227 7.9% 474,290 32.8% 578,971 40.0% 280,633 19.4% 1,448,121
Source: 2016 Census data and ASBFEO calculations
3.5 Women in small business
The ABS Labour Force data used here gives the number of business owners/managers by gender. The
data is for all businesses, not just small businesses. However, given that small businesses account for
between 97.4% and 98.4% of all Australian businesses, the data is a reasonable approximation for
ownership/management of small business by women. The data shows a steady upwards trend in the
proportion of female business owners/managers over the last 20 years, with women now representing 35.4%
of business owner/managers (Chart 10).
Australian Small Business and Family Enterprise Ombudsman | Small Business Counts | Small business in the Australian Economy
19Chart 10: Proportion of female business owner/managers 1999-2020
Proportion of female owner/managers over time
37%
36%
Women as Owner/Managers
35%
34%
33%
32%
31%
30%
29%
28%
27%
June 2000 June 2005 June 2010 June 2015 June 2020
Year
Proportion of female owner managers Trendline
Source: ABS cat. no. 6291.0.55.001, 'Table 08. Employed persons by Status in employment of main job and Sex', Labour Force, Australia, Detailed -
Electronic Delivery, Aug 2020
Looking deeper, the number of full-time women owner/managers and part-time women owner/managers
have both been rising. As at July 2020, there were almost 715,000 women business owner/managers,
including 381,000 part-time and almost 334,000 full-time. While the proportion of full-time women
owner/managers has increased since 2000, the proportion of part-time women owner/managers has fallen
due to the number of part-time male owner/managers more than doubling over the same period (Chart 11).
Chart 11: Change in the proportion of female owner/managers from 2000-2020
Proportion of women owners and managers over 2000-2020
70%
60%
Proportion of Owner/Managers (%)
50%
40%
July 2000
30%
July 2020
20%
10%
0%
Part-time Women Full-time Women All Women Owner/Managers
Owner/Managers Owner/Managers
Category
Source: ASBFEO and ABS 6291.0.55.001 Labour Force, Australia, Detailed – Electronic Delivery, August 2020.
Australian Small Business and Family Enterprise Ombudsman | Small Business Counts | Small business in the Australian Economy
204. Innovative behaviour
4.1 Innovation by activity and size
Small business in Australia does not get the credit it deserves when it comes to innovation, which can be
defined as the development or introduction of new or significantly improved goods, services, processes or
methods.5 Small business accounts for 87.6% of all innovating businesses in Australia and 46.5% of small
businesses with 5-19 employees were innovating ones in 2018-19.6 This is despite the fact that a smaller
percentage of small businesses receive government financial assistance to innovate compared to medium
and large businesses (Table 13).
Table 15: Business innovation by activity and size 2018-19
0-4 employees 5-19 employees 20-199 employees 200+ employees All businesses
Goods/services innovation (%) 14.7 21.7 22.4 23.7 17.5
Innovating businesses (%) 30.0 46.5 52.1 52.2 36.9
Total number of businesses ('000) 522 259 70 5 857
Government financial assistance to
2.5 4.1 10.8 7.7 4.1
Innovation active businesses (%)
Source: ABS Catalogue No. 8167.0 Characteristics of Australian Businesses 2018-19, June 2020 and ASBFEO Calculations
4.2 Innovation and business performance
Innovation pays, with innovating small businesses outperforming their non-innovating counterparts on every
measure, including employment, profitability, and productivity (Chart 12).
Chart 12: Performance improvements for innovative vs non-innovative small businesses, 2018-19
Comparison of performance improvements
Productivity
IT investment Non-innovative small firms %
Area
Employment Innovative small firms %
Profitability
Sales
0 10 20 30 40 50 60
% increase on prior year
Source: ABS Act No. 8167.0 Characteristics of Australian Business 2018-19
5
ABS, “Innovation in Australian Business”, accessed 18 October 2020
6
Innovating businesses are those that introduced at least one type of innovation during the reference period. Innovation-active businesses are those that
undertook any innovative activity irrespective of whether the innovation was introduced, still in development or abandoned during the reference period. For
the 2018-19 ABS data, there were significant changes to the measure of innovation. Changes were based on updates to international innovation standards
and concepts outlined in the revised 2018 'Oslo Manual: Guidelines for Collecting, Reporting and Using Data on Innovation, Fourth edition '.
Australian Small Business and Family Enterprise Ombudsman | Small Business Counts | Small business in the Australian Economy
214.3 Investment in Research and Development
Small business comprised 23% of total business research and development (R&D) spending in 2017-18. In
2016-17, small business represented only 19% of total business R&D, indicating growing R&D activity
amongst small business. While large business still accounted for 51% of the total business R&D spending in
2017-18, this represented a decrease from 57% from 2015-16 (Chart 13).
Chart 13: Small business share of total business research and development spending - 2017-18
R&D spending by business size
Small business
23%
Large business
51%
Medium business
26%
Source: ABS Cat. No. 8104.0 Research and Experimental Development, Businesses, Australia, Sep 2019
4.4 Investment by sector
Table 14 shows R&D expenditure by sector. It shows that the top 3 sectors for small business R&D spending
are:
- Professional, Scientific and Technical Services ($2.08 billion);
- Manufacturing ($511 million); and
- Mining ($308 million).
As a share of total business R&D spending, small business is the most significant in the following sectors:
- Rental, Hiring and Real Estate Services (42%);
- Other Services (42%);
- Professional, Scientific and Technical Services (41%); and
- Health Care and Social Assistance (41%).
Australian Small Business and Family Enterprise Ombudsman | Small Business Counts | Small business in the Australian Economy
22Table 16: Business expenditure on R&D by industry and firm size – 2017-18
Small
Small Medium Large Expenditure
business
business business business on R&D
share
Industry $'000 $'000 $'000 $'000 %
Rental, Hiring and Real Estate Services 81,718 75,084 37,012 193,815 42
Other Services 73,251 61,128 40,274 174,653 42
Professional, Scientific and Technical Services 2,084,426 1,801,250 1,227,447 5,113,123 41
Health Care and Social Assistance 57,330 48,177 35,317 140,823 41
Retail Trade 87,780 94,079 60,345 242,204 36
Education and Training 8,004 21,713 - 27,112 30
Mining 308,423 168,484 572,899 1,049,805 29
Electricity, Gas, Water and Waste Services 98,281 19,493 235,245 353,020 28
Information Media and Telecommunications 167,354 131,914 310,783 610,052 27
Construction 87,112 96,837 165,215 349,164 25
Wholesale Trade 215,372 375,911 339,250 930,532 23
Administrative and Support Services 36,459 51,188 79,154 166,800 22
Agriculture, Forestry and Fishing 64,527 161,259 87,811 313,596 21
Accommodation and Food Services 6,290 12,045 19,503 37,838 17
Public Administration and Safety 3,056 13,533 - 21,889 14
Transport, Postal and Warehousing 16,021 31,084 73,318 120,423 13
Manufacturing 510,896 1,039,336 3,049,232 4,599,464 11
Arts and Recreation Services 12,632 46,213 63,943 122,788 10
Financial and Insurance Services 141,743 288,419 2,416,829 2,846,990 5
All Industries 4,060,675 4,537,147 8,813,577 17,414,091 23%
Source: ABS Cat. No. 8104.0 Research and Experimental Development, Businesses, Australia, Sep 2019
Australian Small Business and Family Enterprise Ombudsman | Small Business Counts | Small business in the Australian Economy
235. Being online
5.1 Internet usage
Small business is increasingly digitally capable. Rates of internet access, web presence, social media
presence, and engagement in e-commerce increased amongst both the 0-4 employees and 5-9 employee
categories from 2016-17 to 2018-19. However, small business still lags medium and large business across
all these measures of digital adoption. It will be interesting to see the increase in digital adoption amongst
small business in response to COVID-19 when the next dataset is released in 2021.
Table 17: Business use of the internet – 2018-19
Proportion of businesses Total proportion
0-4 employees 5-19 employees 20-199 employees 200+ employees
with/that in businesses
% % % % %
Internet access 96.2 97.6 99.8 96.1 97.0
Web presence 44.1 66.4 84.7 96.1 54.5
Social media presence 38.4 58.9 73.8 87.0 47.8
Placed orders via the internet 55.9 72.4 78.6 88.4 63.0
Received orders via the internet 35.3 50.5 51.0 66.3 41.4
Source: ABS Cat. No. 8167.0 Characteristics of Australian Business, Jun 2020
Australian Small Business and Family Enterprise Ombudsman | Small Business Counts | Small business in the Australian Economy
246. Exporting
6.1 By size of business
The number of small businesses exporting merchandise continues to increase. Over the three year period
from 2014-15 to 2017-18, over 2700 additional small businesses engaged in exporting merchandise. This
represented an increase of 9.5%, which was higher than the increase for medium businesses. By contrast,
small business represents less than 1% of total exports by value.7
Table 18: Number of exporters of merchandise
Number of businesses
Business Size
2014-15 2015-16 2016-17 2017-18
Large Business 6,085 6,275 6,464 6,763
Medium Business 14,126 14,827 14,854 15,075
Small Business 28,470 30,190 30,674 31,177
Total Merchandise Exporters 48,681 51,292 51,992 53,015
% of Exporters that are Small Business 58% 59% 59% 59%
Source: ABS Cat 5368.0.55.006 Characteristics of Australian Exporters, 2017-18, August 2019 and ASBFEO calculations
The top 3 largest small business export industries by value in 2017-2018 were:8
- Wholesale trade ($963 million);
- Other services9 $459 million); and
- Manufacturing ($379 million).
7
ABS Cat 5368.0.55.006 Characteristics of Australian Exporters, 2017-18, August 2019 and ASBFEO calculations
8
ABS Cat 5368.0.55.006 Characteristics of Australian Exporters, 2017-18, August 2019 and ASBFEO calculations
9
See explanatory note in Introduction.
Australian Small Business and Family Enterprise Ombudsman | Small Business Counts | Small business in the Australian Economy
257. Challenges - COVID-19
The COVID-19 pandemic has caused simultaneous health and economic crises around the world. In
Australia, as at 8 October 2020 there had been 27,182 confirmed cases with 24,794 cases recovered and
897 deaths.10 The crisis has also caused our first recession in 30 years (Chart 14) and the largest drop in
quarterly GDP growth on record.11 Most of this report is based on government datasets that have not been
updated since the onset of the crisis and therefore do not reflect its impact. This section draws on more
current data sources to present a brief snapshot of the impact of the crisis on small business and the broader
economy.
Chart 14: GDP growth rate chain volume measures, seasonally adjusted
Quarterly growth in real Gross Domestic Product, 1960-2020
6.0
4.0
2.0
0.0
%
-2.0
-4.0
-6.0
-8.0
Jun-60 Jun-65 Jun-70 Jun-75 Jun-80 Jun-85 Jun-90 Jun-95 Jun-00 Jun-05 Jun-10 Jun-15 Jun-20
Source: ABS, June 2020
While the range of measures taken by government and the financial services sector have helped cushion the
blow for small business and the broader economy, the impact of COVID-19 has still been enormous. Chart
15 shows the decrease in employees and in issued invoices by industry sector between 1 March and 26
August 2020.
10
Coronavirus (COVID-19) current situation and case numbers, Department of Health, accessed 8 October 2020
11
“Economic activity fell 7.0 per cent in June quarter”, ABS Media Release, 2 September 2020
Australian Small Business and Family Enterprise Ombudsman | Small Business Counts | Small business in the Australian Economy
26Chart 15: Deteriorating businesses operating conditions since 1 March 2020, by industry
Deteriorating business operating conditions since 1 March 2020, by industry
Arts and Recreation Services
Education and Training
Accommodation and Food Services
Rental, Hiring and Real Estate Services
Administrative and Support Services
Information Media and Telecommunications
Health Care and Social Assistance
Transport, Postal and Warehousing
Financial and Insurance Services
Professional, Scientific and Technical Services
Manufacturing
Retail Trade
Electricity, Gas, Water and Waste Services
Construction
Agriculture, Forestry and Fishing
0 5 10 15 20 25 30 35 40
% decrease in employees paid since 1 Mar 20 % decrease in weekly emailed invoices since 1 Mar 20
Source: MYOB Small Business Health Index 26 August 2020 – Australia, and ASBFEO calculations
Late payment times
Late payment times and extended payment terms are an ongoing challenge for small businesses. This
impacts on cash flow, with low cash flow being the leading cause of small business insolvency.12 An
important impact of the COVID-19 crisis is that payment times have further deteriorated. CreditorWatch
monitors how many days on average a payment is made after it is due and has found that late payments
were being paid 30.6 days late in October 2020 compared to 13.4 days late in October 2019.13 It must be
noted that this data does not capture payments made within agreed payment terms, which may themselves
be as long as 180 days. The biggest increase in payment delays occurred in the Transport, Postal and
Warehousing sector, where late payments are now an average of 90 days late compared to 9 days late in
October 2019 (Chart 16).
12
ASBFEO Payment Times and Practices Report 2017
13
CreditorWatch October 2020 data provided at the request of ASBFEO.
Australian Small Business and Family Enterprise Ombudsman | Small Business Counts | Small business in the Australian Economy
27Chart 16: Average payment times by industry
Number of days payment is overdue by industry
Other Services
Arts and Recreation Services
Health Care and Social Assistance
Education and Training
Public Administration and Safety
Administrative and Support Services
Professional, Scientific and Technical Services
Rental, Hiring and Real Estate Services
Financial and Insurance Services
Information Media and Telecommunications
Transport, Postal and Warehousing
Accommodation and Food Services
Retail
Wholesale Trade
Construction
Electricity, Gas, Water and Waste Services
Manufacturing
Mining
Agriculture, Forestry and Fishing
0 10 20 30 40 50 60 70 80 90 100
2020 October 2019 October
Source: CreditorWatch October 2020 data
Insolvency
Normally, such challenging business conditions would see a large increase in the number of small
businesses going insolvent. Interestingly, this has not been the case to date. The number of businesses
entering external voluntary administration declined sharply in March 2020 and has remained below 2019
levels since (Chart 17). This is likely the result of both the various financial support measures delivered in
response to the crisis and the temporary changes to insolvent trading protections.
The concern around low insolvency numbers in the current climate is that, when businesses that are not
viable delay entering external voluntary administration, they continue to accrue debts. These debts may
never be repaid and could have significant negative impacts on the suppliers’ cash flow, which could then
ripple through the economy.
Australian Small Business and Family Enterprise Ombudsman | Small Business Counts | Small business in the Australian Economy
28Chart 17: Business entering external voluntary administration (EXAD)
Businesses entering EXAD
1200
1000
ACT
800 NSW
Number of businesses
NT
600 QLD
SA
400 TAS
VIC
200 WA
Australia
0
Source: CreditorWatch October 2020 data
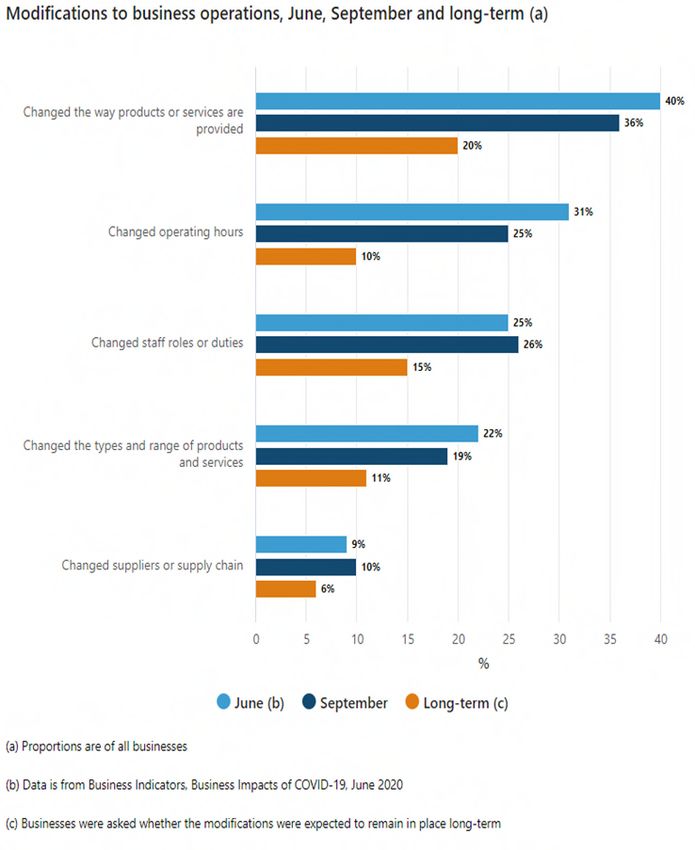
On a more positive note, many businesses have demonstrated their remarkable resilience and adaptability in
response to the crisis. For example, 40% of businesses surveyed by the ABS in June 2020 indicated that
they had changed the way they provided products or services, with 20% indicating that they intended to keep
these changes over the long-term (Chart 18).
Australian Small Business and Family Enterprise Ombudsman | Small Business Counts | Small business in the Australian Economy
29Chart 18: Modifications to business operations, June, September and long-term
Source: ABS Catalogue No. 5676.0.55.003 - Business Indicators, Business Impacts of COVID-19, September 2020
Australian Small Business and Family Enterprise Ombudsman | Small Business Counts | Small business in the Australian Economy
308. Challenges - Bushfires
The 2019-20 Australian bush fires devastated rural and regional Australia. The fires burned more than 12.6
million hectares of land, destroyed over 3,000 houses, and claimed the lives of 33 people.14 It is hard to
quantify the impacts on the economy and on small business in particular as there is limited available data
and the impacts are ongoing. In this section, we draw on data generously provided by the Small Business
Financial Counselling Support Line, together with other sources, to provide some preliminary analysis.
Data provided by the Small Business Financial Counselling Support Line suggests that the highest number
of small businesses affected by the fires was in NSW, followed by Victoria and Queensland (Chart 19).
Chart 19: Location of Callers from Inception until 30th of June 2020
Location of callers (%)
(inception to 30.6.20)
1% 11%
5%
NSW
7% VIC
QLD
53%
SA
WA
23%
unknown
Source: Small Business Bushfire Financial Counselling Support Line Insight Report July 2020
Chart 20 shows that the primary reasons callers sought assistance from the Support Line were access to
grants (49%) and help with managing debts (19%). The assistance line also found that callers were
distressed and experienced a level of ’disaster fatigue’, and that navigating the wide range of available
support was challenging for small business owners in a state of distress.
14
Ministerial Statement – Disaster Risk Reduction published by Department of Home Affairs on 26 February 2020
Australian Small Business and Family Enterprise Ombudsman | Small Business Counts | Small business in the Australian Economy
31Chart 20: Primary reason for contacting the Support service from inception to 30th of June.
Primary reason for contact (%)
(inception to 30.6.20)
4%
11% Access to grants / loans
Business viability
5%
2% Help with managing debts
49% Insolvency
7%
Insurance issues
Disputes
19% Other
No record
2%
Source: Small Business Bushfire Financial Counselling Support Line Insight Report July 2020.
Businesses impacted by the fires continue to be affected (Chart 21). In June 2020, just under 40% of callers
reported loss of trade. Businesses that were recovering from the impacts of the fires may have been
counting on an improved local business environment, which did not eventuate due to COVID-19.15
Chart 21: Impact of Bushfires.
Source: Small Business Bushfire Financial Counselling Support Line Insight Report July 2020.
The total economic impact will be more than the destruction of assets and loss of trade that was a direct
result of the bushfires, as substantial as those costs were. Businesses in areas considered to be high risk
will now also face higher insurance costs and find it harder to obtain finance and insurance coverage.16
Some estimates put the total cost of the bushfires to the Australian economy at over $100 billion.17
15
Small Business Bushfire Financial Counselling Support Line Insight Report July 2020.
16
Take care when examining the economic impact of fires. GDP doesn’t tell the full story Published by The Conversation Authored by Victoria University
Economist Janine Dixon
17
Australia is promising $2 billion for the fires. I estimate recovery will cost $100 billion published by CNN Perspectives Authored by: University of
Queensland economist John Quiggin
Australian Small Business and Family Enterprise Ombudsman | Small Business Counts | Small business in the Australian Economy
32You can also read