An Overview of the Aging Population & Individuals with Disabilities - YADKIN COUNTY - Piedmont Triad Regional Council
←
→
Page content transcription
If your browser does not render page correctly, please read the page content below

Y ADKIN                       An Overview of the
C OUNTY                        Aging Population
                                      &
                               Individuals with
                                 Disabilities

Publication Date: June 2018
PIEDMONT TRIAD
REGIONAL COUNCIL

Yadkin County

Letter from the Piedmont Triad Regional Council Area Agency on Aging Director ............ iii
Introduction ................................................................................................................................... 1
Health Care.................................................................................................................................... 2
   Health Outcomes ......................................................................................................................... 3
   Chronic Disease .......................................................................................................................... 4
   Health Care Cost ......................................................................................................................... 5
   Medicare ..................................................................................................................................... 5
   Health Care Facilities .................................................................................................................. 6
   Long-Term Care Facilities .......................................................................................................... 8
   Agencies Serving Older Adults and Individuals with Disabilities Directory............................ 10
Demographics of the Total Population ...................................................................................... 12
   Past and Present Total Population ............................................................................................. 12
   Projected Total Population ........................................................................................................ 12
Demographics of the Older Adult Population .......................................................................... 13
   Past and Present Older Adult Population .................................................................................. 13
   Projected Older Adult Population ............................................................................................. 14
   Working Adults......................................................................................................................... 15
   Piedmont Triad Region Growth ................................................................................................ 16
   Population Density.................................................................................................................... 17
   Household Types....................................................................................................................... 19
   Race & Ethnicity ....................................................................................................................... 20
   Income....................................................................................................................................... 22
   Health Insurance ....................................................................................................................... 23
   Vehicle Access .......................................................................................................................... 24
   Language ................................................................................................................................... 26
   Nutrition and Food Insecurity ................................................................................................... 27
   Individuals with Disabilities ..................................................................................................... 27
   Grandparent Caregivers ............................................................................................................ 28
   Family Caregivers ..................................................................................................................... 28
References .................................................................................................................................... 29

                                                                                                                                Page | i
Yadkin County

Figure 1: County Land Cover ......................................................................................................... 1
Figure 2: Total Population (1990-2016) ....................................................................................... 12
Figure 3: Projected Total Population Change (2016-2037) ......................................................... 13
Figure 4: Older Adult Population (1990-2016)............................................................................. 13
Figure 5: Projected Older Adult Population Change (2016-2037)................................................ 14
Figure 6: Population by Age Group (2005-2035) ......................................................................... 14
Figure 7: Ratio of Working Adults to Older Adults (1990-2035) ................................................ 15
Figure 8: Living Arrangements of the Population Age 65+ (2016) .............................................. 19
Figure 9: Income Benchmark Comparison ................................................................................... 22

Table 1: Population Overview (2016 & 2036)................................................................................ 1
Table 2: Chronic Conditions of the Fee-for-service Population Ages 65+ (2015) ......................... 4
Table 3: County Expenditure by Service Category for Clients 60+ (FY16-17) ............................. 5
Table 4: Medicare Enrollment (2013-2017).................................................................................... 5
Table 5: Health Care Professionals (2017)...................................................................................... 6
Table 6: Health Care Facilities Directory ....................................................................................... 7
Table 7: Long-Term Care Facilities & Beds in Yadkin County ..................................................... 8
Table 8: Provider Agencies Directory........................................................................................... 11
Table 9: Total Population Change (1990-2016) ............................................................................ 12
Table 10: Older Adult Population Change (1990-2016) ............................................................... 14
Table 11: Percent Growth (2015-2035) ........................................................................................ 16
Table 12: Older Adult Population in Rural Areas (2016) ............................................................. 19
Table 13: Population by Race & Ethnicity (2016) ........................................................................ 20
Table 14: 2016 Poverty Guidelines ............................................................................................... 22
Table 15: Health Insurance Coverage (2016)................................................................................ 23
Table 16: Disability by Type (2016) ............................................................................................. 27
Table 17: Grandparent Caregivers (2016)..................................................................................... 28

Map 1: 2018 NC Health Factors Map ............................................................................................. 3
Map 2: 2018 NC Health Outcomes Map......................................................................................... 3
Map 3: Health Care Facilities.......................................................................................................... 7
Map 4: Long-Term Care Facilities .................................................................................................. 9
Map 5: Provider Agencies ............................................................................................................. 10
Map 6: Population Density of Older Adults (60 Year and Older), 2016 by Block group............. 17
Map 7: Density of Older Adults in Rural, Suburban and Urban Areas (2016) ............................. 18
Map 8: Percent Minority of the Total Population by Block Group (2016) ................................... 21
Map 9: Older Adult Population without Access to a Vehicle (2016) ........................................... 24
Map 10: YVEDDI Surry-Yadkin Connector Route ...................................................................... 25
Map 11: Older Adult Population: Speak a Language Other than English (2016) ......................... 26

 ii | Page
Yadkin County

Letter from the Piedmont Triad Regional Council Area Agency on Aging Director

Health Care, Behavioral Health, and Human Services have undergone tremendous change in
recent years. The Affordable Care Act (ACA), Medicare Access and CHIP Reauthorization Act
(MACRA), the imminent transition from traditional Medicaid to Managed Care, the expected
change of the Community Care Network and transformation in NC Department of Health and
Human Services personnel, policies, and processes has significantly impacted service delivery
systems. The mergers and acquisitions ongoing in Piedmont healthcare, bring new energy and
potential to the industry. Other changes in Community Based Organizations (CBO) and the new
Veterans Administration medical facility in Kernersville are adding potential and capacity to the
regional healthcare system. While these reorganizations will help position the healthcare
industry to manage the demographic realities of aging, they alone are not enough to ensure the
system’s sustainability going forward.
In the face of revenue and funding pressure, our thinking about service delivery and program
development must change. Leaders in the Aging industry have impressed upon the members of
the Aging Network the need to adopt a new operating model. The imperatives of the present and
challenges of the future demand we innovate and modernize how we do business. That does not
mean we change the quality of service or downsize. It means that we focus our attention on the
nexus between the social determinants of health and the health care delivery system. Not only
does this make business sense, it is a moral imperative.
The Aging industry, including the Administration for Community Living, the Administration on
Aging, National Council on Aging, and the National Association of Area Agencies on Aging,
among others, has signaled big changes in the Aging Network. These changes have been a
necessary response to the realities of the Affordable Care Act, the Budget Control Act, the
political landscape, and economic downturn of 2008. We recognize that we cannot continue
with business as usual.
We must adopt practices that incentivize financial responsibility and standardize the
administration of a highly complex, and sometimes redundant service delivery system. Our
primary concern must be and will remain that our delivery system provide beneficial health
outcomes for as many people as possible.
A streamlined approach will help us to coordinate a cohesive and comprehensive plan of
programs and services across the region, develop new partnerships, provide person centered care,
diversify sources of revenue, and remain relevant as leaders of Home & Community Based
Services.
Sincerely,

Blair Barton-Percival
Area Agency on Aging, Director

                                                                                   Page | iii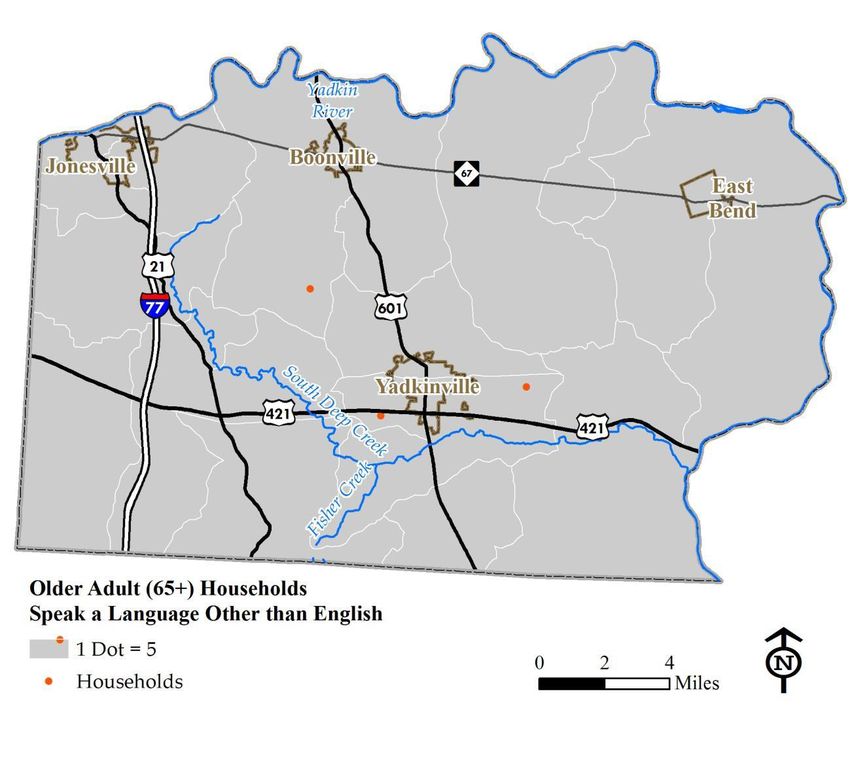
Yadkin County

Introduction
The Area Agency on Aging, a division of the Piedmont Triad Regional Council, serves 12
counties in central North Carolina, including Yadkin County. Covering 338 square miles, the
County’s land area is 43% forest cover, 38% agriculture/pasture, and 9% developed [1].
                                                                              Figure 1: County Land Cover

The population in Yadkin County and across North
Carolina is changing. In 2016, Yadkin County’s
population reached 37,725. The number of people in
Yadkin County under age 18 was already less than the
number of people age 60 years and older. Over the next
two decades, the child population (under age 18) will                By 2036, 1 in 3
decrease by 1.8% while the older adult population (age 60
years and over) will increase by 21.4%. In 2036, the older
                                                                     Yadkin County
adult population will reach 11,563 people and will vastly            residents will be
outnumber the child population in Yadkin County [2].
Table 1: Population Overview (2016 & 2036)
                                                                     over age 60.
                                                2016             2036                   Change
 Total Population                                  37,725           37,773              48           0.1%
   Children (Ages 0-17)                             7,975            7,830            -145          -1.8%
   Adults (Ages 18-59)                            20,222             18,380          -1,842         -9.1%
   Older Adults (Ages 60+)                         9,528             11,563          2,035         21.4%
Source: NC OSBM 2016 Population Estimates & 2036 Population Projections

                                                                                              Page | 1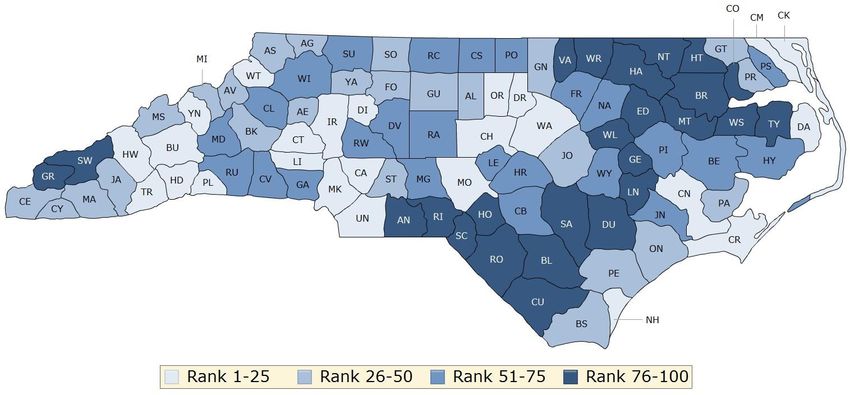
Yadkin County

Health Care
As this age-related demographic shift occurs and as chronic disease and comorbidities become
more prevalent, there will be a corresponding increase in the need and demand for chronic
disease self-management, physical health, fiscal health and social supports to ensure a sound
quality of life for residents in Yadkin County. The growing aging population will challenge
federal entitlement programs such as Social Security, Medicare and Medicaid, and will
significantly increase the demand for Home and Community-Based Services (HCBS), like those
offered by the Area Agency on Aging (AAA) and through its network. HCBS allow individuals
to remain at home and make choices. They live with dignity and independence at a fraction of
the cost of skilled nursing care or other institutional settings. Social determinants, such as
housing, transportation, financial support and food security, can account for 80% of health
outcomes [3]. The HCBS offered by the AAA influence social determinants of health, benefiting
population health through community interventions and collaborative efforts. HCBS drive down
the cost of healthcare by utilizing the lower cost of in-home and community-based programs [4].
Successful transitions from institutional facilities to these community based settings,
communicating with primary care physicians and the coordination of care is key to success.
Although there is a lot of attention and controversy on health care coverage in the national
spotlight, the movement towards evolving the health care system from “volume to value” makes
steady progress. Historically, under its “fee for service” payment system, Medicare paid for tests
and procedures with minimal requirements for their quality or effectiveness. Under the recent
bipartisan MACRA legislation (Medicare Access and CHIP Reauthorization Act), Centers for
Medicare & Medicaid Services (CMS) is moving towards paying for improved health outcomes.
In 2015, CMS set two goals in its push for greater value, and is on track to meet them.
   1. 30% of all Medicare payments are tied to quality through alternative payment models by
      the end of 2016 (met) and 50% by the end of 2018 (on track to meet).
   2. 85% of Medicare fee-for-service payments are tied to quality or value by the end of 2016
      (met) and 90% by the end of 2018 (on track to meet).
These goals will provide incentive for health care providers to partner with ready and capable
Community Based Organizations in new ways. North Carolina has many innovative health
systems that may, with the right approach, be productive partners for helping to improve the
lives of older adults in a way that benefits health care providers, Community Based
Organizations, and the citizens they both serve. Partnerships remain one of the best
opportunities to improve the lives of our older citizens. Changes allowing Medicare Advantage
plans to be reimbursed for HCBS is positive and beneficiaries will reap the benefits.

 Centers for Medicare & Medical Services is moving
 towards paying for improved health outcomes.

 2 | Page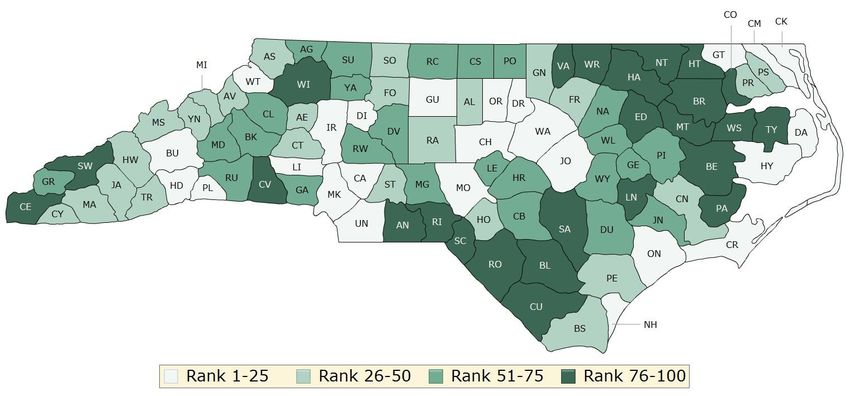
Yadkin County

Health Outcomes
Every county in the United States is assessed annually to reveal how healthy residents are and
how long they will live. Each county is given a Health Factors Rank, based on health behaviors,
clinical care, social and economic factors, and the physical environment. Each county is also
given a Health Outcomes Rank, based on length and quality of life.
In the North Carolina 2018 County Health Rankings, Yadkin County ranks 69th for health
outcomes and 38th for health factors [5]. The higher ranking counties tend to be located in the
urban areas around the Triangle, Charlotte and Asheville.
Communities can use these rankings to help identify issues and opportunities for local health
improvement, as well as to garner support for initiatives among government agencies, healthcare
providers, community organizations, business leaders, policy makers and the public.
Map 1: 2018 NC Health Factors Map

Map 2: 2018 NC Health Outcomes Map

                                                                                    Page | 3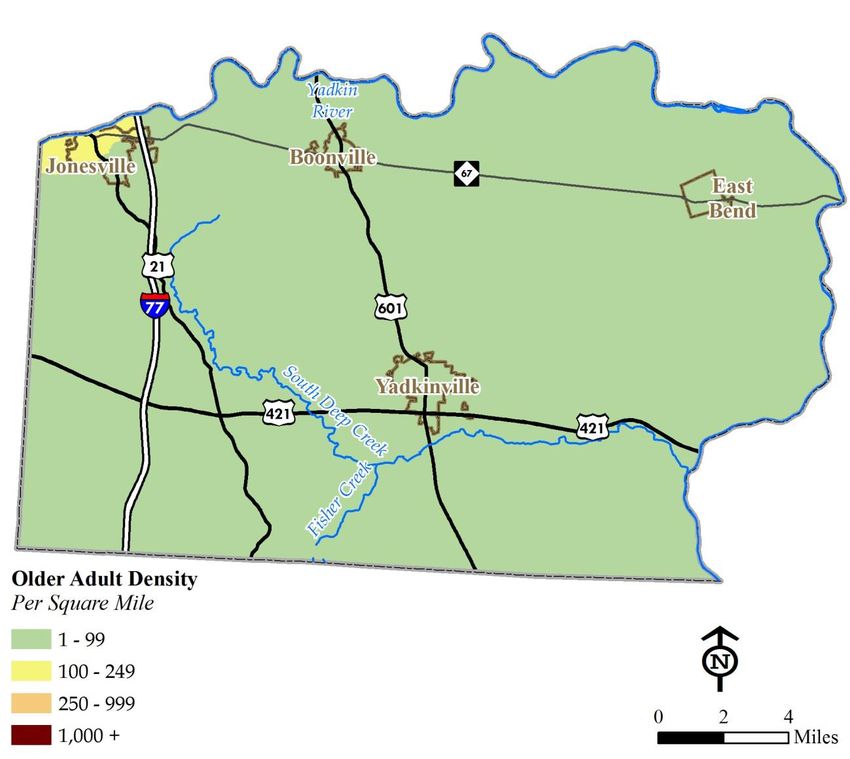
Yadkin County

Chronic Disease
Chronic diseases and conditions - such as heart disease, stroke, cancer, type 2 diabetes, obesity
and arthritis – are among the most common, costly and preventable of all health problems.
Across the nation, about 32% of the population have multiple chronic conditions, and 86% of all
health care expenditures are for people with chronic and mental health conditions. Table 2
shows the prevalence of certain chronic conditions for the older adult population, ages 65 years
and older, that are Medicare beneficiaries. [6]

Table 2: Chronic Conditions of the Fee-for-service Population Ages 65+ (2015)

                    61%                           51%                           29%
               High Blood                       High                            Heart
                Pressure                     Cholesterol                        Disease
              (Hypertension)               (Hyperlipidemia)

                    30%                           31%                           20%
                  Arthritis                      Diabetes                Chronic Kidney
                                                                            Disease

                    17%                           11%                           10%
                    COPD                      Alzheimer’s                       Cancer
                                              Disease or
                                               Dementia

                                  Source: CMS Chronic Conditions Prevalence

 4 | Page
Yadkin County
Health Care Cost
Skilled nursing care, paid by Medicaid, is the most costly service utilized by older adults (ages
60 years and over) each year. In fiscal year 2016-17, skilled nursing care represented 53% of the
County’s total older adult expenditures and had the highest cost per client ($23,383 per client).
The County spends much less on Adult Care Homes/Assisted Living Facilities and Home
Health/In-Home Care, and these services have a much lower expenditure per client (see Table 3)
[7].
Skilled nursing care is an important component on the continuum of long term care. Without
exception, every senior asked stated they want to remain in their home for as long as possible
and receive formal services in their home or the community if that will allow them to remain
independent. The Medicaid Waiver Program, Community Alternatives Program for Disabled
Adults (CAP DA), reports that an individual who is nursing home eligible can remain at home
for approximately two-thirds of the cost of an institutional setting. As healthcare costs continue
to rise and Merit and Incentive payment models are implemented, HCBS grow in importance as
a delivery model which saves money, provides greater customer satisfaction and creates more
jobs in the local economy.
Table 3: County Expenditure by Service Category for Clients 60+ (FY16-17)
Service Category Clients Expenditure Exp. by Client % of Exp.
Adult Care Homes/Assisted Livings 252 $748,836 $2,972 3.4%
Economic Support (indirect financial support) 4,426 $3,974,047 $898 18.2%
Hospitals, Physicians, and Other Health Care 3,445 $1,784,258 $518 8.2%
Home Health and In-Home Care 843 $3,217,351 $3,817 14.8%
Institutional Care (Skilled Nursing Care) 493 $11,528,014 $23,383 52.9%
Social Support (outside home) 422 $558,711 $1,324 2.6%
TOTAL 9,881 $21,811,217 $2,207
Source: NCDHHS, County Expenditure Reports, 2017
Medicare
The number of Medicare beneficiaries with Hospital/Medical Coverage increased 7.6% between
2013 and 2017. Medicare beneficiary participation in Medicare Advantage Plans is increasing at
a faster rate than enrollment in Original Medicare. The number of Medicare beneficiaries with
Prescription Drug Coverage increased at a slightly higher rate (11.3%) during the same time
frame. [8]
Table 4: Medicare Enrollment (2013-2017)
Medicare Enrollment
2013 2017 Change Percent Change
Hospital/Medical 7,995 8,602 607 7.6%
Original Medicare (fee-for-service) 4,097 3,766 -331 -8.1%
Medicare Advantage and Other Health Plans 3,898 4,836 938 24.1%
Prescription Drug 6,366 7,086 720 11.3%
Prescription Drug Plans (stand-alone) 2,765 2,585 -180 -6.5%
Medicare Advantage Prescription Drug Plans 3,601 4,501 900 25.0%
Source: CMS Medicare Enrollment Dashboard
Page | 5Yadkin County
Health Care Facilities
Table 5: Health Care Professionals (2017)
Yadkin NC The County’s health care needs are
Count Rate Rate served in part two urgent care centers,
Physicians 17 4.5 23.8 one each in Jonesville and Yadkinville
Primary Care Physicians 12 3.2 7.0 (see Map 3). In 2017, Yadkin County
Family Practice 12 3.2 2.6 had only 17 physicians with a rate of
Internal Medicine 0 0.0 1.9
4.5 per 10,000 population compared to
a rate of 23.8 across the state [9].
Obstetrics/Gynecology 0 0.0 1.1
Pediatric 0 0.0 1.5
Geriatric 1 0.3 0.2
Dentists
Dentists 9 2.4 5.0
Dental Hygienists 16 4.2 6.0
Nurses
Registered Nurses 125 33.2 100.7
Nurse Practitioners 13 3.4 6.5
Certified Midwives 0 0.0 0.3
Licensed Practical Nurses 37 9.8 17.9
Other Health Care Professionals
Chiropractors 3 0.8 1.7
Occupational Therapists 5 1.3 3.4
Occupational Therapy
4 1.1 1.7
Assistants
Optometrists 4 1.1 1.1
Pharmacists 15 4.0 11.4
Physical Therapists 11 2.9 6.3
Physical Therapy Assistants 13 3.5 2.9
Physician Assistants 2 0.5 5.9
Podiatrists 0 0.0 0.3
Practicing Psychologists 2 0.5 2.2
Psychological Associates 2 0.5 0.8
Respiratory Therapists 1 0.3 4.2
Source: NC Health Professions Data System
6 | PageYadkin County
Map 3: Health Care Facilities
Table 6: Health Care Facilities Directory
Map
Name Address City ZIP Phone
ID
1 Hugh Chatham Urgent Care 546 Winston Rd Jonesville 28642 (336) 526-0037
2 Express Care of Yadkin 755 S State St Yadkinville 27055 (336) 849-4147
Source: PTRC AAA
Page | 7Yadkin County
Long-Term Care Facilities
Long-Term Care facilities provide up to
24 hour care for individuals who are
unable to live safely by themselves.
There are various types of facilities,
including Skilled Nursing Facilities
(SNF), Adult Care Homes and Family
Care Homes. Each differs in size and
services provided.
Nursing facilities must be licensed in
accordance with North Carolina state law
by the North Carolina Division of Health
Service Regulation. In addition, nursing
facilities that wish to receive Medicare
and Medicaid reimbursement must be
certified in accordance with federal law.
Nursing facilities that are Medicare and Medicaid certified receive annual licensure inspections
by the Division of Health Service Regulation. The Regional Long Term Care Ombudsman
program at the AAA works with all facilities across the region and is responsible for
approximately 18,000 long-term care beds. The program has developed deep relationships with
every facility in the region and provides trainings and education to help them meet the needs of
their population.
Adult Care Homes and Family Care Homes provide care for persons age 18 and older who do
not need nursing home care, but are no longer able to remain in their own home because they
need help in meeting daily needs such as meal preparation
and housekeeping. These facilities care for people who
only need occasional and incidental medical services.
Room and board, personal assistance, supervision of
medications, and social activities are provided. The private
cost rates vary from facility to facility and supplemental
assistance may be available to cover the cost for those with
limited incomes. These are commonly referred to as
Assisted Living Facilities.
Table 7: Long-Term Care Facilities & Beds in Yadkin County
Total # of Total # of
Facilities Beds
Adult Care Homes 4 189
Family Care Homes 0 0
Skilled Nursing Facilities 2 223
TOTAL 6 412
Source: PTRC AAA
8 | PageYadkin County
Map 4: Long-Term Care Facilities
Source: PTRC AAA
Page | 9Yadkin County Agencies Serving Older Adults and Individuals with Disabilities Directory Map 5: Provider Agencies Source: PTRC AAA 10 | P a g e
Yadkin County

Table 8: Provider Agencies Directory

 Map
                    NAME                     ADDRESS              CITY         ZIP        PHONE
 ID
          Yadkin Valley Senior
   1                                   121 Delos Martin Drive   Jonesville    28642    (336) 367-7251
          Center
          Yadkin Valley Economic       533 North Carolina
   2                                                            Boonville     27011    (336) 367-7251
          Development District, Inc.   Avenue
   3      East Bend Senior Center      473 Main Street          East Bend     27018    (336) 367-7251
          Yadkin County Veterans       101 S State Street,
   4                                                            Yadkinville   27055    (336) 679-8209
          Service Office               Room 105
          Yadkin County Senior         207 East Hemlock
   5                                                            Yadkinville   27055    (336) 367-7251
          Center                       Street
   6      Yadkin County D.S.S.         250 Willow Street        Yadkinville   27055    (336) 679-4210
          New Horizons Home
   7                                   648 Carolina Avenue      Yadkinville   27055    (336) 677-3843
          Care, Inc.
Source: PTRC AAA

                                                                                        P a g e | 11
Yadkin County
Demographics of the Total Population
Past and Present Total Population
In 2016, the County had a total population of 37,725 [2]. Between 1990 and 2016 the County
added just over 7,000 residents – a 23.7% growth. Yadkin County saw lower percent changes in
total population than the Piedmont Triad and the State on average.
Figure 2: Total Population (1990-2016)
40,000
Total Population
35,000
30,000
25,000
1990 1995 2000 2005 2010 2016
Yadkin: 30,488 33,817 36,348 37,274 38,406 37,725
Source: NC OSBM, US Census Bureau
Table 9: Total Population Change (1990-2016)
Yadkin County Piedmont Triad North Carolina
Change % % %
1990-1995 3,329 10.9% 8.8% 10.8%
1995-2000 2,531 7.5% 8.4% 9.6%
2000-2005 926 2.5% 4.7% 7.9%
2005-2010 1,132 3.0% 7.0% 9.8%
2010-2016 -681 -1.8% 3.7% 6.5%
Source: NC OSBM, US Census Bureau
Projected Total Population
Between 2016 and 2037, Yadkin County is projected to add only 51 residents to grow to a
population of 37,776 people in 2037 – only a 0.1% increase. This rate of change is much lower
than the Piedmont Triad as a whole (15.4%) and the state (23.6%). The annual rate of change for
the total population in Yadkin County is expected to remain around 0.01% between 2016 and
2037, which is much lower than the annual growth rate in previous years – 0.23% between 2000
and 2016. [2]
12 | P a g eYadkin County
Figure 3: Projected Total Population Change (2016-2037)
25% 23.6%
20%
15.4%
15%
10%
5%
0.1%
0%
Yadkin Piedmont Triad North Carolina
Source: NC OSBM
Demographics of the Older Adult Population
Past and Present Older Adult Population
In 2016, the older adult population (60 years of age and older) reached 9,528 people in Yadkin
County. Beginning in 2000, the percent change of the older adult population has been higher
than that of the total population. Between 2005 and 2010, the older adult population grew 15%,
five times the rate of the total population. Between 2010 and 2016 the older adult population
grew 9.3%, while the total population actually lost residents during this time period [2].
Figure 4: Older Adult Population (1990-2016)
Source: NC OSBM, US Census Bureau
P a g e | 13Yadkin County
Table 10: Older Adult Population Change (1990-2016)
Yadkin County Piedmont Triad Nort h Carolina
Change % % %
1990-1995 495 8.2% 7.2% 8.7%
1995-2000 384 5.9% 7.2% 8.6%
2000-2005 658 9.5% 10.1% 13.1%
2005-2010 1,139 15.0% 17.9% 21.2%
2010-2016 812 9.3% 17.5% 22.4%
Source: NC OSBM, US Census Bureau
Projected Older Adult Population
Over the next 20 years, Yadkin County is projected to only grow by 51 total residents. By 2037,
the older adult population will reach an estimated 11,490 people and will grow by 20.6% while
the total population will only grow by 0.1%
Figure 5: Projected Older Adult Population Change (2016-2037)
60% 53.3%
39.7%
40%
20.6%
20%
0%
Yadkin Piedmont Triad North Carolina
Source: NC OSBM
In 2016, the older adult population (60 years of age and older) represented 25% of the County’s
total population. This percentage has risen from 14% in 2000, and is projected to rise to 30% by
year 2037. In 2037, Yadkin County will have an estimated older adult population of 11,490. [2]
Figure 6: Population by Age Group (2005-2035)
100%
14%
23% 25% 30%
80%
60%
62%
54% 54% 49%
40%
20%
24% 23% 21% 21%
0%
2000 2010 2016 2037
Children (Age 0-17) Adults (Age 18-59) Older Adults (Age 60+)
Source: NC OSBM
14 | P a g eYadkin County
Working Adults
Pressure will increase on the agencies providing care for the aging population of Yadkin County.
One factor of this pressure is the relative decline in the ratio of working age people (ages 18 to
64) compared to the number of retirement age adults (ages 65 years and older). Figure 7 below
illustrates the ratio and numbers of working age and retirement age adults from 1990 to 2015,
along with the projected figures to 2035 (separated by the brown dashed line). In 2000, there
were 4.37 working adults for every retirement-age adult. In 2015 that ratio dropped to 3.34, and
will continue to drastically drop to 2.29 by year 2035. [2]
Figure 7: Ratio of Working Adults to Older Adults (1990-2035)
35,000 4.50
Ratio of Working Adults to Older Adults
30,000 4.00
6,962
6,241
7,406
7,937
8,525
8,897
5,547
5,144
Population
25,000 3.50
4,529
20,000 3.00
22,496
23,027
23,227
22,649
22,038
21,283
20,378
19,696
19,119
15,000 2.50
10,000 2.00
1990 2000 2005 2010 2015 2020 2025 2030 2035
Working Adults (Ages 18-64) Older Adults (Ages 65+)
Ratio of Working Adults to Older Adults
Source: NC OSBM, US Census Bureau
P a g e | 15Yadkin County
Piedmont Triad Region Growth
Yadkin County will experience a 0.3% growth in the total population between 2015 and 2035 –
ranking 9th out of the 12 counties in the region. The older adult population in Yadkin County
will grow by 24.4% in this same time frame – ranking 8th in the region. [2]
Table 11: Percent Growth (2015-2035)
Older Adults (Age 60+) Total Population
County:
Percent Growth Rank Percent Growth Rank
Alamance 60.5% 1 28.5% 1
Davie 56.1% 2 24.8% 2
Guilford 47.8% 3 14.5% 4
Forsyth 45.9% 4 21.1% 3
Randolph 44.3% 5 13.5% 5
Davidson 40.6% 6 12.1% 6
Stokes 31.8% 7 -0.4% 12
Yadkin 24.4% 8 0.3% 9
Montgomery 23.5% 9 6.3% 7
Caswell 19.7% 10 0.3% 8
Rockingham 19.3% 11 -0.4% 11
Surry 18.5% 12 -0.3% 10
Piedmont Triad 42.5% 14.6%
North Carolina 55.4% 22.7%
Source: NC OSBM
16 | P a g eYadkin County
Population Density
In 2016, older adults (ages 60 years and over) accounted for 23% of the total population in
Yadkin County. Map 6 below displays the population density of these older adults by block
group based on the 2016 American Community Survey. Density is highest around the Town of
Jonesville.
Map 6: Population Density of Older Adults (60 Year and Older), 2016 by Block group
Source: US Census Bureau, ACS 2012-2016, TIGER/Line Block Groups
P a g e | 17Yadkin County Rural Population Yadkin County has an overall population density of 113 people per square mile. The NC Rural Center defines rural as an area with an average population density of 250 people per square mile or less. The NC Rural Center defines Yadkin County as a rural county. Map 7 below identifies rural, suburban and urban census block groups in the County, overlaid with the older adult population density. A large portion of the older adult population lives in the County’s urban and suburban areas, but the majority (83%) of the County’s older adult population resides in rural areas. Map 7: Density of Older Adults in Rural, Suburban and Urban Areas (2016) Source: US Census Bureau, ACS 2012-2016, TIGER/Line Block Groups 18 | P a g e
Yadkin County

Table 12: Older Adult Population in Rural Areas (2016)

                        Total Population        Population of Older Adults          Percent of Older Adults
 County                 of Older Adults           (60+) in Rural Census              (60+) in Rural Census
                              (60+)                   Block Groups                       Block Groups
 Alamance                           34,354                           8,201                             23.9%
 Caswell                             6,077                           5,489                             90.3%
 Davidson                           37,140                          11,217                             30.2%
 Davie                              10,738                           6,618                             61.6%
 Forsyth                            73,893                           4,543                              6.1%
 Guilford                           99,073                          11,174                             11.3%
 Montgomery                          6,936                           6,929                             99.9%
 Randolph                           32,276                          14,328                             44.4%
 Rockingham                         23,447                          13,402                             57.2%
 Stokes                             12,133                           8,831                             72.8%
 Surry                              18,525                          10,474                             56.5%
 Yadkin                              9,486                           7,889                             83.2%
 Piedmont Triad                    364,078                         109,095                             30.0%
Source: US Census Bureau, ACS 2012-2016, TIGER/Line Block Groups

Household Types
In Yadkin County, 63% of the older      Figure 8: Living Arrangements of the Population Age 65+ (2016)
adult population (age 65 years and                                                       Group
over) live in family households.                 Non-family                             Quarters
Another one-third of these older adults               49                                   213
live alone. The majority of these                     1%                                   3%
adults living alone are women. In the
County, 1,568 older adult women live
alone, 22.8% of the entire older adult                   Living
population. A small percentage (1%)                      Alone
live in non-family households and 3%                     2,279
live in group quarters. Group quarters                    33%                      Family
include such places as residential                                                  4,343
treatment centers, skilled nursing                                                  63%
facilities, group homes and
correctional facilities. [10]

                                                         Source: US Census Bureau, ACS 2012-2016, Table B09020

                                                                                               P a g e | 19
Yadkin County
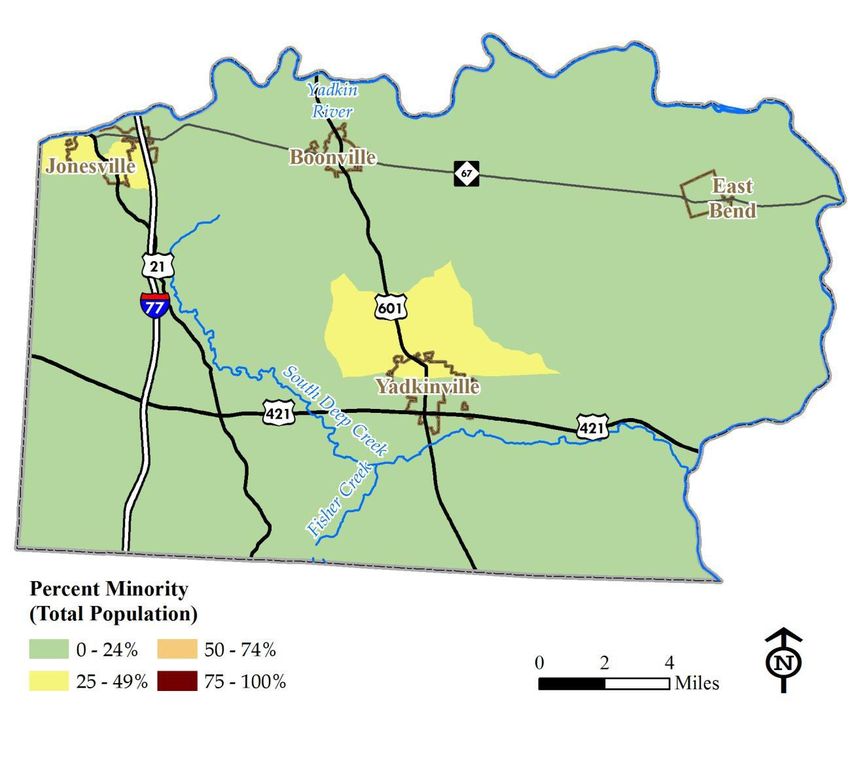
Race & Ethnicity
Table 13 below breaks down the racial and ethnic categories for the older adult population (age
65 years and over) compared to that of the total population in the County. 88% of the older adult
population is white, compared to 92% of the total County population. Only 0.4% of the older
adult population is Hispanic, compared to 10.6% of the total County population [10]. Higher
percentages of minorities live in and around Jonesville and Yadkinville, as seen in Map 8. The
Centers for Disease Control and Prevention (CDC) reports that minorities experience a
disproportionate burden of preventable disease, death and disability compared to non-minorities
[11].
Table 13: Population by Race & Ethnicity (2016)
Population 65+ Total Population
Total 6,884 37,819
By Race:
White 6,079 88.3% 34,612 91.5%
Black or African American 221 3.2% 1,285 3.4%
American Indian and Alaska Native 3 0.0% 111 0.3%
Asian 0 0.0% 22 0.1%
Native Hawaiian and Other Pacific Islander 0 0.0% 0 0.0%
Some Other Race 0 0.0% 1,222 3.2%
Two or More Races 21 0.3% 567 1.5%
By Ethnicity:
Hispanic or Latino 29 0.4% 4,010 10.6%
Not Hispanic or Latino 6,855 99.6% 33,809 89.4%
Source: US Census Bureau, ACS 2012-2016, Table B02001
20 | P a g eYadkin County
Map 8: Percent Minority of the Total Population by Block Group (2016)
Source: US Census Bureau, ACS 2012-2016, TIGER/Line Block Groups
P a g e | 21Yadkin County
Income
The average earnings income for the older adult population (60 years of age and over) in Yadkin
County is $39,216, compared to the average of $57,405 for the total population. The older adult
population also receives income from sources other than wage earnings, such as Social Security
and retirement income. 81.4% of older adult households receive Social Security income with an
average income of $18,017; while 37.6% of older adult households receive retirement income
with an average income of $17,826. Only 12.7% of the older adults (60 years of age and over)
live below the poverty level, compared to 19.0% of the County’s total population. Rising health
care costs impact budgets of older adults, resulting in the inability to pay for necessities such as
housing, utilities and food. [10]
Figure 9: Income Benchmark Comparison
$70,000
$60,000 $57,405
$50,000
$39,216
$40,000
$30,000
2016 Poverty
$20,000 $17,826 $18,017 Threshold
$11,880
$8,288
$10,000
$4,472
$0
Mean Earnings Mean Earning s Mean Retirement Mean Social Mean Mean Cash Public
(Total Population) (60+) Income (60+) Security Income Supplemental Assistance Income
(60+) Security Income (60+)
(60+)
Source: US Census Bureau, ACS 2012-2016, Table S0102
Table 14: 2016 Poverty Guidelines
Persons in 2016 Poverty
Family/Household Guidelines
1 $11,880
2 $16,020
3 $20,160
4 $24,300
For families/households with more than 4
persons, add $4,160 for each individual
person.
Source: US Department of Health & Human Services
22 | P a g eYadkin County
Health Insurance
Most older adults (ages 65 years and over) in Yadkin County and across the state have some type
of health insurance coverage. Only 0.3% of the older adults in the County are not covered,
compared to 14.3% of the County’s total population. The majority of these older adults have
either Medicare only coverage or Medicare combined with employer-based or direct purchase
insurance [10]. As a result, seniors impact the cost of public and private healthcare
disproportionately than the non-senior population. The most effective way to positively impact
public and private healthcare outcomes with seniors is by addressing their social determinants of
health and assuring that they are safe in their homes with access to home-based community
services.
Table 15: Health Insurance Coverage (2016)
Yadkin Count y Region State
Older Adult Population (65+) 6,675 - - -
Employer-based only 90 1.3% 1.6% 1.4%
Direct purchase only 9 0.1% 0.3% 0.3%
Medicare only 1,905 28.5% 30.4% 26.5%
TRICARE/Military/VA only 0 0.0% 0.1% 0.1%
Employer-based & Direct purchase 0 0.0% 0.1% 0.1%
Employer-based & Medicare 924 13.8% 16.9% 17.9%
Direct purchase & Medicare 1,583 23.7% 22.6% 21.4%
Medicare/Medicaid public only 597 8.9% 6.3% 7.0%
Other 1,550 23.2% 21.3% 24.8%
No health insurance coverage 17 0.3% 0.5% 0.5%
Total Population no health insurance coverage - 14.3% 13.3% 13.2%
Source: US Census Bureau, ACS 2012-2016, Table B27010
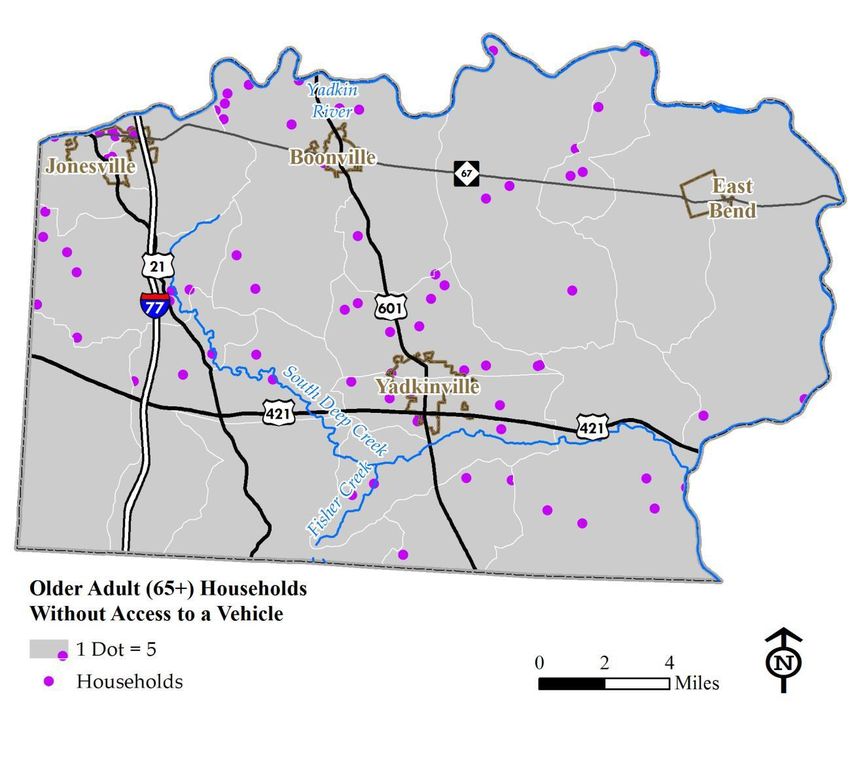
P a g e | 23Yadkin County Vehicle Access In Yadkin County, an estimated 391 households with an individual 65 years of age and over do not have access to a vehicle – 8.4% of these older adult households. This statistic is higher than that for the total households in the County, where 5.9% of all households do not have access to a vehicle [10]. Transportation is delivered through the AAA Network to support seniors. This is an important social determinant of health, which can be positively impacted through coordination with Community Based Organizations (CBO) and healthcare systems. Map 9: Older Adult Population without Access to a Vehicle (2016) Source: US Census Bureau, ACS 2012-2016, TIGER/Line Block Groups 24 | P a g e
Yadkin County

Transit Options
Yadkin County is served by YVEDDI Transportation, providing on-demand transportation
services to all citizens in the County, including the elderly and disabled. YVEDDI also operates
the Surry-Yadkin Connector, connecting Jonesville to Elkin, Dobson and Mount Airy. Yadkin
County is also served by PART with two Park and Ride lots used for carpooling and vanpooling
– one at the intersection of Asbury Church Road and Flat Rock Church Road and another on
Pine Street close to the exit ramp to US-601 off of US-421.
Map 10: YVEDDI Surry-Yadkin Connector Route

Source: YVEDDI

                                                                                  P a g e | 25
Yadkin County Language English is the most common language spoken in Yadkin County. An estimated 0.8% of older adults (60 years of age and over) speak a language other than English. Only 0.5% of the older adult population speaks English less than very well. Of the total County population, 8.3% speak a language other than English and 4.2% speak English less than very well [10]. Map 11: Older Adult Population: Speak a Language Other than English (2016) Source: US Census Bureau, ACS 2012-2016, TIGER/Line Block Groups 26 | P a g e
Yadkin County

Nutrition and Food Insecurity
In a study released in 2015, AARP published national rankings for food insecurity. North
Carolina ranked 11th for the number of individuals age 60 years and over who experience food
insecurity, at a rate of 17.5%. Food insecurity is indicated by experiencing a moderate degree of
not having enough to eat; often prioritizing payment for rent, medical care, prescriptions or
utility bills from the money they would normally use for food. Individuals experiencing food
insecurity often go without food in order to meet these other vital living expenses [12].
According to Feeding America, in 2016 Yadkin County had 4,530 individuals experiencing food
insecurity (12.0% of the total population). The average cost of a meal in Yadkin County is
$2.91, higher than the statewide average of $2.88. 89% of the individuals experiencing food
insecurity are income-eligible for federal anti-hunger programs; the other 11% are dependent on
charitable food assistance [13]. Malnutrition within the senior population places them at higher
risk of hospitalization and institutionalization. Planning and integrating healthcare with
community-based services can address this issue with certain benefits of a healthier senior.

    12.0% of Yadkin County’s population is food insecure.

Individuals with Disabilities
In Yadkin County, 2,783 older adults (age 65 years and older) have a disability, representing
41.7% of the older adult population. Only 14.1% of the adult population (ages 18 to 64) and
4.9% of the child population (under age 18) have a disability. Table 16 below illustrates the type
of disability for each age group. A person may have more than one type of disability. The
American Community Survey (ACS) defines a cognitive disability as a physical mental or
emotional condition that causes a person to have serious difficulty concentrating, remembering
or making decisions [10].
Table 16: Disability by Type (2016)

                                        Population       Population Ages 18-
                                                                               Population 65+
                                       Under Age 18              64
                                        #        %          #          %        #          %
 Total Population by Age Group          8,299              22,573               6,675
 Total Population with a Disability       410    4.9%        3,188    14.1%     2,783     41.7%
   Hearing Difficulty                      51    0.6%         613      2.7%     1,093     16.4%
   Vision Difficulty                      101    1.2%         694      3.1%         738   11.1%
   Cognitive Disability                   318    3.8%        1,120     5.0%         745   11.2%
   Ambulatory Disability                   54    0.7%        1,694     7.5%     1,710     25.6%
   Self-care Disability                    88    1.1%         624      2.8%         621   9.3%
   Independent Living Difficulty           n/a     n/a       1,279     5.7%     1,116     16.7%
Source: US Census Bureau, ACS 2012-2016, Table S1810

                                                                                          P a g e | 27
Yadkin County
Grandparent Caregivers
Of the total grandparent population in the County (60 years of age and over), 23.7% (128
grandparents) are responsible for their grandchildren under age 18. This statistic represents 1.3%
of the total older adult population (ages 60 years and over). Table 17 below details specific
information about this group. 6.0% of the grandparent caregivers are minority; 15.3% live in
poverty; and 46.6% have a disability [10].
Table 17: Grandparent Caregivers (2016)
Grandparent Caregivers
Older Adult Population (60 years and over) 9,486
Grandparents responsible for Grandchildren (#) 128
Grandparents responsible for Grandchildren (%) 1.3%
Minority Population 6.0%
Speak other language than English 0.0%
Speak English less than very well 0.0%
Below
Source: Poverty
US Census LevelACS 2012-2016, Table S1002
Bureau, 15.3%
With any disability 46.6%
Family Caregivers
Family caregivers assist with daily activities, administer medications, and provide transportation,
financial support and companionship to a family member, friend or neighbor. One in four
persons in North Carolina report providing regular care for someone age 60 years or older.
Almost half are caring for someone with dementia [14]. The AAA provides support for
caregivers through home and
Community-based services
(HCBS) including respite
services, home-delivered meals,
adult day services, transportation
and in-home aid services.
1 in 4 people in North Carolina are caregivers
for an older adult age 60 years or older.
28 | P a g eYadkin County
References
[1] US Geological Survey, "NLCD 2011 Land Cover (2011 Edition, amended 2014)," Sioux
Falls, 2014.
[2] NC OSBM, "Sex and Single Years of Age (2000-2037)".
[3] Integra Service Connect, "Why Payers Should Care about the Social Determinants of
Health," 2015.
[4] U.S. Department of Housing and Urban Development, "Measuring the Costs and Savings
of Aging in Place," 2013.
[5] Robert Wood Johnson Foundation & University of Wisconsin Population Health Institute,
"2018 County Health Rankings North Carolina," 2018.
[6] Centers for Medicare & Medicaid Services, "Prevalence State/County Level: All
Beneficiaries by Age, 2007-2015," 2017.
[7] NC Department of Health and Human Services - Aging and Adult Services Division,
"County Expenditure Reports 2017," 2018.
[8] Centers for Medicare & Medicaid Services, "Medicare Enrollment Dashboard," 2017.
[9] The Cecil G. Sheps Center for Health Services Research, "NC Health Professions 2017
Data Book," 2017.
[10] US Census Bureau, American Community Survey (2012-2016), 2016.
[11] Centers for Disease Control and Prevention, "Health Disparities," 2017.
[12] AARP, "Food Insecurity Among Older Adults," 2015.
[13] Feeding America, "Food Insecurity in North Carolina," 2014.
[14] AARP, "Family Caregiving in North Carolina," 2008.
[15]
P a g e | 29This report was prepared by the Piedmont Triad Regional Council Regional Planning
Department with assistance from the Area Agency on Aging.
June 2018
About the Piedmont Triad Regional Council
The Piedmont Triad Regional Council (PTRC) is a voluntary association of local governments
comprised of municipal representatives, county commissioners, and other civic leaders who
function as the voice of the citizens of the Piedmont Triad. It serves 73 member governments
in the twelve-county area designated as Region G located in and around the Greensboro,
Winston-Salem, and High Point areas. There are 16 Regional Councils in North Carolina.
The PTRC is designated by the State of North Carolina to serve as the lead regional
organization for the Piedmont Triad region. Funded from federal, state, and local sources, the
PTRC houses the regional Area Agency on Aging and is engaged in workforce development,
data and information services, transportation planning, water resources, housing programs,
regional planning, criminal justice work, and technical assistance.
More information is located at http://www.ptrc.org or by contacting Matthew Dolge,
Executive Director, PTRC at 336-904-0300 or via email at mdolge@ptrc.org.You can also read