Diversification of the Hunter Economy - Post BHP 2011
←
→
Page content transcription
If your browser does not render page correctly, please read the page content below
The Hunter Valley Research Foundation
ABN 91 257 269 334
www.hvrf.com.au

Diversification of the Hunter
Economy – Post BHP

2011
Job no. 352/10

Diversification of the Hunter Economy
- Post BHP

Prepared for

By

ABN 91 257 269 334

PO Box 322
Newcastle NSW 2303
T:     (02) 4969 4566
F:     (02) 4969 4981
E:     info@hvrf.com.au
W:     www.hvrf.com.au

Report prepared: 2011

The information contained herein is believed to be reliable and accurate. However, no guarantee is given as to its
accuracy or reliability, and no responsibility or liability for any information, opinions, or commentary contained herein,
or for any consequences of its use, will be accepted by the Hunter Valley Research Foundation, or by any person
involved in the preparation of this report.
List of contents

1 Advantages of economic diversification ................................................................................................................ 1
2 The Hunter Region between 1950 and 1970 ......................................................................................................... 5
3 The Hunter Region between 1970 and 1995 ......................................................................................................... 7
4 The Hunter Region between 1995 and 2010 ......................................................................................................... 9
5 The Hunter Region 2011 and beyond.................................................................................................................. 13

       List of figures

Employment by sectors in the Ruhr area (% of total workforce, 1960 – 2006) .................................................... 2
Employment Change (% of total workforce) in Tyne and Wear County and
the Newcastle City Region ....................................................................................................................................... 3
GDP by economic sectors in 2005 for the Gulf Cooperation Council (GCC),
Canada, and Norway (2005, % of total GDP) ........................................................................................................ 4
Figure 1: Change in workforce by sectors in the Lower Hunter (% of total workforce) ..................................... 5
Figure 2: Production of Pig Iron and Steel ingots from BHP in the Newcastle works
(1950-1960, ‘000 Tonnes) .......................................................................................................................................... 6
Figure 3: Unemployment rate (monthly) in the Hunter Region and Australia
(1986-1994) .................................................................................................................................................................. 7
Figure 4: Change in the industrial structure of the Hunter Region labour force,
1976-1996 (% of total labour force) .......................................................................................................................... 8
Figure 5: Perceived effect of the BHP closure on the business owners, the Hunter Community,
and the Hunter economy ............................................................................................................................................ 9
Figure 6: Unemployment rate (monthly) in the Hunter Region and Australia,
(1995-2010) ................................................................................................................................................................ 10
Figure 7: Shifts in employment shares (% of total workforce) in the nine
biggest industry sectors in the Hunter .................................................................................................................... 10
Figure 8: Location quotients (Hunter against Australia) ...................................................................................... 11
Figure 9: Major sectors in the Hunter in 2006 and respective location quotients............................................... 12
Figure 10: Increasing economic diversity in the Hunter Region .......................................................................... 13
Figure 11: Challenge of an ageing population, Hunter Region............................................................................. 14
Figure 12: Regional underperformance in advanced education, 2006................................................................. 16
Diversification of the Hunter diversification have also been acknowledged for
a long time. Some of the benefits from economic
Economy – Post BHP diversification include:3
¾ Reduced exposure to negative external
shocks (these can be known, unknown,
1 ADVANTAGES OF ECONOMIC man-made or natural),
DIVERSIFICATION ¾ Increased productivity and competiveness,
¾ Less volatile growth and economic cycles,
The economic diversity of a region is a key
contributor to its long-term economic ¾ Economic stability and sustainability.
development and sustainability. There are
different ways to measure the degree of In contrast, high volatility caused by insufficient
economic diversification. However, there is broad economic diversification may result in structural
agreement that the less concentrated a region’s unemployment. Some researchers even suggest
economy is in any given industry sector, and the a negative relationship between diversification
smaller the contribution of each industry sector to and unemployment.4 Another important finding
the aggregate production in the region, the more is that when aiming for increased economic
diversified the region. diversity, policy makers may be confronted with
a trade-off between growth and stability. While
There are two approaches to measuring the focusing on industry sectors with comparative /
contribution of industry sectors to a region’s competitive advantages enhances growth,
production. These are through the measurement diversification in several industry sectors
of GRP (Gross Regional Product) shares for each enhances the stability of a region. This issue is
industry sector, and the measurement of re-addressed in the final section.
employment shares for each of these sectors. As
GRP data is difficult to reliably obtain for the Although economic diversification is essential for
Hunter Region, employment data is used here, a region’s prosperity, it is not the only factor to
and calculated for each industry sector and for be considered. For instance, the provision of
different time periods. Using this measure, appropriate regional infrastructure and a focus
economic diversity is defined “in terms of on education and innovation can be of at least
balanced employment across industry classes”.1 equal importance. Before examining the Hunter
For instance, if all employment in a region was Region in greater detail, international examples
concentrated in one sector only, the degree of (Case studies 1 and 2) are employed in order to
economic diversification in that economy would a. demonstrate the measurement of economic
be the lowest possible. However, should diversification,
employment be equally distributed among all
industry sectors, a perfect diversity would be b. show that countries and regions vary
obtained.2 The finding that the degree of significantly regarding the achieved degree
of diversity, and
economic diversification is positively correlated
with the long-term economic development of a c. give an example of structural changes that
region is largely uncontroversial among might occur in a region.
economists. The risks of insufficient
3
cf. e.g. Booz Allen Hamilton (2008), Economic diversification –
The road to economic sustainability, and
1
Attaran, M. (1987): Industrial diversity and economic Wagner, J., Deller, C. (1998): Measuring the effects of economic
performance in US areas, Annuals of Regional Science 20:44-54. diversity on growth and stability, Land Economics 74: 541-56.
2 4
Lee, S., Seo, J. and Webster, C. (2006): The decentralising cf. e.g., Savitz, R. (2010): The relationship between
metropolis: Economic diversity and commuting in the US suburbs, unemployment and economic diversification, International
Urban Studies 43: 2325-2549. Journal of Business Research 3.
Hunter Valley Research Foundation - Diversification of the Hunter Economy - Post BHP 1CASE STUDY 1: Structural change in
post-industrialised urban regions
The ‘Ruhr area’ in Germany
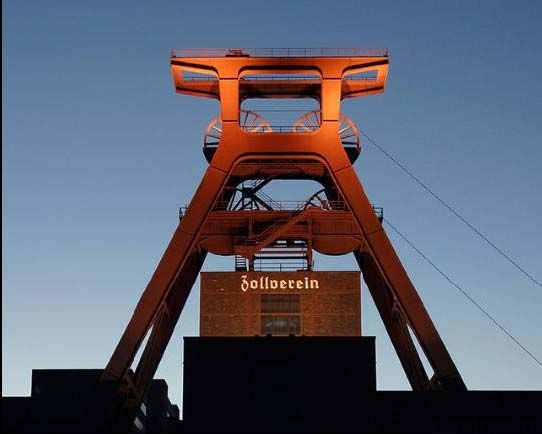
The ‘Ruhr area’ in Germany provides an example In 2010 the Ruhr area was named the European
of structural change undergone by many Capital of Culture, in which the Zollverein Essen
industrialised regions. In the Ruhr Area an is a famous location for architecture, creative
accelerated structural change occurred as a industries and modern culture.
result of the ‘coal crisis’ in the late 1950s. The
crisis started unexpectedly with the closure of pits
in the Ruhr Area in 1958, mainly due to the
declining competitiveness of the local coal mines.
Zollverein Essen: Part of the UNESCO World Heritage
Seventy-eight pits were lost in ten years and
employment in the mining industry declined by
more than half from 505,000 in 1960 to 242,000
in 1970. Consequently, structural change
occurred and employment in the area was mainly
based on the secondary sector until the 1980s.
Simultaneously, there was a major restructuring
of industry in that area towards communication
and information technologies. This continued
structural change led to a complete turnaround so
that today the Ruhr’s economy is mostly based
on service and high technology industries.
Employment by sectors in the Ruhr area (% of total workforce, 1960 ‐ 2006)
Hunter Valley Research Foundation - Diversification of the Hunter Economy - Post BHP 2Newcastle upon Tyne and the Tyne and Wear
area in the U.K.
During the Industrial Revolution in the 19th-
century, Newcastle upon Tyne and the Tyne and but still significant role in manufacturing. In
Wear area in the U.K. played an important role in contrast to the 90’s, the fastest growing
coal mining and manufacturing. However, the industries in the service based sector were
dominance of heavy industries declined in the financial intermediation, and real estate, renting
second half of the 20th century. By 1998 jobs in and business activities at that time. Like the
mining and quarrying had been reduced to 200 Ruhr area, the Tyne and Wear area is a prime
workers in Tyne and Wear ─ a decline of example of structural change from the primary
approximately 90 per cent from 1991. At the and secondary sectors towards the tertiary
same time, Tyne and Wear experienced a shift in sector. Both examples illustrate the potential,
employment shares to the secondary sector. and some challenges, for the Hunter Region.
Employment in manufacturing grew by The example of the Ruhr area shows the
approximately 7per cent in the region between transition from an economy mainly reliant on the
1991 and 1998, compared to a 2 per cent decline primary and secondary sectors towards an
in Great Britain as a whole. In contrast, the economy based on the service sector. For the
Finance and Business Services sector was Tyne and Wear Region the shift in employment
heavily underrepresented. The situation changed, share towards the tertiary sector is shown in
however, in the more recent period between greater detail in the chart below. An interesting
2003 and 2007. Due to the structural change finding is that manufacturing remained the
towards the tertiary sector, the employment share largest industry by employment share in the
in manufacturing fell by approximately 10 per Tyne and Wear City Region until 2007.
cent and Tyne and Wear played a less important
Employment Change (% of total workforce) in Tyne and Wear County
and the Newcastle City Region
Source: Tyne and Wear Research and Information (2010)
Hunter Valley Research Foundation - Diversification of the Hunter Economy - Post BHP 3CASE STUDY 2: Economic diversity –
International examples
The figure below shows three economic regions Norway managed to diversify well. In contrast,
with different degrees of economic diversification. the GCC relies heavily on oil, and may therefore
Firstly the poorly diversified Gulf Cooperation be more vulnerable to future shocks, such as a
Council (GCC) and, in contrast, the well price decline in the major traded commodity. It
diversified states of Canada and Norway. Poor is, however, evident from Norway’s example that
economic diversification in the GCC is evident being rich in a certain resource like oil need not
from the graph below. It is characterised by the necessarily be accompanied by a lack of
relatively large contribution of the mining sector economic diversification. Rather, policy makers
(in this case oil), and the relatively small working in regions that are rich in a particular
contribution of all other sectors to GCC’s GDP. In natural resource must be encouraged to be
contrast, in Canada and Norway the contribution especially conscious to diversify well.
of all industry sectors to these nations’ GDP is
almost equally distributed. An interesting aspect
of this comparison is that, although both the GCC
and Norway are particularly rich in oil, only
GDP by economic sectors in 2005 for the Gulf Cooperation Council (GCC),
Canada, and Norway (2005, % of total GDP)
Source: Booz Allen Hamilton (2008).
GCC: Gulf Cooperation Council (Qatar, Abu Dhabi, Kuwait, KSA, Oman, UAE, Bahrain, Dubai)
May not total 100% due to rounding
Hunter Valley Research Foundation - Diversification of the Hunter Economy - Post BHP 42 THE HUNTER REGION
¾ Shipping: Newcastle was Australia’s largest
BETWEEN 1950 AND 1970 export port by tonnages,
¾ Electricity: 80% of total requirements of
Dominance of primary and secondary NSW supplied by 1970,
industries ¾ Milk: 30% of the requirements of the NSW
As in many other regions, the Hunter experienced milk board supplied,
high population and employment growth, as well ¾ Wool: 20% of the NSW clip was sold at
as low unemployment rates during the post war Newcastle.
Source: HVRF
period. There was a significant shift from the
primary to the secondary sector. Income
The Region’s dominant role in production in the
generated by the primary sector peaked in 1952.
primary and secondary sectors was also
In this time period, the Hunter economy was of
apparent in the distribution of the Region’s
major importance to New South Wales and
workforce as shown in Figure 1. At that time,
Australia. This was mainly due to the Region’s
there was also a trend towards increasing
significant contribution to the State’s and
employment shares in the tertiary sector, in both
country’s production in a few key industries in the
Australia and the Lower Hunter.
primary and secondary sectors, as detailed
below. It is clear therefore that the economy was
However, the increase in employment share in
less diversified than today.
the tertiary sector was stronger nationwide than
Production during the 60’s and 70’s in the Hunter Region. Between 1954 and 1961
the secondary sector employment share
¾ Coal: Approximately 60% of NSW production, increased even further in the Hunter. This meant
and 40% of Australian production in the that the secondary sector was over-represented
1960s, and the tertiary sector under-represented in the
¾ Steel: 1.3 million tonnes of ingot steel Hunter Region compared to Australia.
produced in1960,
Figure 1: Change in workforce by sectors in the Lower Hunter (% of total workforce)
70
60
50
40
30
20
10
0
1954 1961 1971
Primary Secondary Tertiary
Source: Hunter Valley Research Foundation (HVRF); Australian Bureau of Statistics (ABS)
Refers to the city of Newcastle, Lake Macquarie, Port Stephens, Maitland and Cessnock
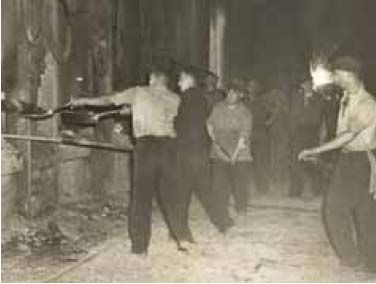
Hunter Valley Research Foundation - Diversification of the Hunter Economy - Post BHP 5The role of BHP in the Hunter
The developments at the BHP plant are
Workers at an Open Hearth Furnace pre 1960,
an example of the growth of the
BHP Billiton Archives
secondary sector during the 50’s and
60’s. Figure 2 illustrates the increasing
importance of BHP’s Newcastle
operations for the Hunter Region. The
output of steel ingots reached
approximately 1.3 million tonnes in 1960.
Marketable iron and steel products were
railway material, rods for wire drawing,
steel for tubemaking, tinplate, hot rolled
strip and merchant.
In 1960 BHP was the largest single
employer in the Commonwealth with the
exception of the public sector. It
employed 37,800 people, with about
12,000 of them in the Newcastle steel
works alone.
Source: History of Newcastle Steelworks, BHP Billiton
Figure 2: Production of Pig Iron and Steel ingots from BHP in the Newcastle works (1950‐1960, ‘000 Tonnes)
Source: HVRF
Hunter Valley Research Foundation - Diversification of the Hunter Economy - Post BHP 63 THE HUNTER REGION Between 1986 and 1990 ‒ a time of further tariff
reductions, labour market and financial
BETWEEN 1970 AND 1995 deregulation, the floating of the Australian
Dollar, and increased international trade ‒ the
The economic climate in the Hunter unemployment rate fell in both Australia and the
Although the unemployment rate is a lagging Hunter Region, but it still remained higher in the
indicator of the economic climate, it is still a Hunter.
measure which reflects the health of an economy.
From 1970 on, the unemployment rate rose During the recession in the early 1990s and in
significantly in the Hunter ‒ from only 1.7% in the following years, the unemployment rate
1971 to 5.7% in 1981. In the 70’s, manufacturing rose, with job losses being more severe in the
was still highly protected and tariffs quite high. Hunter Region, and unemployment peaking at
This changed from the 70’s onwards, which may 16.7% in February 1993. Part of the reason for
have led to a temporary rise in the unemployment the relatively worse economic situation in the
rate. Hunter during that period lay in the past, in that
between 1950 and 1970 employment shares
Consideration of monthly unemployment rates, were significantly higher in the secondary sector
which are available for the Hunter from 1986, and lower in the tertiary sector. A lack of skills
reveal that the unemployment rate was both among people who lost jobs in the primary and
higher and more volatile in the Hunter than in the secondary sectors, and who were not able to
nation. This is shown in Figure 3. However, the find work in the growing tertiary sector, can to
high volatility of the unemployment rate in the some degree explain the worse economic
Hunter may be partly due to the smaller sample development.
size.
Figure 3: Unemployment rate (monthly) in the Hunter Region and Australia ‐ (1986‐1994)
18.0
16.0
14.0
12.0
10.0
8.0
6.0
4.0 Australia Hunter
2.0
0.0
JUL 86
JUL 87
JUL 88
JUL 89
JUL 90
JUL 91
JUL 92
JUL 93
JUL 94
NOV 86
MAR 87
NOV 87
MAR 88
NOV 88
MAR 89
NOV 89
MAR 90
NOV 90
MAR 91
NOV 91
MAR 92
NOV 92
MAR 93
NOV 93
MAR 94
NOV 94
Source: ABS, HVRF
Hunter Valley Research Foundation - Diversification of the Hunter Economy - Post BHP 7Shift in employment share towards the tertiary Employment share in the already large
sector industries Wholesales and Retail and
In contrast to the period between 1950 and 1970, Community services rose. However,
which was characterised by a shift of employment employment share also increased in previously
to the secondary sector, the period between 1970 weak industries. For instance it doubled in the
and 1995 can be mainly characterised by a shift Finance and Recreation and personal services
from the secondary towards the tertiary sector. industries. This development, together with the
The drop in employment share in the secondary loss of employment share in previously large
sector in the Hunter from 24.6% in 1976 to only industries such as Manufacturing, contributed to
14.1% in 1996 represents the decline in the an increased diversification of the Hunter
proportion of jobs in Manufacturing shown in economy.
Figure 4.
Moreover, it is important to note that, although
This percentage drop also captures the job employment share remained higher in the
losses at the BHP Newcastle plant at that time. secondary sector and lower in the tertiary sector
Growth at the plant had continued until during this period in the Hunter compared to
approximately 1975, when the plant achieved Australia, the shift towards the tertiary sector
record results, with over two million tonnes of was relatively stronger in the Hunter Region.
output. However, the plant was not able to build This shift, and the consequently increased
on the past years’ success. By the 1980s, many diversification, provided a driving force for the
coke ovens, blast furnaces, brick plant and brass economic recovery in the Hunter in the following
foundries were closed, and between 1981 and period (1995-2010). The next section will focus
1985 more than 5,000 jobs were lost. on both the improving economic diversification
and economic climate in this period.
The decline in jobs in the secondary sector was
accompanied by growth in the tertiary sector.
Figure 4: Change in the industrial structure of the Hunter Region labour force,
1976‐1996 (% of total labour force)
Source: HVRF, ABS
Hunter Valley Research Foundation - Diversification of the Hunter Economy - Post BHP 84 THE HUNTER REGION Improving economic situation
Despite the fears of the community, the labour
BETWEEN 1995 AND 2010 market did not confirm the pessimistic view.
Between 1995 and 2010, the unemployment
The closure of the BHP Steelworks rate fell more rapidly in the Hunter than
One of the most significant events which Australia as a whole, and was lower than the
occurred in the Hunter Region in the period nationwide figure in 2010 (Figure 6). One key
between 1995 and 2010 was the closure of BHP factor contributing to the strong improvement in
Steelworks in 1999 (rod production remained). the economic climate in the Hunter during
This had been announced two years in advance. recent years has been the painful, but
By the time of the actual closure, the direct and unavoidable, structural changes made in the
indirect job losses were expected to total 4,500. past. These structural changes included
However, employment at BHP started to decline significant job cuts in manufacturing (e.g. in the
a long time before (as described in the previous BHP plant), accompanied by a strong shift in
section). employment share towards the tertiary sector.
This led to the achievement of an advanced
In 1998 an online survey of the business stage of economic diversification.
community, and members of the Hunter
community, was undertaken to examine the Shift in employment share towards a
perceived likely effect of the BHP closure. The diversified economy
majority of people who took part in the survey Significant gains in employment have been
were fearful of potential negative impacts of the achieved in the Health care & social assistance
BHP closure, especially of the effect on the industry (plus 19,000), which is the largest
Hunter economy, with the perception of business industry in the Hunter by employment share
representatives being the least negative. The today. Employment also grew in Construction
results of the survey are shown in Figure 5. (plus 14,500), Education & training (plus
10,700), and Professional, scientific & technical
services (plus 9,200) over the past 15 years.
The relevant shifts in employment shares are
shown in Figure 7.
Figure 5: Perceived effect of the BHP closure on the business owners,
the Hunter Community, and the Hunter economy
Source: HVRF; 126 business community representatives and 231 members of
the Hunter community answered on the Hunter Pulse online survey in 1998
Hunter Valley Research Foundation - Diversification of the Hunter Economy - Post BHP 9Figure 6: Unemployment rate (monthly) in the Hunter Region and Australia ‐ (1995‐2010)
14.0
12.0
10.0
8.0
6.0
4.0
Hunter Australia
2.0
0.0
MAY 96
MAY 98
MAY 00
MAY 02
MAY 04
MAY 06
MAY 08
MAY 10
JAN 95
JAN 97
JAN 99
JAN 01
JAN 03
JAN 05
JAN 07
JAN 09
SEP 95
SEP 97
SEP 99
SEP 01
SEP 03
SEP 05
SEP 07
SEP 09
Source: ABS, HVRF
However, simply using Figure 7: Shifts in employment shares (% of total workforce) in the nine
employment shares of
biggest industry sectors in the Hunter
industry sectors, does not
allow a measurement of the
degree of economic
diversification in the Region
compared to other regions.
Therefore, in order to
measure employment shares
in the Hunter compared to
Australia, the location
quotient is introduced into
the analysis as a measure of
relative economic diversity.
Economic analysis using
location quotients shows that
employment shares of
industry sectors in the
Hunter became increasingly
similar to the nationwide
shares.
Source: ABS, Monthly Labour Force Survey; an average of quaterly data is used for 2010
Hunter Valley Research Foundation - Diversification of the Hunter Economy - Post BHP 10Figure 8: Location quotients (Hunter against Australia) Source: ABS, Monthly Labour Force Survey; an average of quarterly data is used for the year 2010 The location quotient is the fraction of the Hunter’s employment in a given industry divided by the fraction of Australia’s employment in the same industry and in the same year. For instance, a location quotient of 1 would mean that employment shares are the same for the Hunter and Australia There was a clear trend in the 18 industry Hunter Region. Although the employment share sectors for previously high location quotients to fell in this industry, the decline was worse in fall and vice versa. For instance, it can be other Australian regions. This becomes clear gathered from Figure 8 that the Region’s relative from Figures 7 and 8. While the employment high employment share in Mining declined share in manufacturing in the Hunter was still compared to other Regions. The employment pretty much in line with the nationwide share in share in that industry was 3.9 times higher in the 1996, it outperformed the nationwide share by Hunter compared to Australia in 1996, and was the factor 1.22 (22%) in 2010. only 2.53 times higher in 2010. In contrast, employment shares in the Manufacturing, Health When the more detailed ANZSIC 2006 Full care & social assistance, and Education & Classification (including 720 groups and training industries increased relative to the classes) of industry sectors is employed, it is national share. Between 2007 und 2010 possible to work out a more detailed list of the approximately 10,000 jobs have been created in most important ‘industries’ in the Hunter Region. Manufacturing in the Hunter. This can to some The largest by employment numbers in 2006 degree be associated with local efforts to were: generate employment and to stimulate ¾ Hospitals (except Psychiatric Hospitals) investment in local industries, e.g. through the (9,464) ‘Hunter Advantage Fund’ or ‘HunterNet’ ‒ a ¾ Coal Mining (6,910) network of over 150 manufacturing firms in the ¾ Supermarket and Grocery Stores (6,644) Hunter Valley Research Foundation - Diversification of the Hunter Economy - Post BHP 11
¾ Primary Education (5,049)                                     shares and the respective relative employment
¾ Takeaway Food Services (5,009)                                shares (i.e. the location quotients). Employment
¾ Secondary Education (4,766)                                   shares were significantly higher in Coal Mining
¾ Aged Care Residential Services (4,395)                        (9.45) and Iron Smelting and Steel
¾ Road Freight Transport (4,171)                                Manufacturing (2.58) in the Hunter. Defence
¾ Cafes and Restaurants (4,009)                                 (1.7) was also relatively strong. This is partly
¾ House Construction (3,966)                                    due to the presence of the Singleton Army
¾ Local Government Administration (3,747)                       Camp and the Williamtown RAAF Base in the
¾ Other Social Assistance Services (3,626)                      Region. Although high, employment shares in
¾ Accommodation (3,340)                                         the other groups and classes correspond, more
¾ Defence (3,061)                                               or less, with nationwide shares. The respective
¾ State Government Administration (2,960)                       location quotients are closer to one (0.8 - 1.3).
¾ Pubs, Taverns and Bars (2,639)                                The same method can be used to detect
¾ Iron Smelting and Steel Manufacturing                         industries with relatively low employment shares
  (2,634)                                                       in the Hunter, and relatively high shares
¾ Higher Education (2,578)                                      nationwide. These include (location quotients in
¾ Department Stores (2,496).                                    brackets): Banking (0.49), Central Government
                                                                Administration (0.62), Computer System Design
In order to examine the relative employment                     and Related Services (0.46) and Legal Services
shares in these large industries in the Hunter,                 (0.75).
Australian employment shares are used as a
benchmark. Figure 9 shows the employment

                Figure 9: Major sectors in the Hunter in 2006 and respective location quotients

              Source: HVRF, ABS (ANZSIC 2006 Full Classification)

Hunter Valley Research Foundation - Diversification of the Hunter Economy - Post BHP                        12
The Region’s increasing diversification in the last The appropriate policy mix to promote balance
15 years is made clearer when the variability of between growth and stability of a region is an
the location quotients between industry sectors is open question in research, and is discussed in
observed. It is evident from Figure 10 that the the next section.
range of location quotients becomes significantly
narrower across industry sectors over time. 5 THE HUNTER REGION 2011
Accordingly, on average, the difference in
employment shares between the Hunter and
AND BEYOND
Australia decreased over time.
Future risks and challenges for
Figure 10: Increasing economic diversity in the Hunter Region the Region
Risks for continued economic
development in the Hunter may
arise from known and unknown
sources, and can be man-made
or natural. Although natural
disasters can have a severe
negative impact on the economy,
they will not be discussed further
here. Some potential man-made
risk factors for the Hunter include:
¾ Intensified Asian competition
for manufacturing and other
low-skilled industries,
¾ Eventual mine closures,
¾ Price changes in main traded
Source: ABS, HVRF commodities (e.g. carbon
As a measure of variability of the location quotients of industry sectors for a costs due to a transition to a
given year, the standard deviation has been used. Note: In 1976 the economy
low carbon economy, or a
was split into 13 instead of 18 industry sectors
collapse in mineral demand),
The structural change in the Region and the ¾ Technological obsolescence.
increasing employment in some industries, for
Further risks may arise from contagion effects,
instance in Health care & social assistance and
i.e. the spill over of the poor development of one
Education & training, contributed to both a higher
economic sector to other sectors of the
degree of diversification and a declining
economy. However, contagion is most likely in
unemployment rate in the Hunter (Figure 6).
concentrated, poorly diversified economies and
Compared to past periods, the economy is a lot
therefore less likely in the Hunter economy.
more diversified today and, therefore less
vulnerable to future shocks and economic cycles. Another major challenge for the Hunter Region
However, despite a higher degree of arises from an emerging shortage of a skilled
diversification, employment in certain heavy workforce, which is already an issue today.
industries in the Hunter (mainly mineral and Given the demographic change shown in Figure
related industries) remains relatively high. This is 11, this may become an even more severe
mainly due to the strong global, and especially challenge in the future.
Asian, demand for commodities, and coal in
particular.
Hunter Valley Research Foundation - Diversification of the Hunter Economy - Post BHP 13Figure 11: Challenge of an ageing population, Hunter Region
Change in resident numbers by age cohort, from CY2006
17,500
15,000 Change over 5 years
Change over 10 years
12,500
Change over 25 years
10,000
7,500
5,000
2,500
-
-2,500
+
4
9
4
9
4
9
4
9
4
9
4
9
4
9
4
9
4
-1
-1
-2
-2
-3
-3
-4
-4
-5
-5
-6
-6
-7
-7
-8
5-
0-
85
10
15
20
25
30
35
40
45
50
55
60
65
70
75
80
Age Cohort
Source: HVRF, ABS
The changing composition of the population also For example, like Norway discussed in case
means rising service demands of an ageing study 2, the Hunter Region is rich in natural
population. Thanks to the growing importance of resources (e.g. coal). Despite being a much
the Health Care & social assistance industry that smaller economic area, the Region has
has been identified in the Hunter, the Region is achieved considerable progress in its economic
able to meet some of this demand. However, diversification. However, it is also clear from the
challenges arising from the demand of an ageing analysis in the previous section that some
population need to be analysed in detail, and industry sectors are still under-represented in
additional measures need to be implemented to the Hunter.
avoid negative consequences, such as excessive
financial burdens on the working population. While continuous efforts are required to advance
economic diversification, specialisation of
Maintaining the achieved diversification and industries within the regional economy, based
comparative / competitive advantages of the on competitive and comparative advantages
Region (mainly in mineral and related industries), will
Historical developments described in the previous remain imperative for growth and employment in
sections suggest that the diversification of the the Region. This, however, implies that policy
local economy is a key factor contributing to makers may be confronted with a trade-off
positive economic development, and it also will between policy measures that promote
remain a major factor in the future. Structural economic diversification and specialisation, i.e.
change is a continuous process, rather than a between the goals of stability and growth of the
historical event. Therefore, policy makers should Region. Research suggests that the
ensure that there is continuous improvement in simultaneous pursuit of growth and stability is
the economic diversification in the Region. not necessarily contradictory:
Hunter Valley Research Foundation - Diversification of the Hunter Economy - Post BHP 14¾ Short-run policy can be more growth ¾ Research by the HVRF emphasises
orientated by specialising in selected growth increasing output and employment
industries. Some of the current areas of generated by both current operations and
specialisation in the Hunter are5 building future development projects at the
societies, aluminium smelting, coal mining, Newcastle Port. Development of the port is
explosive manufacturing, iron and steel likely to continue due to a strong global
forging, mining and construction machinery (especially Asian) demand for domestic
manufacturing, poultry farming (meat), horse commodities (e.g. coal). In addition, the
farming and fossil fuel electricity generation. port’s role for the tourism industry may
continue to increase as cruise ships visit
¾ Diversification policies should be the long-run Newcastle as part of their itinerary.
envelope of the Region’s short-run efforts.
¾ The proposed High-speed Rail (HSR)
Generating growth from existing and planned system is likely to have a positive impact on
infrastructure – some illustrative examples output. With travel times reduced by
Both the Hunter Region’s existing infrastructure approximately half, long distance commuters
and its planned infrastructure projects are will be better off, and a broader choice of
essential to put the regional economy on course employment opportunities will arise for
for long-term growth and sustainable economic residents.
development. In order to achieve these goals, it is
imperative to provide appropriate infrastructure ¾ A significant infrastructure project in the
goods and services that enable economic Region is the scheduled Hunter Expressway
diversification. Thanks to its existing and future between the F3 Freeway near Seahampton
stock of infrastructure, the Region is well placed. and the New England Highway west of
However, in order to push the Region’s output Branxton. The project will significantly
further ahead, additional investment in reduce travel times between Newcastle and
appropriate infrastructure is required. In general, Branxton.
infrastructure investments contribute to
increasing output by increasing the productivity of ¾ The Newcastle University City campus
the workforce and invested capital. Economic project is expected to be positive for both the
theory also posits that investments in Newcastle city centre and the Hunter Region
infrastructure goods and services contribute to as a whole. In general, investments in
attracting (foreign) direct investments and education infrastructure and goods and
businesses. Some illustrative examples of the services which increase the productivity of
positive impacts of the Region’s infrastructure the workforce have a high impact on output.
are:
Further investments in the knowledge
¾ The National Broadband Network (NBN) may and educational sectors necessary
help to reduce the persistent competitive Because of their high productivity-enhancing
advantage companies and residents of major impacts, additional investments in education
cities (e.g. Sydney or Melbourne) have, due infrastructure should be considered. This is all
to faster and cheaper internet access. the more important as, due to the structural
Although the NBN will help increase the profile of the Region, the level of advanced
productivity of the private sector nationwide, education has been substantially below that of
productivity gains may be higher in regional the State (Figure 12).
areas like the Hunter.
5
For these sectors the location quotient (ANZSIC 2006 ‐ Full
Classification) is found to exceed 5.
Hunter Valley Research Foundation - Diversification of the Hunter Economy - Post BHP 15As future markets are likely to require a well- broader range of industry sectors – helps to
educated and highly skilled workforce, mitigate extreme, negative employment impacts
augmenting the education sector through resulting from worsening economic conditions.
additional investments will prove fruitful for Now, when the economy in the Hunter is strong,
meeting the demands of industry, which will is the best time to advance to the next stage of
contribute to a strong and sustainable regional economic diversification.
economy. Given the time lags inherent in
increasing human capital, investments in schools, This occurs most effectively if considerable
educational institutions and universities need to investments are made in appropriate
be made today, in order to have a highly skilled infrastructure sectors, some of which have been
workforce available for the unknown future identified above. In addition, measures aimed at
demands of the Region’s economy. strengthening relatively weak industry sectors in
the Hunter (e.g. Arts & recreation services,
The importance of further improving the Financial & insurance services, Information
education levels of the local workforce for positive media & telecommunications) will help the
economic development must not be under- Hunter Region to achieve the goal of increasing
estimated. In this respect, both absolute and economic diversification further. This increases
relative employment growth in the education and the probability that the Hunter economy will be
training industry in the Hunter compared to well placed to minimise the impacts of future risk
Australia deserve emphasis (Figures 7 and 8). factors and unforeseeable structural changes.
Future risks and negative economic
developments, like those described in section
three, can be reduced by augmenting ‘knowledge
based industries', and having a well-educated
and highly skilled workforce. In addition, a well-
diversified economy – one that is based on a
Figure 12: Regional underperformance in advanced education, 2006
Post-school qualifications
Postgrad
Hunter
NSW
Grad Dipl
Bachelor
Adv Dipl & Dipl.
Cert (III & IV)
Cert (I & II)
Cert (nfd)
0% 5% 10% 15% 20%
Percent of Hunter residents aged 15 years +
Source: HVRF, ABS Census of Population and Housing (2006)
Hunter Valley Research Foundation - Diversification of the Hunter Economy - Post BHP 16You can also read