Comparative Studies of the Catch Loss of Longfin Inshore Squid when Using the TI Cable Grid in the Bottom Trawl Fishery - Northeast Fisheries ...
←
→
Page content transcription
If your browser does not render page correctly, please read the page content below
Northeast Fisheries Science Center Reference Document 20-02

   Comparative Studies of the Catch Loss
    of Longfin Inshore Squid when Using
the TI Cable Grid in the Bottom Trawl Fishery

        by HO Milliken, N Hopkins, E Matzen, E Keane

                          August 2020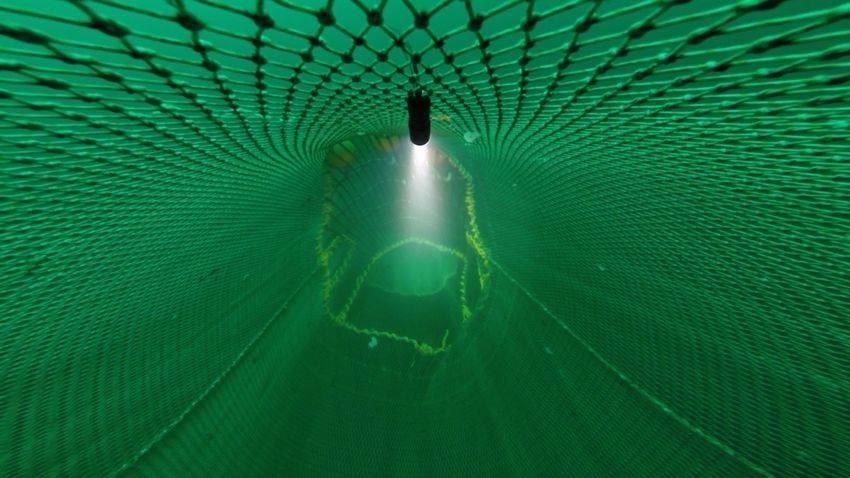
Northeast Fisheries Science Center Reference Document 20-02

   Comparative Studies of the Catch Loss
    of Longfin Inshore Squid when Using
the TI Cable Grid in the Bottom Trawl Fishery

                 by 1HO Milliken, 2N Hopkins, 1E Matzen, 3E Keane
 1
  NOAA Fisheries, Northeast Fisheries Science Center, 166 Water Street, Woods Hole, MA 02543
             2
              NOAA Fisheries, Southeast Fisheries Science Center, Mississippi Laboratories.
                               202 Delmas Ave. Pascagoula, MS 39568.
 3
     NOAA Fisheries, Greater Atlantic Regional Office, 55 Great Republic Drive, Gloucester, MA 01930

                             US DEPARTMENT OF COMMERCE
                       National Oceanic and Atmospheric Administration
                              National Marine Fisheries Service
                             Northeast Fisheries Science Center
                                 Woods Hole, Massachusetts

                                           August 2020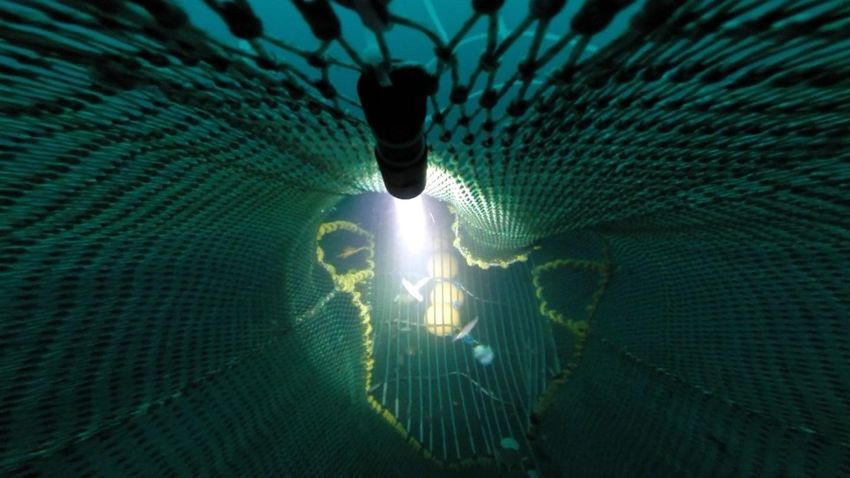
Northeast Fisheries Science Center Reference Documents
This series is a secondary scientific series designed to assure the long-term documentation and
to enable the timely transmission of research results by Center and/or non-Center researchers,
where such results bear upon the research mission of the Center (see the outside back cover for
the mission statement). These documents receive internal scientific review, and most receive
copy editing. The National Marine Fisheries Service does not endorse any proprietary material,
process, or product mentioned in these documents.

If you do not have Internet access, you may obtain a paper copy of a document by contacting
the senior Center author of the desired document. Refer to the title page of the document for
the senior Center author’s name and mailing address. If there is no Center author, or if there is
corporate (i.e., non-individualized) authorship, then contact the Center’s Woods Hole
Laboratory Library (166 Water St., Woods Hole, MA 02543-1026).

Information Quality Act Compliance: In accordance with section 515 of Public Law 106-554,
the Northeast Fisheries Science Center completed both technical and policy reviews for this
report. These predissemination reviews are on file at the NEFSC Editorial Office.

This document may be cited as:

        HO Milliken, N Hopkins, E Matzen, E Keane. 2020 Comparative studies of the catch loss
        of longfin inshore squid when using the TI Cable Grid in the bottom trawl fishery. US
        Dept Commer, Northeast Fish Sci Cent Ref Doc. 20-02; 24 p. Available from:
        https://www.fisheries.noaa.gov/new-england-mid-atlantic/northeast-fisheries-science-
        center-publications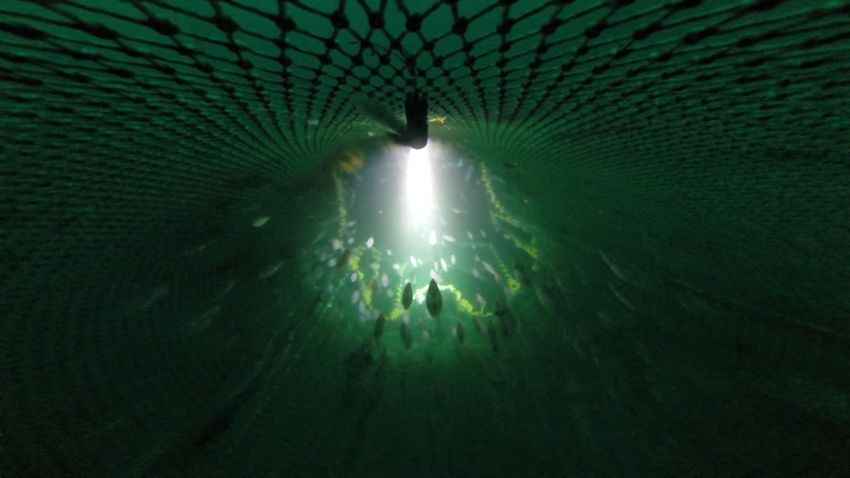
TABLE OF CONTENTS
LIST OF TABLES AND FIGURES 1
ABSTRACT 2
BACKGROUND 3
METHODS 3
RESULTS 4
DISCUSSION 6
ACKNOWLEDGEMENTS 6
REFERENCES CITED 7
LIST OF TABLES AND FIGURES
Table 1. Characteristics of the two-seam, D. pealeii twin trawl, and F/V Karen Elizabeth ........... 8
Figure 1. Location of hauls completed during the study. 9
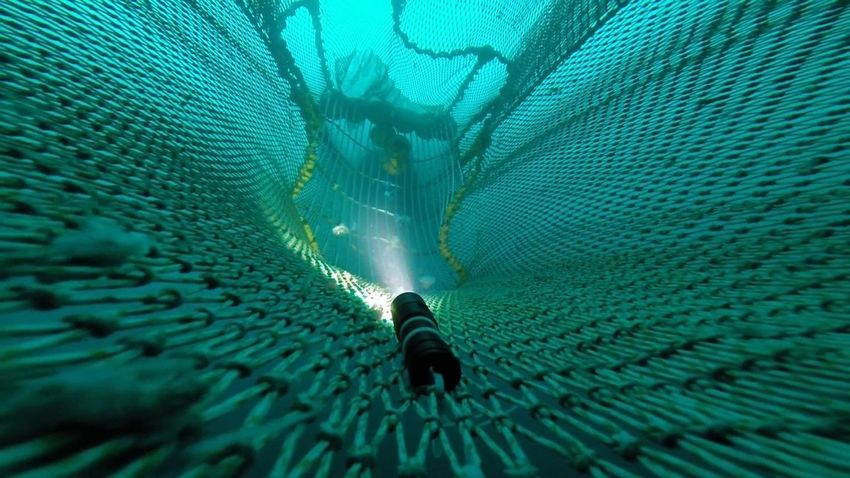
Figure 2. Net diagram for test of I Cable TED. ............................................................................ 10
Figure 3. TI cable grid configuration tested in 2017. ................................................................... 11
Figure 4. TI cable grid configuration tested in 2018. ................................................................... 12
Figure 5. NET I grid “original configuration” with twelve 11”-floats.. ....................................... 13
Figure 6.NET I grid with three floats removed from center of grid. ............................................ 13
Figure 7. TI grid configuration for all tows in 2018 fishing. ........................................................ 14
Figure 8. Longfin squid catch results for all tows in 2017. .......................................................... 15
Figure 9. Benthic invertebrate catch results in 2017..................................................................... 16
Figure 10. Finfish catch results in 2017.. ...................................................................................... 16
Figure 11. Longfin squid catch in 2017 after removal of floats.. ................................................. 17
Figure 12. Longfin squid length frequency in 2017. .................................................................... 18
Figure 13. Sum of the weights of individual finfish species and invertebrate/trash complex in
2017............................................................................................................................................... 19
Figure 14. Longfin squid catch results for all tows in 2018. ........................................................ 20
Figure 15. Finfish catch results for all tows in 2018..................................................................... 21
Figure 16. Sum of the weights of individual finfish species and invertebrate/trash complex in
2018............................................................................................................................................... 22
Figure 17. Invertebrate and trash catch results for all tows in 2018. ............................................ 23
Figure 18. Longfin squid length frequency in 2018. .................................................................... 24
1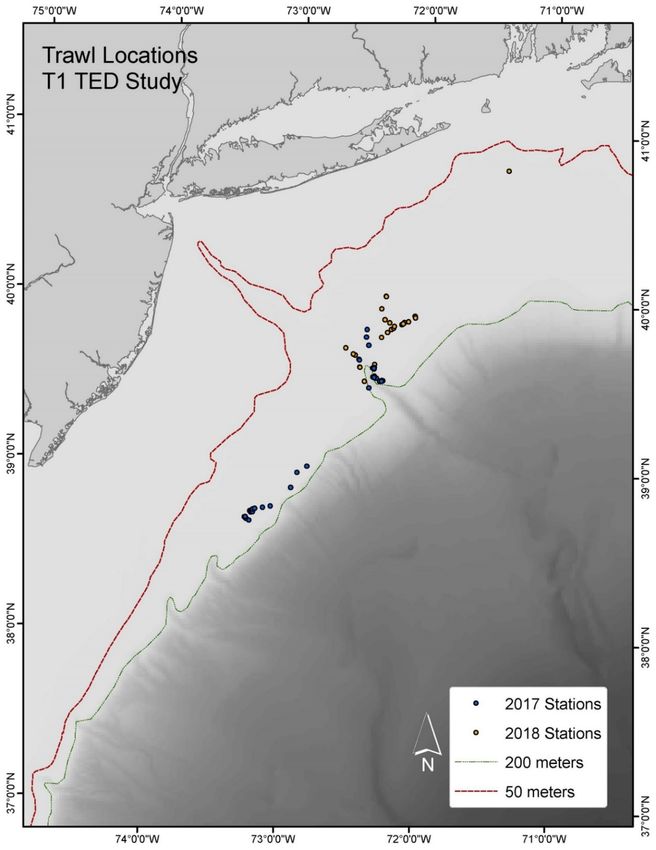
ABSTRACT
        NOAA Fisheries’ Northeast Fisheries Science Center (NEFSC) with the assistance of the
Southeast Fisheries Science Center (SEFSC) is investigating the target catch efficiency of cable
Turtle Excluder Devices (TEDs) in the Northeast and Mid-Atlantic longfin inshore squid
(Doryteuthis [Amerigo] pealeii) fishery. These cable TEDs are a substantial improvement over
rigid TEDs previously tested in this fishery because the cable TEDs reduce operational and safety
issues. The NEFSC chartered the F/V Karen Elizabeth, a twin trawl vessel (capable of towing 2
nets simultaneously), to evaluate the catch rates of trawl nets equipped with a cable grid
(experimental) to identical nets without a TED installed (control). This work occurred in southern
New England waters in October 2017 and 2018. The vessel completed 38-paired tows in 5 days in
2017 and 30-paired tows in 6 days in 2018. Results from the work in 2017 showed that the cable
TED-equipped net caught similar quantities of longfin inshore squid as the control net but also
caught an increased number of benthic species. A modification was made to the floatation to
address the increase in benthic species catch. This modification was tested during the latter portion
of testing in 2017 and was successful at reducing the quantity of benthic species caught. The
modified gear was tested again in 2018 with 1 additional modification: the TED escape opening
was switched to the bottom. The 2018 work again showed that the experimental net caught similar
quantities of longfin inshore squid as the control net. In addition, it did not result in an increase of
benthic species caught.

                                                   2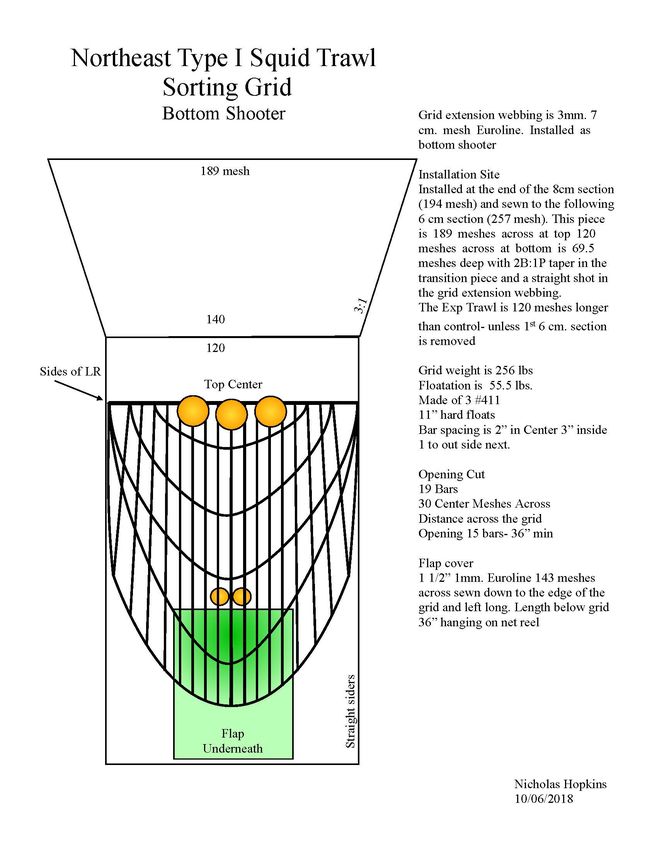
BACKGROUND
        NOAA Fisheries is working to develop and implement bycatch reduction measures for
trawl fisheries in the Mid-Atlantic and Gulf of Mexico when and where sea turtle bycatch has
occurred or where similarities exist between a particular trawl fishery and a trawl fishery where
sea turtle bycatch has occurred (74 FR 21627, May 8, 2009). In the Greater Atlantic Region (Maine
through Virginia), NOAA Fisheries currently requires the use of a Turtle Excluder Device (TED)
in the summer flounder trawl fishery in the Mid-Atlantic south of Cape Charles, VA, during
particular times of the year.
        Our objective is to find a technology that excludes sea turtles while maintaining target
catch. Previous work (DeAlteris and Parkins 2010) with a rigid TED in the longfin inshore squid
fishery suggested that TEDs might maintain the targeted squid catch. Several operational issues
were observed during those studies, and cable TED designs were identified as a possible way to
reduce those issues. The cable TED is more robust, easily wraps on the net drum, and is less prone
to damage. A 2010 workshop with the fishing industry concluded that the industry members
present preferred cable TED designs, over rigid TED designs (DeAlteris 2010).

METHODS
        In mid-October 2017 and 2018, a paired-tow study was conducted out of Point Judith, RI,
with a 24-m twin trawler, the F/V Karen Elizabeth, from the Doryteuthis (Amerigo) pealeii
(longfin inshore squid) fishing fleet. A twin trawl vessel is capable of pulling 2 nets
simultaneously. The twin trawl method was used to give both treatments an equal chance of
catching the species available on any given tow. Both bottom trawl nets, constructed by Superior
Trawl of Point Judith, RI, were identical 2-seam, 2-bridle “rope trawls” used in the longfin inshore
squid fishery. Sampling stations were selected by the captain to reflect areas fished by the fleet
and with the objective of capturing longfin inshore squid during each tow. The same individual
conducted all tows to ensure consistent setting and hauling of the gear. Thirty-eight paired tows
were completed in 2017 from the Hudson Canyon area at depths ranging from 77 to 146m (Figure
1). Thirty paired tows were completed in 2018 near the Hudson Canyon and Berkeley Canyon -
Spencer Canyon areas in 64 to 121m. The gear and vessel characteristics are provided in Table 1
and Figure 2. A stainless steel Type I cable grid (TI), designed and built by Nick Hopkins at NOAA
Fisheries’ Southeast Fisheries Science Center (SEFSC) Harvesting Systems Unit (HSU), was laced
into the body of one net (Figure 3 and 4). The TI cable grid is similar to a cable TED successfully
tested in the croaker fishery.
        The TI cable grid extension webbing is 3 mm diameter, 7-cm Euroline trawl mesh. It
replaced the last section of the rope trawl that measures 189 meshes across at top, 120 meshes
across at bottom, and 69.5 meshes deep with a 2B:1P taper. The grid weighs 256 lbs. and is spliced
316 stainless steel cables. Bar spacing is 2” in center and 3” inside 1 to outside next (see Figure
3). The opening cut has 19 bars and 30 center meshes across the grid. The escape opening is 15
bars 36” minimum, and the flap cover is 1 1/2” 1 mm Euroline, 143 meshes across sewn down to
the edge of the grid and left long. The flap length below the grid is 36” hanging on net reel.
        The 2017 configuration was installed as a “Top Shooter” (escape panel on top). Float
location in the original configuration was twelve 11” #411 hard floats with 222 lbs. of buoyancy.
This configuration was fished for pairs 1-14 and 17-20. During the study, the experimental grid
was modified twice to improve the performance by reducing the catch of benthic species. This

                                                 3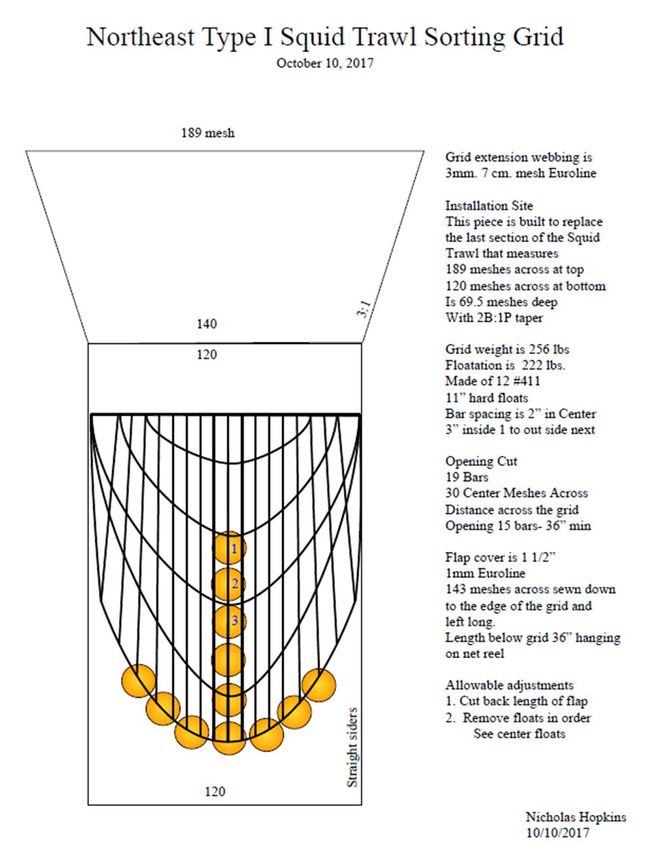
adjustment resulted in 3 configurations tested to various degrees over the course of the study. A
GoPro Hero 3+ camera was used to collect video data to inform modifications. During the first 14
comparisons, the TI was fished with 12 floats (222 lb. of buoyancy) (Figures 3 and 5). In an attempt
to reduce the belly contact with the seafloor and thus reduce bycatch of benthic species, 4
additional floats were added to the grid (16 floats at 296 lbs. of buoyancy). This configuration was
only fished for 2 comparisons (hauls #15-16) because the bycatch from seafloor contact of benthic
species actually increased and the video data showed an increased silt cloud higher in the net. On
haul #20, 3 center floats were removed from the original configuration in an attempt to reduce drag
from floats in the center of the grid (9 floats at 166 lbs. buoyancy). This 3-float configuration was
fished for the remaining 18 comparisons and seemed to reduce the belly contact with the seafloor
and benthic bycatch. (Figure 6)
        In 2018, the TI cable grid was installed as a “Bottom Shooter” (escape panel on bottom)
with three 11” hard floats fastened to the top of the grid frame for 55.5 lbs. buoyancy. The escape
panel characteristics remained the same as described in 2017. This design was selected to help
further reduce the bycatch of benthic species. This configuration was fished throughout the 2018
study (Figure 7).
        The experimental and control nets were towed at 3 knots simultaneously for about 1 hour
of bottom time. The speed is typical of the vessels in the fishery while the duration was
standardized to 1 hour. Net touchdown and lift-off were determined from the Simrad ITI screen
display of the trawl location. The Simrad ITI is a trawl positioning and monitoring system designed
to improve control and efficiency in trawling. The paired nets were switched from port and
starboard with an ABBA configuration where “A” is the net equipped with the TED and “B” is
the net without a TED. This system helps to reduce bias associated with fishing on either side of
the vessel while reducing the number of net changes required.
        The data recorded for each comparative tow included catch, position, time, depth,
temperature, and weather. The catch data included species caught, weight, and length frequency.
For each haul and from each net individually, the total catch was sorted into bushel baskets and
weighed on a Marel motion-compensated, platform scale beginning with the starboard catch.
Longfin inshore squid catches were weighed after sorting. Dorsal mantle lengths (DML) were
collected by net prior to sorting every tow from random subsamples of approximately 200
individuals. Dorsal mantle lengths were measured to the nearest cm. A custom conveyor system
brought catch from the deck to a sorting conveyor where it was hand separated by species and
weighed. Using this method, actual weights were obtained from all catch except for 1 tow that
encountered a large school of spiny dogfish. In this case, an average weight of the dogfish was
obtained and multiplied by the count of individuals.

RESULTS
2017
        Thirty-eight paired tows were completed over 5 days between October 16 and October 20,
2017. Of the 38 tows, 29 were deemed “good” tows, i.e, tows where no traps or damage to the gear
(e.g., holes or tears in the webbing, clogging by fishing gear) occurred that might have affected
performance. The number of tows removed was conservative as many of these pairs were likely
unaffected or minimally affected by the issue. Tows were analyzed together. Those tows that
occurred before the removal of the 3 floats and those that occurred after were also analyzed
separately.

                                                 4
When all tows were combined, total squid catch was comparable between the experimental
and control gear (Figure 8). Longfin inshore squid catch was not negatively affected by the addition
of the TI cable grid. During the first 17 tows with the original float configuration, it was evident
that the TI cable grid-equipped trawl was catching more benthic bycatch compared to the standard
(control) net (Figures 9 and 10). This bycatch was a concern to the fishermen, because it meant
more sorting time and potential damage to the squid product. Initially, there was an attempt to
remedy this issue by adding more floats. When this approach failed to reduce the bycatch, these
floats were removed and video was reviewed to investigate what was causing the problem. It was
determined that the added floats were causing drag, pulling on the headrope and causing the net to
contact the sediment. These additional floats and 3 others were removed, and the remainder of the
tows completed. The removal of the 3 floats reduced the catch of benthic invertebrates (Figure 9)
and benthic finfish (Figure 10) so the numbers were closer to those caught by the control net (mean
of 11.6 lb) and the experimental (mean of 18.9 lb [P
DISCUSSION
        The TI cable grid initially tested in 2017 did not substantially reduce the targeted longfin
inshore squid, but there was concern that the catch from the trawl equipped with the TI cable grid
was “dirty” (lots of bycatch) compared to the control trawl. This concern was addressed
successfully by reducing the number of floats. The additional bycatch was likely due to the weight
of the TED keeping the net close to the seafloor. These nets have large meshes in the bellies and
wings. If these parts of the net are riding on the bottom, the ability of benthic species to escape is
reduced. Solving this problem by reducing the number of floats may seem counter-intuitive;
however, it was effective. The researchers identified that the drag on the floats was causing the
gear to pull on the headrope and push the net into the substrate. When these 3 floats were removed,
video showed the configuration of the gear improved.
        In 2018, the design with reduced floats was tested again but in a bottom-opening
configuration. The opening on the bottom was designed to help reduce the bycatch of benthic
species observed in the 2017 study. Additionally, the angle of the grid creates lift and reduces the
need for floatation. The data show again that the cable grid catch is comparable to the net without
a TED and that the modifications to the design were successful in “cleaning up” the catch.
        Testing has occurred in small and midsized squid vessels targeting longfin inshore squid
(DeAlteris and Parkins 2010; DeAlteris 2010). The data suggest that for this size class of vessel,
the use of a cable grid will not reduce the targeted longfin inshore squid catch and will help reduce
the other species of finfish and invertebrates.

ACKNOWLEDGEMENTS
        This project was possible because of the collaboration of Captain Chris Roebuck and John
Knight of Superior Trawl. Both provided valuable insight into the development of this design that
enabled the successful outcome. Additionally, we are grateful to the crew who helped sample the
catch and to Mike Ball, Elizabeth Marchetti, and Margret Heinichen who helped with data
collection.
        Reference to any specific commercial product, process, or service, or the use of any trade,
firm or corporation name is for descriptive purposes only, and does not constitute endorsement,
recommendation, or favoring by NOAA Fisheries.

                                                  6
REFERENCES CITED
DeAlteris J. 2010. Summary of 2010 Workshop on Mitigating Sea Turtle Bycatch in the Mid-
Atlantic and Southern New England Trawl Fisheries. [Final report; 16 p.] NOAA
Contract No. EA133F10SE2585
DeAlteris J, Parkins C. 2010. Evaluation of the effect on catch performance of the NMFS
flounder Turtle Excluder Device (TED) with a large opening in the Southern New
England long fin squid trawl fishery. [Final report; 19 p.] NOAA Contract No.
EA133F08CN0182.
7Table 1. Characteristics of the 2-seam, (Doryteuthis [Amerigo] pealeii) twin trawl and the F/V Karen
Elizabeth.
Thyboron Type IV
Doors
213.4 cm, 720 kg per door
Bridles 73.2 m
Backstraps 9.1 m
Ground cables 36.6 m of 22 mm wire with 6 cm rubber cookies
Headrope 42.64 m Tenex with 92 20.3-cm floats
Footrope 48.25 m of 16 mm SS wire with 6 cm rubber cookies
Net mouth circumference 288 meshes × 40 cm; 240 cm spectra face
Wings 240 cm of 11 mm Polytron
First bottom belly is 240 cm of 11 mm Polytron graduating
Belly
to 60 mm of 1.1 mm Dyneema
Extension None
Control codend 60 mm diamond polyethylene (3.0 mm) hanging ratio = 0.4
Experimental codend 70 mm diamond polyethylene (2.5 mm) hanging ratio = 0.4
10.6 m × 4.8 m of 16 cm square mesh 14 mm Polytron
Codend strengthener
wrapped with 19 mm polyethylene
40 × 50 meshes of 165 mm diamond double 5 mm
Chafing gear
polyethylene
Gross registered tonnage, vessel 156 GRT
length overall (m) 24 m
Engine horsepower 705
Trawl monitoring system Simrad ITI
8Figure 1. Location of hauls completed during the comparative study of a Type I cable grid (TI)
Turtle Excluder Device (TED).
90
Figure 2. Net diagram for test of Type I Cable TED.
10Figure 3. Type I cable grid configuration tested in 2017.
11Figure 1. Type I cable grid configuration tested in 2018. LR is Lead Ring, the foundation of the grid
frame.
12Figure 5. Type I grid “original configuration” with twelve 11” floats. Fished on hauls 1-14 and 17-
20 in 2017.
Figure 6. Type I grid with 3 floats removed from center of grid. Fished on hauls 20-38 in 2017.
13Figure 7. Type I grid configuration for all tows in 2018 fishing.
14t-Test: Paired Two Sample for Means
2017 Data
Control Experimental
Mean 188.9069 192.9413793
Variance 4100.501 5491.692512
Observations 29 29
Pearson Correlation 0.608956
Hypothesized Mean
Difference 0
df 28
t Stat -0.35186
P(TControl Experimental Control Experimental
Mean 3.1333333 39.89166667 Mean 10.98235 18.77058824
Variance 30.27515152 6546.20447 Variance 749.014 1041.137206
P(Tt-Test: Paired Two Sample for Means
Control Experimental
Mean 183.93125 164.3125
Variance 3117.224958 5187.981167
Observations 16 16
Pearson Correlation 0.751856531
Hypothesized Mean Difference 0
df 15
t Stat 1.651431668
P(T850
800
750
700
650 Control Experimental
600
Corrected Frequency
550
500
450
400
350
300
250
200
150
100
50
0
0 2 4 6 8 10 12 14 16 18 20 22 24 26 28
Length (cm)
Figure 12. Longfin inshore squid length frequency in 2017. Normalized length frequency plot of
squid lengths between the control and experimental gear.
18Figure 13. Sum of the weights of butterfish (Peprilus triacanthus), black sea bass (Centropristis
striata), scup (Stenotomus chrysops), silver hake (Merluccius bilinearis), skates (Rajidae sp.),
fluke (Paralichthys dentatus), dogfish (Squalidae sp.), spotted hake (Urophycis regia), fourspot
flounder (Paralichthys oblongus), monkfish (Lophius sp.), searobin (Triglidae sp.), chain dogfish
(Scyliorhinus retifer), herring (Clupeidae sp.), and invertebrates (mix of echinoderms, arthropods,
and other) plotted on a log10 Scale. Sum of the weights of individual finfish species and
invertebrate/trash complex plotted on a log10 Scale. All tows in 2017 used.
19t-Test: Paired Two Sample for Means
2018 Control Experimental
Mean 534.5060714 557.9142857
Variance 109490.5229 141000.9698
Observations 28 28
Pearson Correlation 0.884558544
Hypothesized Mean Difference 0
df 27
-
t Stat 0.707195216
P(Tt-Test: Paired Two Sample for Means
2018 Control Experimental
Mean 746.8892857 743.7396429
Variance 1375395.534 2337828.937
Observations 28 28
Pearson Correlation 0.845563951
Hypothesized Mean Difference 0
df 27
t Stat 0.020199719
P(T2018 Finfish Catch
100000
23755
11893
7837.6
4324.3
Log-10 sum of catch weight (lbs) for all tows
5023
10000
3173.8
2511.5
2418.9
660.4
1000
354.6
348.8
333.7
162.02
125.4
125.2
110.9
81.01
67.4
57.8
56.5
100
36.2
30.2
25.5
31
21.5
23
10.2
9.6
9.4
10
4.7
4
4
1
Experimental Control
Figure 16. Sum of the weights of butterfish (Peprilus triacanthus), black sea bass (Centropristis
striata), scup (Stenotomus chrysops), silver hake (Merluccius bilinearis), skates (Rajidae sp.),
fluke (Paralichthys dentatus), dogfish (Squalidae sp.), hake mix (Merluccius sp.), Gulf stream
flounder (Citharichthys arctifrons), fourspot flounder (Paralichthys oblongus), monkfish (Lophius
sp.), searobin (Triglidae sp.), chain dogfish (Scyliorhinus retifer), mackerel (Scomber scombrus),
herring (Clupeidae sp.), and invertebrates (mix of echinoderms, arthropods, and other) plotted on
a log10 Scale. All tows in 2018 used.
22t-Test: Paired Two Sample for Means
2018 Control Experimental
Mean 3.557142857 1.878571429
Variance 23.38328042 1.732857143
Observations 28 28
Pearson Correlation 0.355062528
Hypothesized Mean Difference 0
df 27
t Stat 1.957173367
P(T800
700
600
Corrrected Frequency
500 Control Experimental
400
300
200
100
0
0 2 4 6 8 10 12 14 16 18 20 22 24 26 28
Length (cm)
Figure 2. Longfin inshore squid length frequency in 2018. Normalized length frequency plot of
squid lengths between the control and experimental gear.
24Procedures for Issuing Manuscripts
in the
Northeast Fisheries Science Center Reference Document (CRD) Series
Clearance
All manuscripts submitted for issuance as CRDs decapod crustaceans, the Society for Marine
must have cleared the NEFSC’s manuscript/abstract/ Mammalogy’s guide to names of marine mammals,
webpage review process. If any author is not a federal Integrated Taxonomic Information System guidance
employee, he/she will be required to sign an “NEFSC on scientific and common names for all other species,
Release-of-Copyright Form.” If your manuscript the Biosciences Information Service’s guide to serial
includes material from another work which has been title abbreviations, and the ISO’s (International
copyrighted, then you will need to work with the Standardization Organization) guide to statistical
NEFSC’s Editorial Office to arrange for permission to terms.
For in-text citation, use the name-date system. A
use that material by securing release signatures on the
special effort should be made to ensure that all
“NEFSC Use-of-Copyrighted-Work Permission
necessary bibliographic information is included in the
Form.”
list of cited works. Personal communications must
For more information, NEFSC authors should see
include date, full name, and full mailing address of
the NEFSC’s online publication policy manual,
the contact.
“Manuscript/abstract/webpage preparation, review,
and dissemination: NEFSC author’s guide to policy,
process, and procedure,” located in the
Preparation
Once your document has cleared the review
Publications/Manuscript Review section of the
process, the Editorial Office will contact you with
NEFSC intranet page.
publication needs – for example, revised text (if
necessary) and separate digital figures and tables if they
Organization
are embedded in the document. Materials may be
Manuscripts must have an abstract and table of
submitted to the Editorial Office as email attachments
contents, and (if applicable) lists of figures and tables.
or intranet downloads. Text files should be in
As much as possible, use traditional scientific
Microsoft Word, tables may be in Word or Excel, and
manuscript organization for sections: “Introduction,”
graphics files may be in a variety of formats (JPG,
“Study Area” and/or ”Experimental Apparatus,”
GIF, Excel, PowerPoint, etc.).
“Methods,” “Results,” “Discussion,” “Conclusions,”
“Acknowledgements,” and “References Cited.”
Production and Distribution
Style The Editorial Office will perform a copyedit of
The CRD series is obligated to conform with the the document and may request further revisions. The
style contained in the current edition of the United Editorial Office will develop the inside and outside
States Government Printing Office Style Manual. That front covers, the inside and outside back covers, and
style manual is silent on many aspects of scientific the title and bibliographic control pages of the
manuscripts. The CRD series relies more on the CSE document.
Style Manual. Manuscripts should be prepared to Once the CRD is ready, the Editorial Office will
conform with these style manuals. contact you to review it and submit corrections or
The CRD series uses the American Fisheries changes before the document is posted online.
Society’s guides to names of fishes, mollusks, and A number of organizations and individuals in the
Northeast Region will be notified by e-mail of the
availability of the document online.
anResearch Communications Branch
Northeast Fisheries Science Center
National Marine Fisheries Service, NOAA
166 Water St.
Woods Hole, MA 02543-1026
Publications and Reports
of the
Northeast Fisheries Science Center
The mission of NOAA’s National Marine Fisheries Service (NMFS) is “stewardship of living marine resources
for the benefit of the nation through their science-based conservation and management and promotion of the
health of their environment.” As the research arm of the NMFS’s Northeast Region, the Northeast Fisheries
Science Center (NEFSC) supports the NMFS mission by “conducting ecosystem-based research and
assessments of living marine resources, with a focus on the Northeast Shelf, to promote the recovery and long-
term sustainability of these resources and to generate social and economic opportunities and benefits from their
use.” Results of NEFSC research are largely reported in primary scientific media (e.g., anonymously-peer-
reviewed scientific journals). However, to assist itself in providing data, information, and advice to its
constituents, the NEFSC occasionally releases its results in its own media. Currently, there are three such media:
NOAA Technical Memorandum NMFS-NE -- This series is issued irregularly. The series typically includes: data
reports of long-term field or lab studies of important species or habitats; synthesis reports for important species
or habitats; annual reports of overall assessment or monitoring programs; manuals describing program-wide
surveying or experimental techniques; literature surveys of important species or habitat topics; proceedings and
collected papers of scientific meetings; and indexed and/or annotated bibliographies. All issues receive internal
scientific review and most issues receive technical and copy editing.
Northeast Fisheries Science Center Reference Document -- This series is issued irregularly. The series typically
includes: data reports on field and lab studies; progress reports on experiments, monitoring, and assessments;
background papers for, collected abstracts of, and/or summary reports of scientific meetings; and simple
bibliographies. Issues receive internal scientific review and most issues receive copy editing.
Resource Survey Report (formerly Fishermen’s Report) -- This information report is a regularly-issued, quick-
turnaround report on the distribution and relative abundance of selected living marine resources as derived from
each of the NEFSC’s periodic research vessel surveys of the Northeast’s continental shelf. This report undergoes
internal review, but receives no technical or copy editing.
TO OBTAIN A COPY of a NOAA Technical Memorandum NMFS-NE or a Northeast Fisheries Science Center
Reference Document, either contact the NEFSC Editorial Office (166 Water St., Woods Hole, MA 02543-1026;
508-495-2228) or consult the “Northeast Fisheries Science Center Publications” webpage
https://www.fisheries.noaa.gov/new-england-mid-atlantic/northeast-fisheries-science-center-publicationsYou can also read