EARLY ONLINE RELEASE - UNAM
←
→
Page content transcription
If your browser does not render page correctly, please read the page content below

EARLY ONLINE RELEASE

The following is a manuscript that has been peer-reviewed and accepted for publication
in Atmósfera.

The text will be formatted and copy-edited, and the final published version may be
different from this early online release.

This manuscript may be downloaded, distributed and used under the provisions of the
Creative Commons Attribution Non-Commercial 4.0 International license.

It may be cited using the following DOI:

https://doi.org/10.20937/ATM.52840
Acceptance date: 11 July 2020

The published manuscript will replace this preliminary version at the above DOI.

Atmósfera is a quarterly journal published by the Universidad Nacional Autónoma de México (UNAM)
through its Centro de Ciencias de la Atmósfera in Mexico City, Mexico. ISSN 2395-8812.
https://www.revistascca.unam.mx/atm
1                      A rare winter thunderstorm event near Hong Kong
2
3                                    P.W. Chan and K.K. Hon
4                                    Hong Kong Observatory
5                                      134A Nathan Road
6                                 Kowloon, Hong Kong, China
7
8                                            Q.S. Li
9                        Department of Architecture and Civil Engineering
10                                City University of Hong Kong
11                                      Tat Chee Avenue
12                                Kowloon, Hong Kong, China
13
14   Corresponding author:
15   P.W. Chan
16   Hong Kong Observatory
17   34A Nathan Road
18   Kowloon, Hong Kong, China
19   Email: pwchan@hko.gov.hk
20
21   Highlights
22
23   l   A rare winter thunderstorm event is documented in this paper.
24   l   The thunderstorm is well captured by weather radar and lightning location system.
25   l   Origin of the occurrence of the thunderstorm is studied from dynamic and
26       thermodynamic conditions.
27   l   Numerical weather prediction model has reasonable skill in capturing the thunderstorm
28       occurrence.
29
30   Graphical abstract

31
32
33   Abstract
34
35   A rare winter thunderstorm event near Hong Kong is documented in this paper.                The
36   thunderstorm occurrence was confirmed by the observation of an author and the lightning
37   location information systems (both regional and global).     It developed over the frontal cloud
38   band associated with the winter monsoon.      Observing the upper air measurements, however,
39   the thermodynamic conditions did not seem favourable to the occurrence of the thunderstorm.
40   The lower troposphere was cool and dry in that the convective available potential energy
41   could not be determined.     There was only a moister layer in the middle troposphere.      The
42   weather forecaster did not anticipate the occurrence of thunder and lightning.        However,
43   some features could have changed dynamically and such changes suggested a chance for
44   thunderstorm to take place.       For instance, waves could be identified in the middle
45   troposphere, and a broad troughing flow could be analysed in the lower troposphere.         The
46   integrated wave vapour was also of rather high level.     It is hoped that the paper could serve
47   as a useful reference for forecasters in assessing the chance of thunderstorm during winter
48   over the sub-tropical latitudes in association with frontal cloud bands.
49
50   1.   Introduction
51
52   Thunderstorms usually occur in Hong Kong during summer and it is rather rare during winter.
53   According to the records of weather observer at the Hong Kong Observatory headquarters, the
54   climatological number of thunderstorm days in January of each year from 1947 to 2019 was
55   0.16 (HKO, 2020).     It would be useful to document the meteorological conditions when
56   thunderstorm occurs in or around Hong Kong territory in January.    Such documentation aims
57   to provide useful reference to the weather forecasters in identifying the possibility of
58   thunderstorm occurrence during the season when discharging their day-to-day operational
59   forecasting duties.
60
61   A thunderstorm occurred at a distance of about 40 to 50 kilometres in southeast direction from
62   Hong Kong during the morning of 27 January 2020.             As could be seen in subsequent
63   analysis, the occurrence of this thunderstorm was unexpected for one reason: it was not
64   favoured by the thermodynamic conditions of the atmosphere, namely, the various instability
65   indices of the atmosphere as given by the upper air sounding systems were not conductive for
66   thunderstorm to occur.   It would be interesting to document this thunderstorm case for future
67   reference.   This paper also tries to summarise the atmospheric conditions that could have
68   contributed to the occurrence of the thunderstorm.     Such observation can also serve as a
69   useful reference to the weather forecasters in the future in their assessment of the chance of
70   thunderstorm near Hong Kong.
71
72   2.   Data and analysis methodology
73
74   2.1 Surface-based meteorological observations
75
76   Weather radars are the major analysis tools of this paper.    There are 5 microwave weather
77   surveillance radars in Hong Kong. In the present analysis, two of them would be used: the
78   long-range (512 km), S-band, dual polarization radar on the top of the mountain Tate’s Cairn
79   (about 500 m above mean sea level; Kong and Chan, 2018); and the C-band Terminal Doppler
80   Weather Radar (TDWR) at Brother’s Point (Tse et al., 2019).
81
82   The S-band radar performs a volume scan every 6 minutes with a total of 11 elevation angles
83   ranging between 0 to 34 degrees from the horizontal.           Apart from the conventional
84    reflectivity and Doppler velocity, it is able to classify the nature of hydrometeors based on the
85    dual polarization parameters.     The hydrometeor classification has a radial resolution of 150
86    m and an azimuthal resolution of 1 degree.      For products presented in Cartesian coordinate,
87    the finest resolution would be around 150 m x 150 m per pixel.       The algorithm currently in
88    use at HKO is supplied by the radar manufacturer and based on Liu and Chandrasekhar (2000)
89    with local adaptations.   On the other hand, the C-band TDWR mainly focuses on the airport
90    area in Hong Kong to provide windshear alerts.      On top of dedicated sector scans covering
91    the airport area with high re-visit frequency, it performs 5-degree Plan Position Indicator (PPI)
92    scan at intervals of approximately 5 minutes with a range up to about 90 km as a backup of
93    the S-band radar for long-range measurements.       However, it should be noted that these PPI
94    scans are affected by beam blockage over parts of the northern and eastern quadrants due to
95    the TDWR’s low construction height (by design) as compared to scans at the mountainous
96    terrain in other parts of Hong Kong measuring up to about 900 m.
97
98    Another important tool for lightning observation is the Lightning Location Information
99    System (LLIS).       The Hong Kong Observatory collaborates with the Guangdong
100   Meteorological Bureau and the Macao Meteorological and Geophysical Bureau in operating a
101   network of lightning sensors for detection over the south China coast and adjacent waters.
102   Details of the LIIS could be found in Lee (2018).     Starting from late 2016, the Observatory
103   also receives near real-time global lightning location information (GLD360) from a service
104   provider.   Technical details of the GLD360 data set could be found on the manufacturer’s
105   website
106   (https://www.vaisala.com/en/products/data-subscriptions-and-reports/data-sets/gld360).
107   Both networks are able to detect cloud-ground (C-G) lightning strikes and cloud-cloud (C-C)
108   lightning strikes (GLD360 data set began providing a differentiation of C-C and C-G strikes
109   since early 2019).   A comparison between the detection performance of the two data sources
110   over the south China coastal areas can be found in Chiu and Lee (2019).
111
112   In order to observe the upper air atmospheric conditions, the Observatory operates a number
113   of equipment.    The first being the conventional radiosonde ascent, which is released at
114   King’s Park in the city centre.     The ascent is made twice a day, namely, 00 and 12 UTC
115   (Hong Kong time, HKT, = UTC + 8 hours). It measures temperature, dew point, pressure
116   and winds of the atmosphere, providing raw data at an observation frequency up to 2 Hz.
117   Remote sensing meteorological instruments are also put into operation.              Among the
118   instruments is the boundary layer type, vertically pointing radar wind profiler at the city
119   centre, which measures the three components of the wind up to about 9 km above mean sea
120   level (Chan and Yeung, 2003).         There is also a ground-based microwave radiometer at
121   King’s Park, which provides temperature and dew point profiles up to 10 km above mean sea
122   level (Chan, 2009).      Retrieval algorithm used by the radiometer is described and detailed in
123   Chan (2010).    The radiosonde ascent and microwave radiometer data such as K-index and
124   convective available potential energy (CAPE) are taken to calculate instability indices of the
125   atmosphere. These could be useful indicators for the occurrence of thunderstorms in Hong
126   Kong (Chan and Hon, 2011).
127
128   2.2 Satellite-based meteorological observations
129
130   To support daily forecasting operations, HKO receives real-time observation data from
131   Himawari-8, the next-generation meteorological satellite of Japan Meteorological Agency.
132   Ranging from a central wavelength of 0.47–13.3μm, the Advanced Himawari Imager on
133   Himawari-8 operates at 16 frequency bands and covers both the infrared and visible spectra
134   (Murata et al., 2015).    HKO also operates satellite-based regional nowcasting system (HKO,
135   2019) based on a locally adapted version of the EUMETSAT Satellite Application Facility on
136   Support to Nowcasting and Very Short Range Forecasting (NWC SAF) software package
137   (Derrien and Le Gléau, 2005).       Various satellite analysis and nowcasting products generate
138   real-time data including cloud type, cloud top height and derived winds.
139
140   2.3 Numerical weather prediction model
141
142   In Section 9 we will inspect the performance of the AAMC-WRF, which is a large-domain
143   implementation of the Weather Research and Forecast (WRF) model (Skamarock and Klemp,
144   2007) at 10-km resolution by HKO to support regional aviation weather prediction.
145   Configuration of the AAMC-WRF follows Hon (2020). In essence, the forecast domain
146   contains 1251 x 1101 grid points horizontally, spanning the region (20⁰S - 60⁰N, 45⁰E - 160⁰E)
147   using the Mercator projection, with 42 eta levels vertically.   Version 3.9.1 of the WRF source
148   code is used.    At the time of writing, the model follows a schedule of 4 runs per day
149   (initialised at 00, 06, 12 and 18 UTC) and up to T+48 hours.          Boundary conditions are
150   provided by the latest available NCEP GFS output at 0.5-degree horizontal resolution.
151   Initial conditions are provided by 3DVAR analysis of surface and upper-air observations from
152   the Global Telecommunication System (GTS) based on first guess fields from the latest
153   available NCEP GFS output at 0.25-degree horizontal resolution.     Key model configurations
154   are included: the WRF Double Moment 6-Class (WDM6) scheme for microphysics (Lim and
155   Hong, 2010); the RRTMG schemes for short- and long-wave radiation (Iacono et al., 2008);
156   the Noah land surface model (Niu et al 2011); the YSU planetary boundary layer scheme
157   (Shin et al., 2013); and the modified Tiedtke scheme for cumulus convection (Zhang et al.,
158   2011).
159
160   To support various weather forecasting functions at HKO, forecasts fields from AAMC-WRF
161   are generated at 1-hour intervals.      In addition to conventional surface and upper-air
162   parameters including sea level pressure, precipitation, winds, temperature, relative humidity
163   and more, simulated infrared radiances following Hon (2018) and simulated radar reflectivity
164   are also computed as routine products to facilitate direct visual comparison with remote
165   sensing observations by weather forecasters in an operational setting.
166
167   3.   Analysis of the event
168
169   3.1 Synoptic conditions
170
171   The thunderstorm event occurred at about 09:20 a.m., 27 January 2020.     Thunder was heard
172   at the location of the author (Chan) in the city centre.   Meanwhile, the northeast monsoon
173   was affecting the mainland China to the northern part of South China Sea (Figure 1).
174
175   Meteorological satellite imagery showed that there were convective clouds just to the
176   southeast of Hong Kong (Figure 2(a)).      The cloud top was analysed to be about 8000 m
177   above mean sea level (Figure 2(b)).   Integrated water vapour reached 2-3 kg/m2 (Figure 2(c)).
178   This number was on the high side and showed that there was abundant of moisture favourable
179   to the development of convective clouds.
180
181   For the cloud drift winds, there was a trough over south China coastal area at around 800 to
182   1000 hPa layers (Figure 3(a)), namely, northerly winds over the coast and inland areas, and
183   westerly winds over the coastal waters.      In the middle troposphere of 600 to 800 hPa
184   (Figure 3(b)), there was a southwesterly jet over the south China coastal waters.       Short
185   waves could be found in the jet, which might as well trigger the occurrence of deep
186   convection.   There may be gravity waves in the frontal clouds associated with the northeast
187   monsoon over southern China and south China coastal waters.
188
189   3.2 Local conditions
190
191   From the radarscope, intense radar echo (about 47 dBZ) with lightning strikes from LLIS
192   were observed at about 40-50 kilometres to the southeast of Hong Kong (Figure 4). Given
193   the proximity of the radar echoes and lightning strikes near Hong Kong, thunder would likely
194   be heard over the territory.   This is consistent with the authors’ observations.
195
196   From the C-band weather radar (Figure 5), southwesterly flow of around 14 m/s was depicted
197   in the radar echo to the southeast of Hong Kong.       There also appeared to have convergence
198   between outbound and inbound flow at the location of the stronger radar echo.              This
199   mid-level convergence would be favourable to the development of the rain clouds.
200
201   From the hydrometeor classification by the S-band radar (Figure 6), graupels (yellow) were
202   found to be embedded in the extensive area of rain/wet snow/snow, which further supports the
203   occurrence of lightning over that region of radar echo.        The presence of graupels would
204   likely lead to the occurrence of thunders and lightning due to their collisions.
205
206   Both cloud-to-cloud (i.e. intra-cloud) and cloud-to-ground lighting strikes were also registered
207   by the global lightning network at roughly the same location, with peak current of over 50 kA
208   (Figure 7).   The observations of the global lightning network and the lightning strikes
209   registered by LLIS are generally consistent with each other.
210
211   The thermodynamic condition of the atmosphere could be revealed in the radiosonde
212   measurement at 00 UTC, 27 January 2020 (Figure 8(a)).               The atmosphere was moist
213   between around 550 hPa and 700 hPa.         Below that, the atmosphere was rather dry, and the
214   K-index recorded only 25 K.      CAPE could not be calculated as there was strong temperature
215   inversion in the lower troposphere.
216
217   Microwave radiometer (Figure 8(b)) also showed that, at about 0120 UTC, 27 January 2020,
218   the troposphere was rather dry at the level of about 2200 m above mean sea level.           The
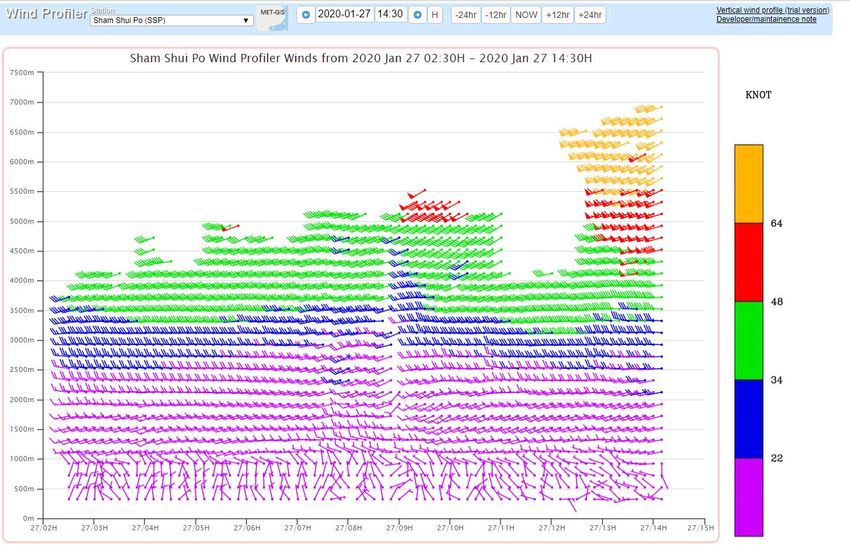
219   CAPE was very small – at only about 20 J kg-1.            And K-index was about 18 K.        The
220   thermodynamic indicators in general did not favour the occurrence of deep convection.
221
222   The wind profiler (Figure 9) showed that, at around 01:20 UTC, 27 January 2020, there
223   appeared to be a westerly wave moving around that location at a height of about 2 to
224   3 kilometres above mean sea level.      This wave was considered to be a major feature for
225   triggering the convection.
226
227   In summary, from both radar wind profiler and satellite winds, the dynamic conditions may
228   suggest the occurrence of deep convection, namely, troughing flow in the lower troposphere,
229   and westerly wave in the middle troposphere.
230
231   4   Performance of NWP model
232
233   We hereby inspect the AAMC-WRF model run initialised at 06 UTC, 26 January 2020, which
234   would have been available to the forecasting bench around local evening time the day before
235   the thunderstorm event took place.    Figure 9(a) showed the simulated radar reflectivity in the
236   vicinity of Hong Kong at a height of 5 km. It could be seen that a wave-like echo patch,
237   with maximum intensity not exceeding 30 dBZ, was predicted to take place to the south of
238   Hong Kong. While the shape of the simulated echo patch bears reasonable resemblance to
239   the actual radar observations in terms of both shape and intensity, we can also take note of
240   some deficiencies.   Firstly, the simulated echo patch did not extend far enough towards the
241   northeast and therefore could not cover the actual location where lightning was detected.
242   From here, we shall proceed to inspect its cause.     Figure 9(b) showed the predicted cloud ice
243   content (mixing ratio in g kg-1) at the same altitude. The AAMC-WRF was able to produce a
244   southwest-northeast oriented band just to the south of Hong Kong, which corresponded to the
245   observed cloud band on satellite images. Hence the synoptic feature of the frontal cloud
246   band was correctly positioned.     Figure 9(c) showed the predicted graupel content (mixing
247   ratio in g kg-1), also at an altitude of 5 km.      It could be seen that the model produced a
248   concentrated region of graupel (peaking at about 0.1 g kg-1) which collocated with the
249   predicted radar reflectivity feature. While the occurrence of model graupel was in line with
250   the satellite-based analysis in Section 3 and was also a favourable ingredient for lightning, the
251   predicted spatial extent was too small to reproduce the full shape of the lightning-bearing
252   echoes closest to Hong Kong.
253
254   Secondly, the simulated radar reflectivity feature took place at too high an altitude.   This is
255   also the reason as to why the 5-km layer was chosen in Figure 9, below which the predicted
256   reflectivity values turn out to be too low.    The upper-air winds and relative humidity around
257   Hong Kong as predicted by AAMC-WRF are given in Figure 10.               The top panels (left to
258   right) are 500 and 700 hPa layers.    The moist patches (in shades of blue) to the south of the
259   coastline agree reasonably well with the observed cloud bands, while at 500 hPa there were
260   signs of short waves to the south of Hong Kong.       However, the bottom panels (850 and 925
261   hPa; left to right) revealed that the dry continental airflow near the bottom of the troposphere
262   had penetrated too far in southward direction to the extent that the occurrence of
263   hydrometeors and hence radar reflectivity in the model were stifled.
264
265   As mentioned in Section 4, at the time of the thunderstorm event, the AAMC-WRF only made
266   use of conventional GTS observations for data assimilation.         In Figures 11 and 12, we
267   present simulation results from a re-run utilising additional observation data.   The re-run was
268   initialised at 00 UTC, 26 January 2020 with assimilation of Himawari-8 Atmospheric Motion
269   Vectors (AMV) on top of conventional GTS observations.          Here the output at 02 UTC (i.e.
270   one hour earlier than that shown in Figures 9 and 10) are shown, which are able to better
271   match the actual timing of the thunderstorm event.       By comparing Figures 9 and 11, it can
272   immediately be seen that the re-run is able to better capture the proximity of the radar echoes
273   to Hong Kong (main echo band shifted northwards from below 21.5⁰N to around 22.0⁰N) with
274   enhanced coverage of ice and graupel contents.        By comparing Figures 10 and 12, we may
275   attribute the differences to enhanced moisture at 500 hPa and 700 hPa levels, especially aloft
276   Hong Kong, which provides a more favourable environment to the development and
277   sustenance of the simulated radar echoes closer to Hong Kong.       Furthermore, we note from
278   Figure 13 that, in the re-run, it has become possible to reproduce simulated radar reflectivity
279   at 3-km altitude around Hong Kong.            This was previously not possible in the original
280   real-time operational run (hence 5-km altitude was chosen in Figure 9).
281
282   5   Summary
283
284   A rare winter thunderstorm case in Hong Kong is documented in the paper.          The convection
285   was quite intense, as shown by the peak current of the lightning strike.     The occurrence of
286   thunder was also supported by weather radar observations.       The thermodynamic conditions
287   of the atmosphere did not appear to support deep convection.        However, troughing flow
288   could be analysed in the lower troposphere, and there appeared to be westerly waves in the
289   middle troposphere.      Such dynamic conditions are favourable for the occurrence of
290   convection.     From the tephigram (Figure 6(a)), the air parcel at about 1500 m may have been
291   lifted to the upper troposphere for the convection to take place, which was a kind of elevated
292   thunderstorm.     In terms of mesoscale model prediction, the 10-km resolution AAMC-WRF
293   of HKO was able to give indication of a wave-like, graupel-rich radar reflectivity region to
294   the south of Hong Kong, bearing reasonable resemblance to the observed radar and satellite
295   features, since the evening before the event (i.e. lead time of 18 – 21 hours).   However, the
296   predicted reflectivity region occurred too high in altitude due to deficiency of lower
297   tropospheric moisture, and did not extend far enough in northeast direction to coincide with
298   the actual lightning location due to misplacement of the high graupel content region.      The
299   timing, location and vertical structure of the simulated reflectivity pattern could be improved
300   through assimilation of additional upper-air observations in the form of Himawari-8
301   Atmospheric Motion Vectors (AMV).          It is hoped that this paper can serve as useful
302   document for future forecasting reference of similar rare and unseasonal convection events at
303   sub-tropical latitudes, while at the same time highlighting challenges in the analysis and
304   modeling of such events.
305
306
307   References
308
309   Chan PW. 2009. Performance and application of a multi-wavelength, ground-based
310   microwave radiometer in intense convective weather, Meteorol. Z., 18(3), 253-265. DOI:
311   https://doi.org/10.1127/0941-2948/2009/0375
312
313   Chan PW. 2010. The Use of Neural Network Retrieval for Thermodynamic Profiles of a
314   Ground-based Microwave Radiometer, The 11th Specialist Meeting on Microwave
315   Radiometry and Remote Sensing of the Environment, 1-4 March 2010, Washington, DC, USA.
316   Available at https://www.hko.gov.hk/en/publica/reprint/files/r891.pdf
317
318   Chan PW, Hon KK. Application of ground-based, multi-channel microwave radiometer in the
319   nowcasting of intense convective weather through instability indices of the atmosphere,
320   Meteorol. Z., 20, 431-440. DOI: https://doi.org/10.1127/0941-2948/2011/0276
321
322   Chan PW, Yeung KK. 2003. Experimental Extension of the Measurement Range of a
323   Boundary Layer Wind Profiler to about 9 Km, Twelfth Symposium on Meteorological
324   Observations and Instrumentation, Long Beach, California, USA, 10-13 February 2003.
325   Available at https://www.hko.gov.hk/en/publica/reprint/files/r497.pdf
326
327   Chiu YY, Lee OSM. 2019. Fine-scale Comparison of Regional and Global Lightning Location
328   Data over the Pearl River Estuary Region, 33rd Guangdong-Hong Kong-Macao
329   Meteorological Technical Seminar, 6-8 March 2019, Hong Kong. Available at
330   https://www.hko.gov.hk/en/publica/reprint/files/r1358.pdf (English abstract only).
331
332   Derrien M, Le Gléau H. 2005. MSG/SEVIRI cloud mask and type from SAFNWC. Int. J.
333   Remote Sens., 26, 4707–4732. DOI: https://doi.org/10.1080/01431160500166128.
334
335   Hon KK. 2018. Simulated satellite imagery at sub-kilometre resolution by the Hong Kong
336   Observatory.     Weather,      May      2018,     Vol.     73,     No.5,    139-144.   DOI:
337   https://doi.org/10.1002/wea.3100
338
339   Hon KK. 2020. Tropical cyclone track prediction using a large-area WRF model at the Hong
340   Kong Observatory. Tropical Cyclone Research and Review, 9(1), 67-74. DOI:
341   https://doi.org/10.1016/j.tcrr.2020.03.002.
342
343   Hong Kong Observatory. 2019. World Meteorological Organisation Regional Specialised
344   Meteorological Centre for Nowcasting. Available at https://rsmc.hko.gov.hk/nowcast/
345
346   Hong Kong Observatory. 2020. Number of days with Thunderstorm in Hong Kong since 1947.
347   Available at https://www.hko.gov.hk/en/cis/statistic/tsday_statistic.htm
348
349   Iacono MJ, Delamere JS, Mlawer EJ, Shephard MW, Clough SA, Collins WD. 2008.
350   Radiative forcing by long–lived greenhouse gases: Calculations with the AER radiative
351   transfer models. J. Geophys. Res., 113, D13103.
352
353   Kong W, Chan YW. 2018. Rapid Scan Experiment of Doppler Weather
354
355   Radar for Monitoring Rainstorms and Tropical Cyclones in Hong Kong, 10th European
356   Conference on Radar in Meteorology and Hydrology (ERAD 2018) : 1-6 July 2018,
357   Ede-Wageningen, The Netherlands. DOI: https://doi.org/10.18174/454537.
358
359   Lim K–SS, Hong S–Y. 2010. Development of an effective double–moment cloud
360   microphysics scheme with prognostic cloud condensation nuclei (CCN) for weather and
361   climate models. Mon. Wea. Rev., 138, 1587–1612.
362
363   Liu H, Chandrasekar V. 2000. Classification of hydrometeors based on polarimetric radar
364   measurements: Development of fuzzy logic and neuro-fuzzy systems, and in situ
365   verification. J.       Atmos.          Oceanic          Technol., 17, 140–164.          DOI:
366   https://doi.org/10.1175/1520-0426(2000)0172.0.CO;2.
367
368   Lee OSM. 2018. Latest Development of the Lightning Location Network over the Pearl River
369   Estuary and Data Analysis Related to Tropical Cyclone Monitoring, WMO Technical
370   Conference on Meteorological and Environmental Instruments and Methods of Observation
371   (CIMO TECO 2018), 8–11 October 2018, Amsterdam, the Netherlands.                 Available at
372   https://www.hko.gov.hk/en/publica/reprint/files/r1351.pdf
373
374   Murata H, Takahashi M, Kosaka Y. 2015. VIS and IR bands of Himawari‐8/AHI compatible
375   with those of MTSAT‐2/Imager, Technical Report No. 60. Meteorological Satellite Centre,
376   Japan Meteorological Agency, Tokyo, Japan.
377
378   Shin HH, Hong S, Noh Y, Dudhia J. 2013. Derivation of Turbulent Kinetic Energy from a
379   First-Order Nonlocal Planetary Boundary Layer Parameterization. J. Atmos. Sci., 70, 1795–
380   1805. DOI: https://doi.org/10.1175/JAS-D-12-0150.1
381
382   Skamarock WC, Klemp JB. 2007. A time-split nonhydrostatic atmospheric model for weather
383   research and forecasting applications. J. Comp. Phys. 227 (2008) 3465-3485
384
385   Tse SM, Hagio M, Maeda Y. 2019. Windshear detection by Terminal Doppler Weather Radar
386   during Tropical Cyclone Mujigae in 2015. Meteorol Appl. 2019; 26: 620– 631. DOI:
387   https://doi.org/10.1002/met.1789
388
389   Zhang C, Wang Y, Hamilton K. 2011. Improved Representation of Boundary Layer Clouds
390   over the Southeast Pacific in ARW-WRF Using a Modified Tiedtke Cumulus
391   Parameterization   Scheme.     Mon.    Wea.    Rev.,    139,    3489–3513.    DOI:
392   https://doi.org/10.1175/MWR-D-10-05091.1
393
394
Hong Kong
395
396
397 Figure 1. Surface isobaric chart during the morning (00 UTC, or 8 a.m. local time) of
398 27 January 2020.
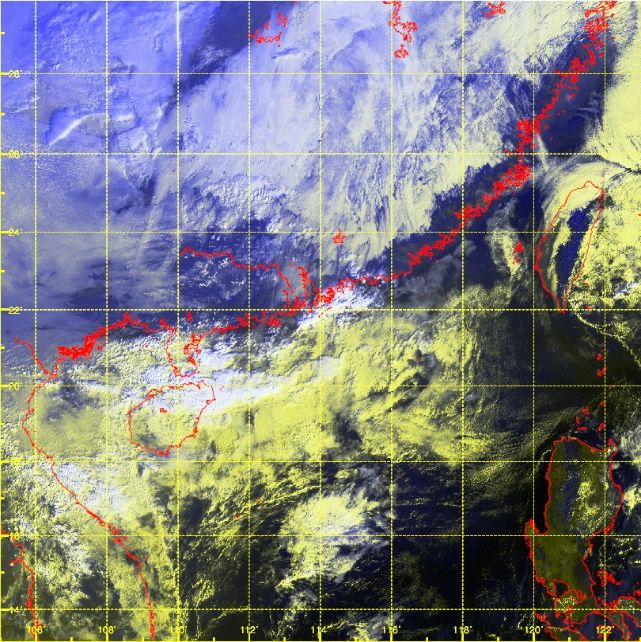
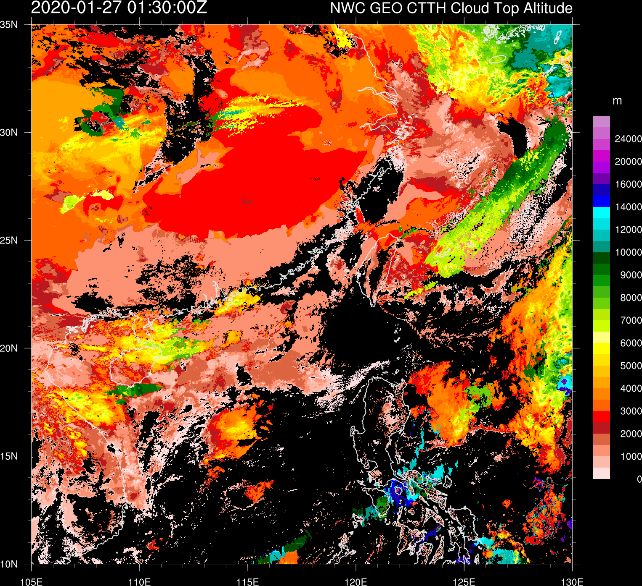
399400 (a) 401 (b) 402 (c) 403 Figure 2. Meteorological satellite imageries: (a) the false colour image, (b) the cloud top 404 height, and (c) the integrated water vapour amount. The scales are given on the right side of 405 (b) and (c). 406
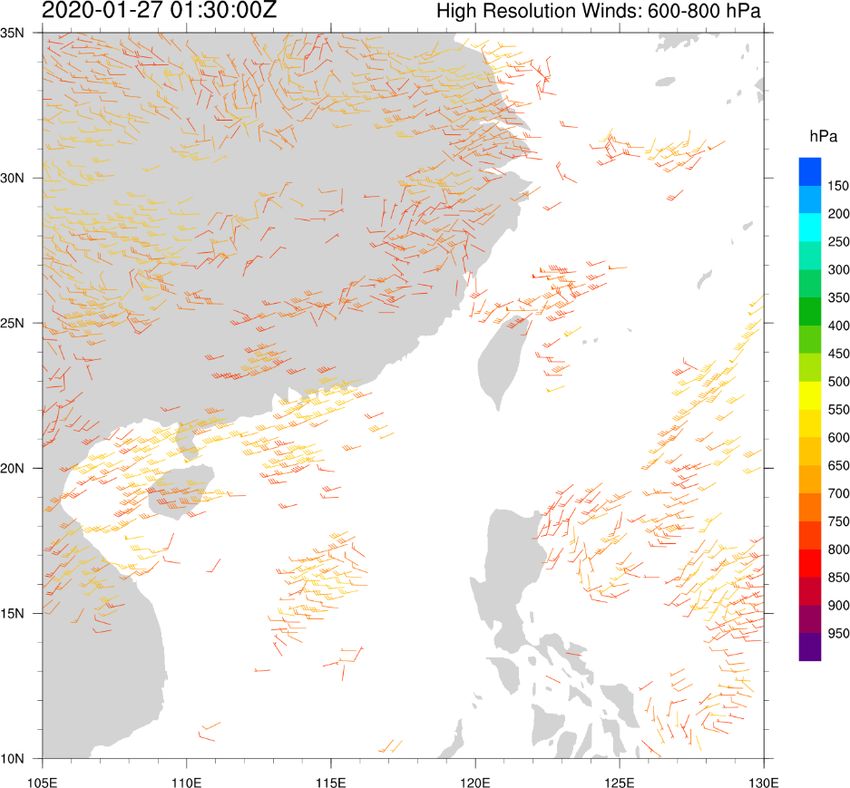
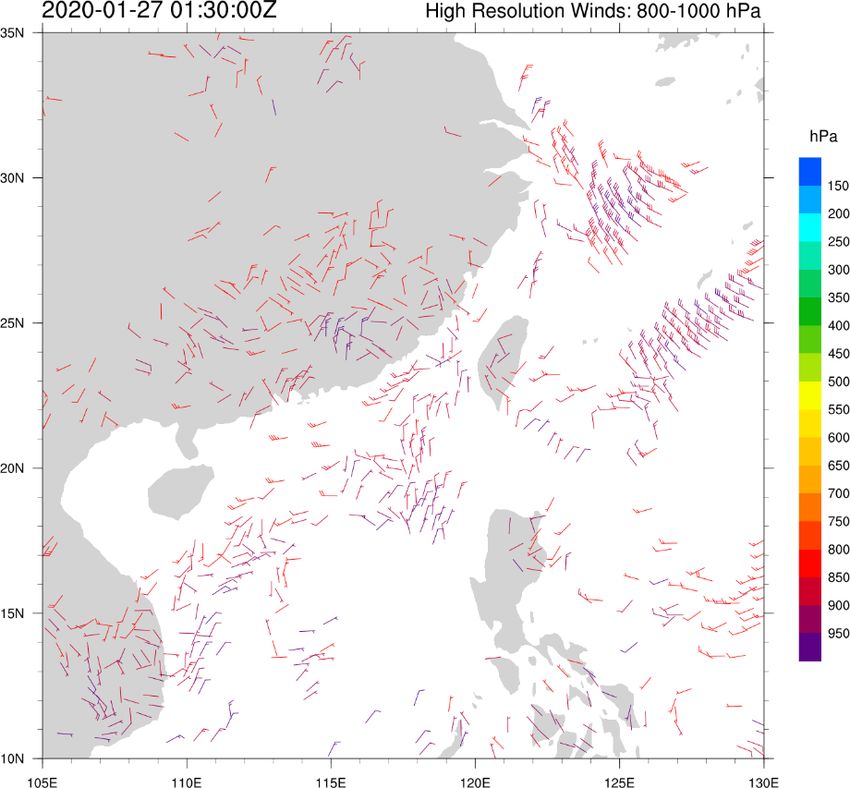
407                                                                               (a)
408

409                                                                               (b)
410
411   Figure 3. The satellite derived winds for lower troposphere (a) and middle troposphere (b).
412
413
414   Figure 4. The figure shows the radar picture (from the S-band radar) and the associated
415   lightning strikes (cloud-to-ground, with legend of the timing on the right).
416
417
418

419
420   Figure 5. Doppler velocity given by the Terminal Doppler Weather Radar at the time of the
421   thunderstorm.
422
423
424   Figure 6. Hydrometeor classification for the radar echo from the S-band radar at the time of
425   the thunderstorm.
426
427
428

429

430
431   Figure 7. Lighting locations as given by the global lightning location system.   Descriptions
432   of the shape and colour of the symbols are shown on the right.
433
434
435                                                                        (a)
436

437

438                                                                                           (b)
439
440   Figure 8. The tephigram at Hong Kong at 00 UTC, 27 January 2020 (a).       (b) is the humidity
441   data from the microwave radiometer (colour scale) and the time series of the various
442   instability indices.   Grey colour column means missing data from the wind.
443
444
445   Figure 9. Wind profiler data.   The colour scale is the wind speed in knots.
446
(a)
447
(b) (c)
448
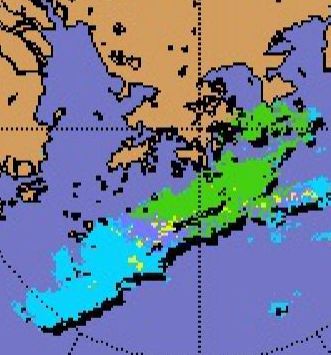
449 Figure 10. Forecast meteorological fields at 5-km altitude by the AAMC-WRF, including
450 (a) simulated radar reflectivity (domain of Figure 4 is given by a rectangle with broken line);
451 (b) cloud ice content; and (c) graupel content. These are taken from the real-time
452 operational run initialised at 26 Jan 2020, 06 UTC.
453
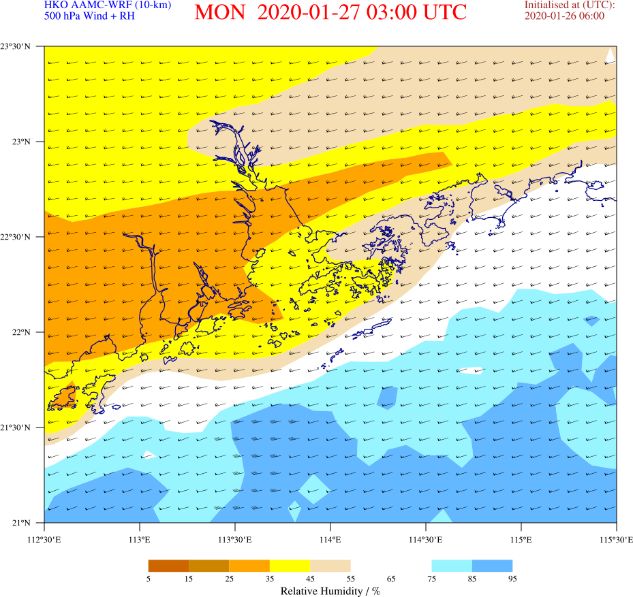
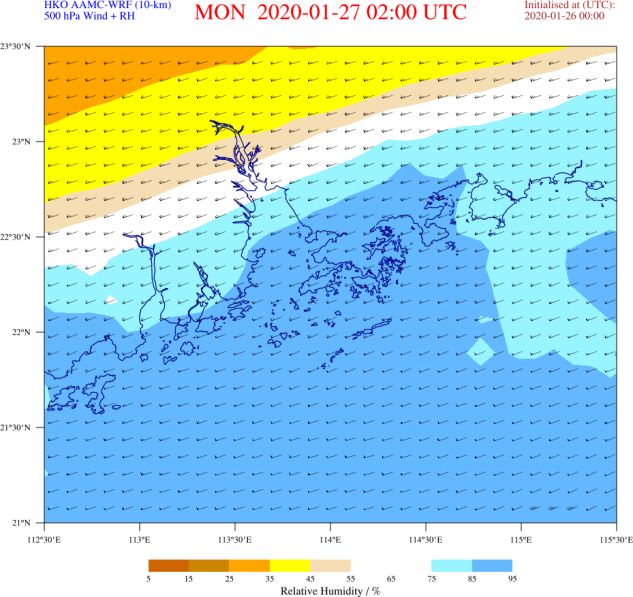
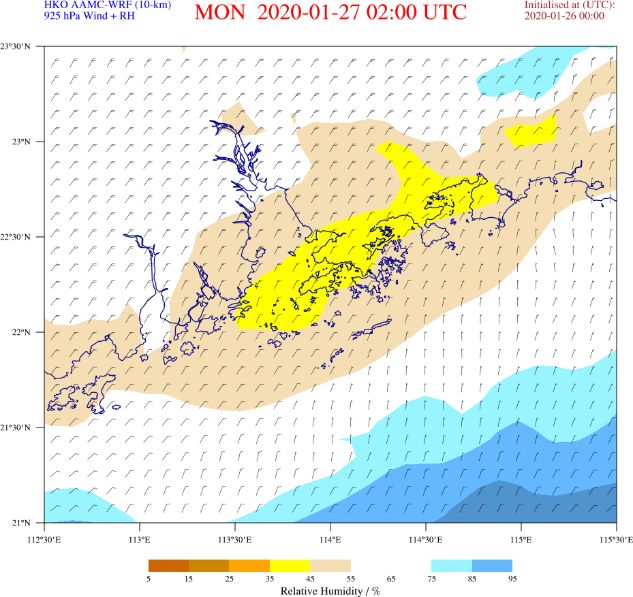
454455 456 457 Figure 11. Forecast upper-air winds and humidity fields by the AAMC-WRF at 500, 700 (top 458 row; left to right), 850 and 925 (bottom row; left to right) hPa isobaric levels. These are 459 taken from the real-time operational run initialised at 26 Jan 2020, 06 UTC. 460
461

462
463
464   Figure 12. Same as Figure 9 but using the output from a re-run initialised at 00 UTC,
465   26 Jan 2020 and valid at 02 UTC, 27 January 2020.
466
467

468
469
470   Fig. 13. Same as Figure 11 but using the output from a re-run initialised at 00 UTC, 26 Jan
471   2020 and valid at 02 UTC, 27 January 2020 .
472
473
474   Figure 14. Simulated radar reflectivity at 3-km altitude from a re-run initialised at 00 UTC,
475   26 Jan 2020 and valid at 02 UTC, 27 January 2020.             In the real-time operational run
476   (Figure 9 and 10), no simulated reflectivity could be seen at the altitude of 3-km.
You can also read