(ECSA HC)2 Brief: COVID-19 in East and Southern Africa: developments in the pandemic, July 2020
←
→
Page content transcription
If your browser does not render page correctly, please read the page content below
Regional network for Equity in health in east and southern Africa
     (EQUINET)1 and East Central and Southern Africa Health community
                                (ECSA HC)2

          Brief: COVID-19 in East and Southern Africa:
           developments in the pandemic, July 2020
This information sheet is the second presenting work summarising evidence as of July 17
2020 from official and scientific population data across countries in east and southern
Africa (ESA) on the COVID-19 pandemic, the responses to it and the relationship with
other indicators of population health, health systems and health determinants. The
information is sourced from World Health Organisation (WHO), official, public health and
technical/ scientific sources. The sources of information are cited or hyperlinked, with
hyperlinks to documents giving further details on indicators or issues raised. Further
information can be found on the WHO page on COVID-19.

The information sheet aims to address four questions:
a. What is happening with COVID-19 testing and detection
b. How and where is the epidemic progressing over time?
c. How has the health system responded?
d. What are the implications for wider vulnerability?

Key messages
In terms of the epidemic profile, increased testing has improved case detection, although still
at low levels for an effective public health response. Reporting the share of tests that are
positive will help to identify if transmission is rising and effective use of test resources. By July
17th most ESA countries had a rising pace of transmission and a sustained rise in total cases.
As exceptions, Mauritius, Uganda and DRC show plateauing of cases. The pandemic thus
continues to take different forms in different ESA countries. Average case fatality has risen.
While it remains lower than other regions globally, South African data suggests that excess
mortality has begun to rise later in the epidemic. Within country data is needed to explore this.
July 2020 data indicate that over 30% of populations in ESA countries have food insufficiency.
COVID-19 responses are projected to further increase food insecurity, particularly in east Africa
due to climate and locust related losses and in countries where reliance on remittances is high.
In terms of the health system response, the evidence in July further indicates that countries
with greater capacities at ports of entry and those that implemented a more stringent response
at the time of the first index case had a lower prevalence of cases. Continued constraints in
accessing diagnostics limit case detection, despite reasonable surveillance capacities. While
local production of continuous positive airway pressure ventilation is feasible, the wide variability
of access to ventilators in the region suggests a need to scale up such production and
procurement of care supplies, given the rising prevalence of COVID-19.
In terms of wider vulnerability, the slower, sustained increase in cases in the ESA region
raises concern on the effects of sustained implementation of measures such as school and
workplace closures. ESA countries with more rapid and stringent measures (such as Mauritius
and Uganda) have lower case prevalence and in Mauritius, a shorter highly stringent response
appears to have been effective in pandemic control. There is some evidence from some ESA
countries that there may be a ‘health debt’ in unmet management of other morbidity that would
need to be further explored. An average vulnerability index combining socio-economic, health
and health care data enables mapping of where attention may be most needed. While this is
best implemented within countries, its variation across ESA countries points to the need to learn
from positive situations and support responses where vulnerability is high, given that the
populations in the region will only be secure when vulnerability is reduced for all countries in the
region.

1
  EQUINET: Training and Research Support Centre, Dr Rene Loewenson,
admin@equinetafrica.org
2
  East Central and Southern Africa Health Community, Dr Willy Were, Prof Yoswa Dambisya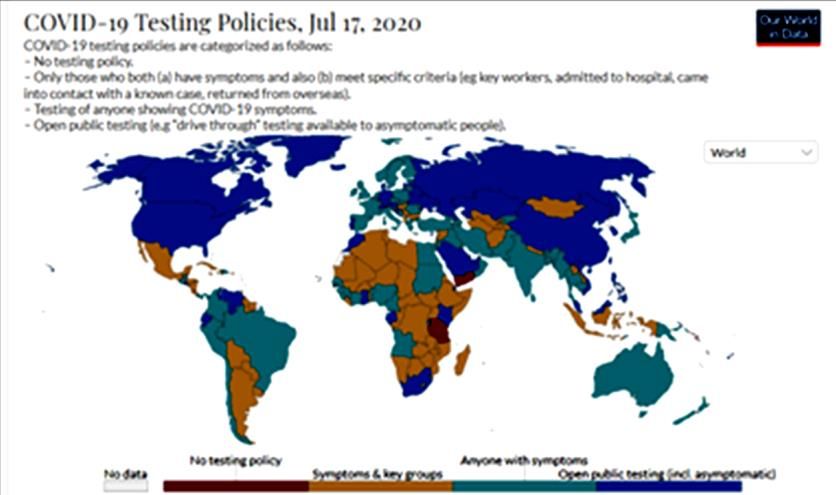
1. The data and COVID-19 testing and detection
The cross country data reported in this information sheet comes from official data,
reported on the WHO AFRO weekly situation reports; the online Worldometer database
updated daily; the WHO global health observatory data; World Bank World Development
indicators and other UN databases. Cross country databases were used to avoid having
different definitions for different countries. Some health systems data were obtained
directly from countries. The data sources are indicated in each section. As noted in the
first brief analysing population data, the data has limitations where testing levels are low,
affecting all evidence where case numbers are involved, including for mortality given the
unavailability of excess all-cause mortality to compare 2020 data with the previous 5 year
average. The available national data do not show the within country variations across
groups, and recent population data is not yet available for some indicators. COVID-19
data for the Republic of Tanzania was not available in the sources used after May 8 2020
and has thus been excluded from many areas of analysis in this brief.

Testing is one cornerstone              Figures 1 a, 1b and 1c: Test policies and positivity ESA countries
measure for public health
prevention and planning. Test
policies and the rate of antigen
testing for COVID-19 vary across
ESA countries (Figures 1a, 1b).
Testing has increased, as have
the reported cases and there is
some pandemic modelling in the
region. For example, the South
African government has set up a
National COVID-19 Modelling
Consortium as a primary source
of COVID-19-related projections,
with a COVID-19 dashboard with
pandemic updates for selected
ESA countries.

Most ESA countries report on
numbers of cases and numbers
of tests implemented. However,
there is need to distinguish
between rising report of COVID-
19 due to rising testing and a real
rise in the rate of pandemic
incidence. The positivity of tests
can help to provide this, that is
the share of tests that are
positive out of total tests done.

For countries like Mauritius,
South Africa and Botswana, high
rates of testing (Figure 1b)
suggests that reported cases
may provide a reasonable
reflection of COVID-19 rates in
the population, ie much higher in
South Africa, low in Botswana
and very low in Mauritius. Rising
positivity in South Africa (Figure
1c) suggests real increases in
the incidence of COVID-19. For
Kenya and Zimbabwe, where
testing rates are much lower,
rising cases may signal wider           Sources: Worldometer, 2020 and Our World in Data, 2020; Mauritius =
                                        152186 tests/million people July 17
testing, while rising test positivity
                                                                                                2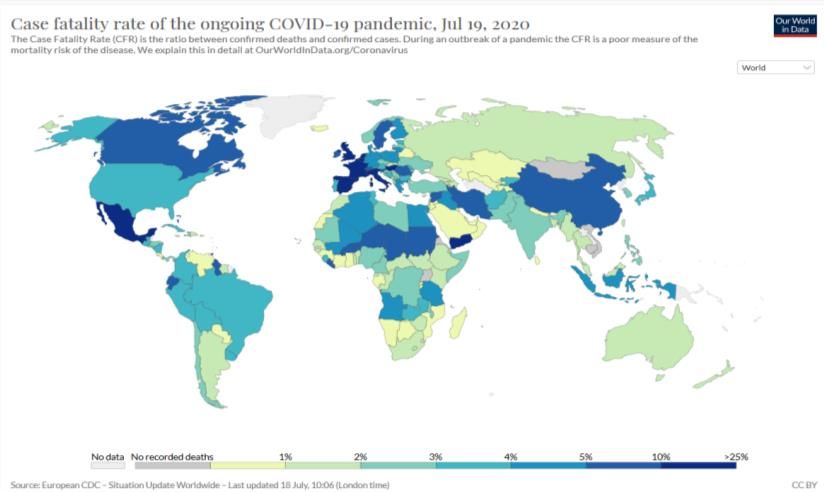
suggests that increases in case numbers are not simply due to rising testing levels but a
             real increase in transmission or more focused use of testing in areas where there is
             higher risk of infection. Figures 2a,b, and c provide further useful data.

Figure 2a Test and case data: South Africa                       Figure 2b: Test and case data: Kenya

                                                                 Global COVID-19 Dashboard, 2020

                                                               Figure 2c: Test and case data: Zimbabwe
Global COVID-19 Dashboard, 2020

             For all three countries, rising test positivity
             (a rate of increase in cases that exceeds
             the rate of increase of testing) points to a
             real increase in the incidence of COVID-
             19. (When the epidemic is declining, the
             test positivity falls even if numbers of tests
             are rising and some cases are still being
             reported). In Figure 2c for Zimbabwe, the
             lower figure shows the number of tests per
             positive case (converse to positivity) and
             suggests both a focus in use of testing and
             a rise in cases in late May.

             Given still low levels of testing in many
             countries, it is suggested that ESA
             countries report trends in test positivity,
             and where possible disaggregate this
             within countries.

             Testing is vital for the public health
             response. The testing shortfalls signalled in
             Figure 1b across most ESA countries 5             Global COVID-19 Dashboard, 2020
             months into the pandemic in the region suggest that the need and demand for essential
             diagnostics (tests and reagents) is not being met. While ESA countries are having to
             make most effective use of test resources to detect and manage outbreaks, given the
             rising level of local transmission within the general population reported in the next
             section, any shortfall in diagnostics is now a critical constraint for effective public health
             prevention through test, trace and isolate/quarantine strategies. As shown in Figure 2a
             for South Africa, after the lockdown was eased even from level 5 to level 3, the rapid
             reported rise in transmission highlights how widespread the implementation of test, trace
             and isolate needs to be to prevent such escalation.

             2. How and where is the epidemic progressing over time?
             To explore the epidemic progression in the region we explored data on the incidence and
             mortality from COVID-19 and how this has progressed over time for the different ESA
             countries. Table 1 overleaf reports this from official data sources indicated. The rates per
             million rather than absolute numbers take population differences into account.

                                                                                                          3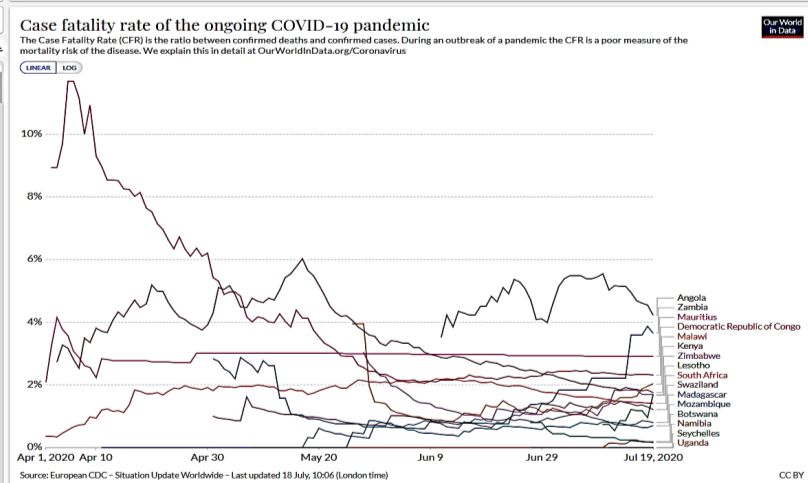
Figure 3: Days to doubling, June and July
The change in days to doubling of the
case numbers between June and July Days to doubling June 5-12 Days to doubling July 10-12
shown in Table 1 and Figure 3 indicates 20
changes in the pace of transmission of the
epidemic: The shorter the days to doubling, 15
the more rapid the speed of transmission.
The days to doubling have fallen between 10
June and July for 6 ESA countries and
remained relatively constant in 3, suggesting 5
a rise in the pace of transmission in the
period. While the epidemic has plateaued in 0
Mauritius, it has also slowed in Uganda and
Democratic Republic of Congo (DRC).
Table 1 Reported COVID-19 Cases in ESA
countries 17 July 2020
Total Estimated doubling Cases/ Total Total Case Tests / mn Cases in
cases time in days (ii) million deaths deaths / fatality people health
Country 17 people 17 mn rate 17 workers/
July 5-12 10-17 July 17 July 17 July July 17 July 1000
(i) June July (i) (i) (i) (i) (i) (iii)
Angola 638 9.3 10.1 19 29 9 4.50 304 0.0
Botswana 522 11.7 8.4 222 1 40 0.19 21830 42.0
DRC 8249 11.4 13.4 92 193 20 2.34 54.0
Eswatini 1619 9.0 10.9 1395 21 180 1.30 15128 43.0
Kenya 12062 10.5 11.0 224 222 40 1.84 4262 3.0
Lesotho 311 static 8.3 145 6 30 1.93 2815 0.0
Madagascar 1619 11.1 9.0 233 54 20 3.34 1146 26.0
Malawi 2805 11.9 10.3 146 55 30 1.96 1164 86.0
Mauritius 343 static 14.0 270 10 80 2.92 152186 90.0
Mozambique 1402 9.7 11.1 45 9 3 0.64 1360 0.0
Namibia 1078 11.3 8.7 424 2 8 0.19 6622 125.0
Seychelles 108 static 13.0 1098 0 0 0.00 0.0
South Africa 337594 9.8 10.4 5689 4804 810 1.42 39989 29.0
Uganda 1056 11.4 13.3 23 0 0 0.00 5213 0.0
Zambia 2810 11.5 9.1 153 109 60 3.88 3692 43.0
Zimbabwe 1420 10.8 9.3 95 24 20 1.69 6704 27.0
DRC = Democratic Republic of Congo mn = million. Tanzania has not provided data to these sources since May
so is not included. Sources: (i) Worldometer 17/7/2020 (ii) Doubling time estimated from the total case numbers
and days between periods shown. (iii) WHO AFRO 12 May
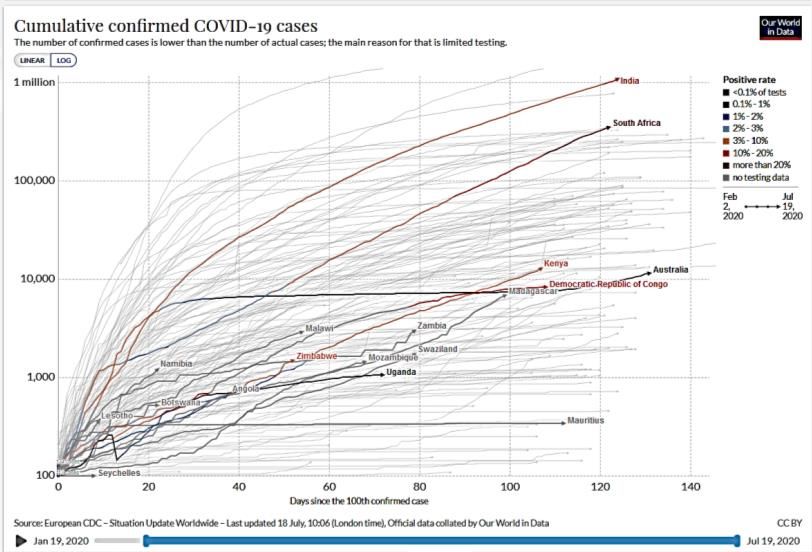
Figures 4a and 4b show the rapid Figure 4a Cumulative confirmed COVID cases, ESA countries
rise in cases in most ESA countries
in the last month. In addition to South
Africa, Kenya, Madgascar, Zambia,
Malawi, Zimbabwe and Namibia
appear to be entering a phase of
exponential spread. Aligning the
different epidemics to a common
start point (the date 30 cases/day
were reached) - as shown in the
logarithmic form in Figure 4a -
indicates that for most ESA
countries, the rise in cases has
continued. South Africa’s epidemic
curve has been the highest, but all
appear to be following a slope similar
4
Source: Our World in Data, 2020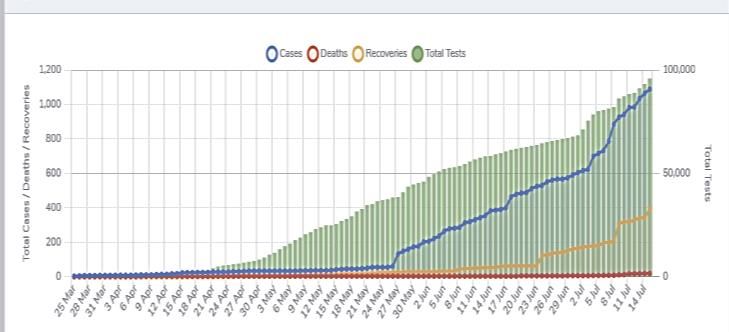
to that of India than of the steeper rise in European countries. This suggests a more
sustained epidemic rise over time in ESA countries, requiring a longer period of
stronger social distancing and a sustained strain on social and economic activity.

Figure 4b Cumulative cases April 29-July17, ESA countries excluding South Africa
13000

                                                                            Angola
12000
                                                                            Botswana
11000
                                                                            DRC
10000
                                                                            Eswatini

 9000                                                                       Kenya

 8000                                                                       Lesotho

                                                                            Madagascar
 7000

                                                                            Malawi
 6000
                                                                            Mauritius
 5000
                                                                            Mozambique

 4000
                                                                            Namibia

 3000                                                                       Seychelles

 2000                                                                       Uganda

                                                                            Zambia
 1000
                                                                            Zimbabwe
     0
         1    2    3    4    5    6    7    8    9    10   11   12

Source: Worldometer data; Time periods: 1=29 Apr; 2=6 May 3=12 May; 4=19 May; 5=26 May; 6=5 June;
7=12 June; 8=22 June; 9=26 June; 10=3 July; 11=10 July; 12=17 July
South Africa excluded as case rises significantly exceed Y axis July 17 at 337 594

The exceptions to this are Mauritius, where the epidemic has clearly plateaued in a
similar curve to that of Australia, and Uganda and DRC, where the epidemic curves seem
to be slowing. The response in these countries is further discussed in the next section,
although the recent rise in cases in Australia shown in Figure 4b suggest that any
plateauing or slowing cannot be taken for granted and demands attention to outbreak
prevention and control.

There is a gender differential in cases. Not all ESA countries disaggregate cases by gender,
but some do. UN Women (2020) report the sex differentials in COVID-19 cases as 31%
female to 69% male in Kenya, compared to 57% female to 42% male in South Africa,
showing significantly different ratios, the reasons for which would need to be explored. The
data in Table 1 suggests that case fatality rates vary widely across ESA countries and as
shown in Figure 5b, have varied within the same country over time. In part this relates to the
variability in testing rates and accuracy of detection of deaths vs cases, especially when
testing is largely done in hospital rather than community settings, where cases detected (the
denominator) are severe and more likely to result in fatality (the numerator). The average
case fatality rate in the ESA region, excluding Tanzania, was 1.76% by July 17, higher than
the mid-June level reported in the last brief of 1.46%. The ESA case fatality rates are lower
than in other global regions in the north, as shown in Figure 5a.

                                                                                                    5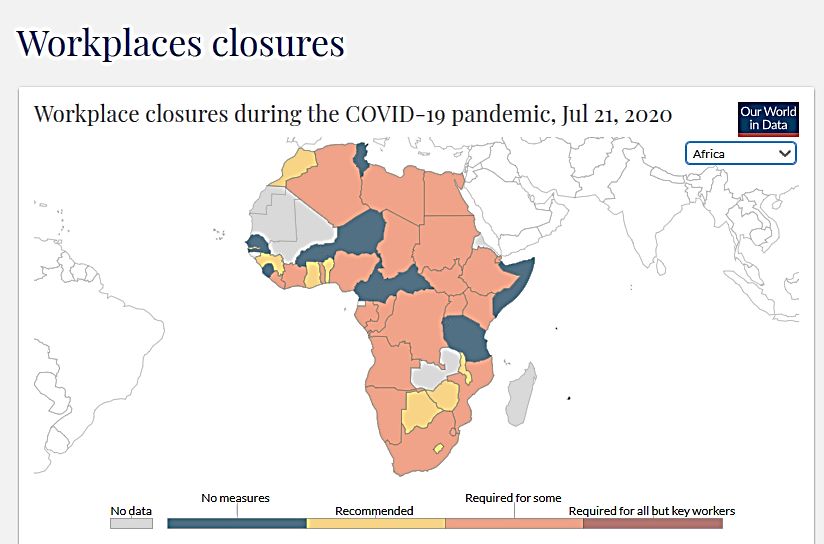
Figure 5 Case fatality rates July17, a. globally and in b. ESA countries
The only country for which the              over time
excess mortality from COVID-19
was available in any online source
was South Africa, with the findings
from analysis by Burn-Murdoch,
(2020) shown below.

This analysis of the difference in all-
cause mortality for the epidemic
period compared to the average for
the same period in the past 5 years
indicates that excess mortality
began to rise later in the
epidemic. The question is whether
this is a result of the level of cases
rising, or if it is due to the spread to
older communities, such as those in
rural areas.
                                            Source: Our World in Data, July 17, 2020

As the multi-country study by
Dowd et al, 2020 showed, the age            Figure 6: Case fatality vs share of population > 65 years
structure of populations may help to
explain differences between countries               % pop >65 years          Case fatality rate (%) July 17
in COVID-19 related mortality. In the
June brief we did not find any                12
relationship between COVID-19 related
mortality and the share of people in          10
older age groups in the population, and
                                               8
the same was the case in July, with no
statistical correlation found. It may thus     6
also relate to when in the epidemic
these age groups are more at risk. If,         4
as in many cases, the epidemic starts
in urban areas where populations are           2
generally younger and only spreads in
                                               0
later stages through within country
movements to rural areas where more
elderly people live, we may not see
raised mortality at population level until
later in the pandemic within countries.
Overall mortality data is still very low.  Sources: Worldometer data, World Bank development indicators

The data once again shows that it is not valid to generalise about the epidemic in the
region- it is taking different forms in different ESA countries. This is not surprising -
Rwema et al (2020) note the diversity in the transmission dynamics of other respiratory
pathogens across the continent, including in influenza seasonality and strains, even
between neighboring countries. The determinants and responses differ across and within
ESA countries.
                                                                                                     6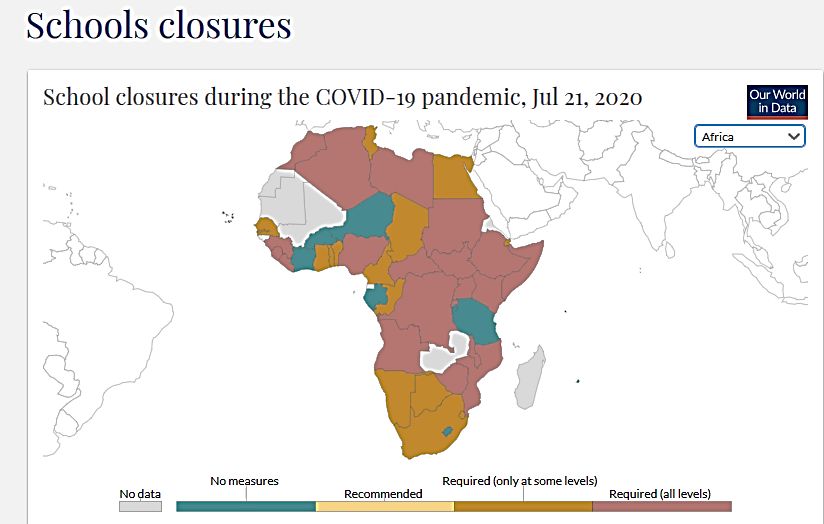
The June report observed the raised risk of infection in health workers in some ESA
countries. Also, as found in the June report, we did not find any relationship between case
fatality rates in July and the reported prevalence of diabetes or tuberculosis. These
relationships may not be easily assessed at the still low rates of COVID-19-related mortality
in the population. The first brief on population data reported on social determinants of risk
and vulnerability in relation to COVID-19 cases.

The United Nations in June         Figure 7: Case data July 2017 ESA countries and food security
2020 estimated that from
real-time household food
security monitoring and
model-based estimates that
deteriorating employment
conditions and other factors
may have pushed as many
as 15 million people in Sub-
Saharan Africa into acute
food insecurity since
February 2020. Measures to
control or mitigate COVID-19
outbreaks are already
affecting global food supply
chains and markets. World
Food Programme data for
July 2020 in Figure 7 suggest      Worldometer, 2020; South Africa is at 5689 cases/mn(axis cut); World Food
that 8 ESA countries for           programme 2020
which data are available
already have over 30% of their populations with food insufficiency and that chronic child
undernutrition is a major health challenge. The data in Figure 7 suggest that food
insecurity exists for countries
with both high and low reported        Figure 8: Food security and remittances, ESA countries
levels of COVID-19. The UN
report that rather than COVID-
19 cases themselves, COVID-19
related economic factors may
push a further 25 million people
into extreme poverty in the
continent, with consequences
for severe food insecurity. In
East Africa the pandemic
coincided with ongoing heavy
rains and the worst locust
swarms in a decade threatening
crops. The World Bank projects
a 23% decline in remittances to
Sub-saharan Africa in 2020, in
part due to falling employment in
                                       Worldometer, 2020; World Food programme 2020
key remittance sending
countries due to COVID-19.
This will add a further challenge for households in meeting food needs in ESA countries
with higher levels of remittance contributions and moderate to high levels of food
insecurity (Lesotho, Uganda, Zimbabwe shown in Figure 8).

3. How has the health system responded?
The public health response to the COVID-19 pandemic is not the responsibility of the health
system alone. It also calls on public information, availability of safe water, soap, food, job
security and social protection and the work of many other sectors, some of which were
discussed in the previous information brief.

                                                                                                7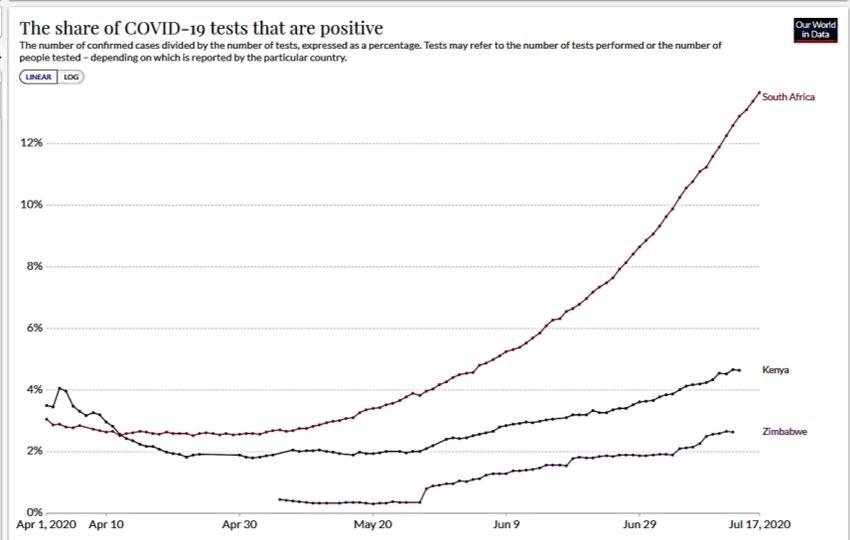
The first section discussed the level of testing as a core feature of the test, trace and isolate
response. Table 2 shows updates on selected indicators of different aspects of the public
health response, including pandemic preparedness through capacities at land, sea and air
ports and for surveillance, as required in terms of the International Health Regulations (IHR)
(2005) care for cases. The first clinical trial in South Africa and on the continent for a COVID-
19 vaccine was announced on 23 June, as a co-operation between Wits University, the
University of Oxford and the Oxford Vaccine Group. A separate brief outlines wider issues of
access to essential health products in the region. Further disaggregations not yet available
are needed to show protection of health and other frontline workers from infection, together
with qualitative evidence on different forms of community engagement. There are many
stories beyond these numbers on how health systems are being affected. There is a wider
‘health debt’ of unmanaged health problems, including mental health challenges, that have
grown under COVID-19, discussed later in this section.

Table 2 Indicators of health system responses ESA countries 17 July 2020
                             Covid-19
                           Government
                            stringency
               Tests /       index (ii) # total              1000         # nurses
Country        million Index                                                                                    TB case
                                         hospital # ICU      people and              IHR         IHR
               people date As of beds / beds / 1 per                      midwives capacities capacities detection
               17 July 1st        July
                                         1000      million ventilator / 100 000 ports of surveillance rate %
               (i)                17                                                                            (vi)
                          case           (iii)     pop (iv) (vii)         pop (v) entry (iii) (iii)
Angola                304 92        76       0.8       3.4                    130          30          100           61
Botswana           21830 69         49       1.8      63.9                    330           0           60           59
DRC                        15       81       0.8       0.7                     47          30           60           63
Eswatini           15128 14         81       2.1         0                    383          80           80           80
Kenya               4262 31         81       1.4       9.7     198.4          150          50           80           63
Lesotho             2815 74         55       1.3       4.7                     65          30           60           55
Madagascar          1146 94         69       0.2         0    4377.0           11          30           60           55
Malawi              1164 51         57       1.3         0    1067.2           25          20           80           48
Mauritius         152186 6          22       3.4      95.2                    340          80           60           80
Mozambique          1360 22         75       0.7         0     867.5           44          40           80           57
Namibia             6622 9          52       2.7      44.6     244.8          280          60           80           61
Seychelles                 23       33       3.6    326.5                     330          40           80           87
South Africa       39989 17         81       2.8      55.7      18.0          350          60           20           76
Uganda              5213 58         87       0.5       1.5     776.8           63          40           80           65
Zambia              3692 20         51       2.0       5.5                     89          80           60           58
Zimbabwe            6704 27         70       1.7       4.1     902.4          120          30           60           83
DRC = Democratic Republic of Congo Tanzania has not provided data to these sources since May so is not
included.Sources: (i) Worldometer 12/6/2020 (ii) Oxford COVID-19 Government Response Tracker 2020 (iii) WHO
Global Health Observatory 2020 (iv) Reuters 2020 (v) African health statistics 2020 (vi) World Bank 2020 (vii) One
Africa COVID Tracker
                                                Figure 9: Cases/ million July 17 and IHR capacities at points of entry
The June brief showed the role of
IHR capacities for points of
entry and for surveillance.
Table 2 and Figure 9 show more
clearly the role of capacities at
ports of entry using July 17 case
prevalence. Seychelles and
South Africa both with high levels
of international traffic with lower
levels of capacities at points of
entry have higher case rates than
Mauritius, which has high port
capacities and international
                                                                                                     8
                                           Source: Worldometer, 2020; WHO, 2020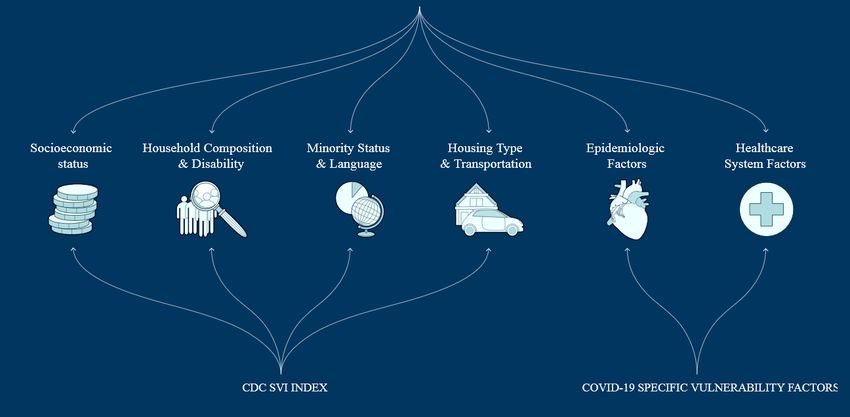
traffic. While South Africa has now limited international traffic at the cost of income from this,
Seychelles and Mauritius have opened to international air traffic. As noted in the earlier brief,
while most ESA countries implemented early travel bans, an average IHR capacity for points
of entry of 44% for ESA countries collectively indicates a need to strengthen port capacities
for when these travel restrictions are lifted, particularly for those with long land borders. The
previous brief observed from the gap between the high average TB case detection rate in the
region (65% as shown in Table 2) and the much lower rate of COVID-19 testing for all except
Botswana, Mauritius and South Africa point to the gap in effective test and trace systems in
terms of access to the technology, noted earlier.

The June brief discussed the            Figure 10: People per ventilator in selected ESA countries
evidence on health sector
capacities and levels of COVID-19
and case fatality in ESA countries.
With rising incidence and several
months since first cases demand
on services is likely to rise. There is
wide variability in the availability of
ventilation equipment for those
countries for which information is
available (Table 2 and Figure 10).
While South Africa has a better
rate of 18 000 people/ventilator,
two thirds of South Africa’s 3216
ventilators are in the private sector
and potentially inaccessible to the     Source: One Africa COVID Tracker, 2020; data not available for selected
                                        countries
wider population. Yet continuous
airway pressure (CPAP) equipment can be produced in the region. In April, for example,
South Africa’s National Ventilator Project indicated an aim to locally produce at least 10,000
ventilators by the end of June, although more recent evidence suggests that this goal has not
been reached.

The early and strengthened response in most (not all) ESA countries is shown in Figures 11a
and 11b for March to July 17, according to an index compiling 8 different elements of the
response (see Oxford COVID-19 Government Response Tracker, 2020).

Figures 11a and 11b: Covid-19 Government response Stringency index March 11 and July 17

Source: Oxford COVID-19 Government Response Tracker 2020

In the June brief we noted that the level of stringency of the response on the date of the
first index case appears to have been important for later case incidence- the lower the
stringency, the higher the current cases, and vice versa. Figure 12a below suggests that this
relationship still holds a month later for the case levels in July 2020.

                                                                                                9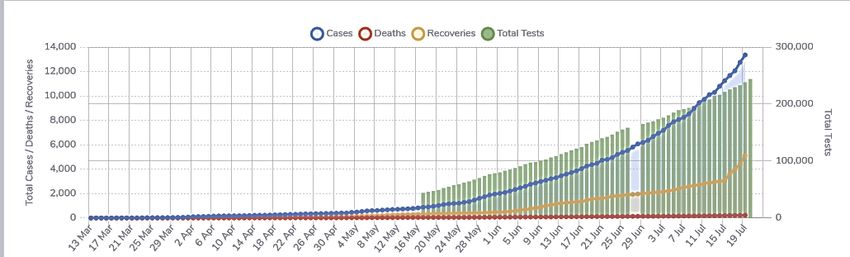
Figure 12b suggests            Figure 12a: Covid-19 cases vs the Govt stringency index at 1st case
that this relationship
with the stringency
index is less clear in
relation to current
transmission (noting
that longer days to
doubling suggest
lower rates of
transmission). While
testing levels lead to
caution on evidence
on transmission
levels, one reason
for this may also
relate to the
responses as                   Figure 12b: Days to doubling July 10-17 vs the Govt stringency index July 17
formally intended
and their application
in practice.

Mauritius which has
had a sustained
plateauing of the
epidemic had a
combined hard and
early lockdown over
3 months that led to
a plateaued
epidemic and lifting
of the lockdown in
mid-June. The
measures applied
are shown below:
                               Source: Worldometer 2020, Oxford COVID-19 Government Response Tracker 2020

                                    Table 3: Mauritius COVID-19 response: key steps
22nd Jan 2020      Screening at the airport; Fever measurements and separation of at-risk passengers
28th Feb           Quarantine of visitors from countries with a high number of cases, despite no cases yet reported
From Feb           Persistent media campaign to raise awareness on how to prevent transmission of the disease
12th March         Independence Day celebrations in schools stopped. The Prime Minister addressed the nation regularly
                   on national television and set up a communications cell in his office. The Ministry of Information and
                   Communication Technology developed a mobile app called ‘beSafeMoris’. It provides official up-to-
                   date information, statistics and useful tips, and can be downloaded and used free of charge.
18 March 2020      First 3 cases, next day 4 cases—all imported. The Prime Minister announced the first case in
                   Mauritius live on national television
19th March         Stringent measures imposed: Closure of schools; borders closed to international arrivals, apart from
                   repatriating nationals; limited public transport and only essential workers allowed to report for duty.
                   The Mauritian citizens were generally happy with government care and online classes for primary
                   schools and those broadcast on national television highly appreciated. The government’s daily press
                   releases and intensive awareness campaign key to social support.
24 March           Case numbers > 42; A sanitary curfew is applied and supermarkets, bakeries, and shops are closed,
                   despite some public dissatisfaction. Basic food items distributed to families on the Social Register of
                   Mauritius; cash transfers of 50% of minimum wage; fees for market stalls waived during the curfew.
Up to 30th March   128 cases. Fever clinics instituted at public hospitals to separate potentially infected and symptomatic
                   patients from other patients; contact tracing put in place
15th April         The curfew relaxed
29th April         332 cases reported; 306 patients recovered, 29 in quarantine. 15,893 tests conducted up to this date.
30 May-June 13     Lockdown lifted in stages and completely, 337 cases
Source: Jeeneea and Sukon, 2020 , UNDP, 2020

                                                                                                               10
4. What are the implications for wider vulnerability?
The slower rate of rise of the epidemic in the ESA region than some other regions globally
raises the question of the wider effects of sustained implementation of some of the
prevention methods. For example the application of measures such as school and workplace
closures varies across ESA countries, as shown in Figure 13a and b. Tanzania lifted school
closures in June and does not have workplace closures in July, while Angola, DRC, Uganda,
Kenya and Mozambique report more stringent measures for both areas. These latter
countries also all have lower COVID-19 prevalence levels. It will be important to track
whether this implies a shorter period of such measures, as in Mauritius, given their wider
effect on children’s schooling and workers incomes.
Figure 13 ESA country prevention measures a. School closures b. workplace closures
Source: Our world in data, 2020;
One area where there is emerging evidence is of the ‘health debt’, the potential fallout from
services of other conditions when services are strained by COVID-19 or when people avoid
services. The evidence on this is still limited. Table 4 provides evidence on reported facility
cases of different conditions comparing the same periods in 2019 with 2020. A negative
figure suggests that 2020 cases reporting to facilities were lower than those in 2019.
Table 4 Health information data selected ESA countries, May-May facility cases 2019, 2020
OPD cases In patient TB cases at Diabetes Road traffic
Country
2020 vs cases 2020 facilities 2020 cases 2020 accidents 2020 Asthma cases
2019 vs 2019 vs 2019 vs 2019 vs 2019 2020 vs 2019
Eswatini 87218 -11270 -80 -3633 -506 -905
Kenya Na Na -417 -20232 1190 -24705
Lesotho -103352 -4346 -271 -1375 -19 -350
Zambia 435473 -1056 -1538 -1768 753 -4139
Source: Country health information systems
The table indicates that case numbers were lower in 2020 than 2019 for a number of areas
of service use for the four countries. This trend was less evident for road traffic accidents and
would need to be explored, including in relation to the different timings of travel restrictions,
with some lifted by May. Inpatient declines were greater than outpatient. The reasons for this
decline in 2020 and how far it related to avoiding service contact due to fear of exposure, as
has been reported in other countries, would need to be explored. Abbas et al, 2020 report
concern that routine childhood immunisation services may decline as people cannot gather
in outreach services or visit services. They assessed that the deaths prevented by sustaining
routine childhood immunisation in Africa outweigh the excess risk of COVID-19 deaths
associated with vaccination clinic visits, especially for the vaccinated children and argue that
routine childhood immunisation should be sustained as much as possible. Suppression
measures and service demand may however lead to a level of unmet health need after
lockdowns list. The size of this ‘health debt’ in the region is not clear and needs follow up
assessment to plan for measures to address it.
11The within and across country vulnerability to COVID has been mapped in some countries
and regions. For example the COVID-19 Community Vulnerability Index (CCVI) in the USA
combines the individual measures of vulnerability shown below to prepare a combined index
that is mapped for specific communities within areas or states in the country.
Source: US CDC, 2020
Indicators of these features for ESA countries shown in Table 5, and the ranking of countries
on each were used to provide an average vulnerability index for ESA countries, with 1=least
vulnerable and 17= most vulnerable.
Table 5 Indicators of health system responses ESA countries 17 July 2020
Househ
old House-
Socioeconomic compos Mino- hold Epidemiolo-gical Health system
status ition rities features factors factors
% access # total IHR Covid govt
GINI Number to hand- Cases/ Days to hosp- capaciti Ave response
Country coe- GDP/ House- mi- washing mn doubling ital es vulnera stringency
fficient capita hold grants with soap July 17 July 10-17 beds / surveill bility index
(i) 2019 (i) size (ii) 2019 (i) (iii) (iv) (iv) 1000 (i) ance (v) index 17 July (vi)
Angola 51.3 2974 2.3 106845 39 19 0.9 0.8 100 9.75 76
Botswana 53.3 7961 3.7 160644 60 222 8.4 1.8 60 10.00 49
DRC 42.1 545 5.3 545694 20 92 13.4 0.8 60 10.00 81
Eswatini 54.6 3837 4.6 31579 58 1395 10.9 2.1 80 7.88 81
Kenya 40.8 1817 3.9 1084357 30 224 11.0 1.4 80 9.75 81
Lesotho 44.9 1158 3.3 6572 44 145 8.3 1.3 60 10.38 55
Madagascar 42.6 522 4.7 32075 10 233 9.0 0.2 60 11.00 69
Malawi 44.7 412 4.5 215158 44 146 10.3 1.3 80 9.50 57
Mauritius 36.8 11204 3.5 28585 93 270 14.0 3.4 60 5.63 22
Mozambique 54.0 492 4.4 222928 24 45 11.1 0.7 80 10.63 75
Namibia 59.1 4958 4.4 93888 34 424 8.7 2.7 80 10.38 52
Seychelles 46.8 17402 3.8 12791 100 1098 13.0 3.6 80 6.63 33
South Africa 63.0 6001 3.2 3142511 73 5689 10.4 2.8 20 12.75 81
Uganda 42.8 777 4.7 749471 19 23 13.3 0.5 80 9.75 87
Zambia 57.1 1291 5.1 127915 31 153 9.1 2.0 60 10.00 51
Zimbabwe 44.3 1464 4.1 398866 39 95 9.3 1.7 60 9.88 70
mn = million; DRC = Democratic Republic of Congo Tanzania has not provided data to these sources since May
so is not included .Sources: (vi) World Bank 2020 (ii) UN Pppulation 2020 (iii) WHO and UNICEF 2015; (iv)
Worldometer 17/7/2020 (v) WHO 2019 (vi) Oxford COVID-19 Government Response Tracker 2020
12The distribution of the average vulnerability index using the masures noted across ESA
countries shown in Table 5 indicates that combining various features of vulnerability from
COVID-19, three countries are lowest levels (Mauritius, Syechelles and Eswatini) and
two at highest levels (South Africa and Madgascar). Figure 14 shows the relationship
between the average vulnerability index and the government stringency index for July for
ESA countries. For countries at low levels of both (Mauritius and Seychelles), the
concern remains to ensure the prevention of outbreaks and to manage the longer term
consequences of COVID-19, while for countries where vulnerability is higher and the
stringency of response low (such as Zambia and Namibia) the concern remains to
strengthen the pandemic response. The figure indicates, however, that many ESA
countries have a high stringency of their (formal) response relative to their vulnerability at
country level. What this does not tell is what areas and groups are more vulnerable within
countries to ensure resources reach these areas/ groups.
Figure 14: Average Vulnerability index and Government stringency index, July 2020 ESA
countries
Source: Author calculations and Oxford COVID-19 Government Response Tracker 2020. Excluding
Tanzania
Vulnerability mapping is generally done within countries to support resource allocation
and planning of responses, and it may be useful for countries to choose the relevant
imidicators and implement this to focus resources where they are most needed, to
prevent transmission and to manage vulnerability.
At regional level, mapping how vulnerability is distributed across the region is, however,
still relevant, given that the populations of the region will only be secure when
vulnerability is reduced for all countries in the region. For the majority of ESA countries,
rising cases show that the focus is on suppressing transmission and vulnerability. For
those where transmission has plateaued or shows signs of doing so, while we draw
learning from their experience, the second waves and outbreaks in countries with more
advanced epidemics point to the need to capacitate community, local and central
systems to prevent and control outbreaks and vulnerabilities arising from the pandemic.
13You can also read