Rivercrossing Countdown Ashburton - Retail Assessment Prepared for: Progressive Enterprises Ltd
←
→
Page content transcription
If your browser does not render page correctly, please read the page content below
Rivercrossing Countdown
Ashburton
Retail Assessment

Prepared for: Progressive Enterprises Ltd

Date: May 2014
Status: Final
Rivercrossing Countdown Ashburton
   Retail Assessment

  Progressive Enterprises Ltd

  Document reference: PEL 132.14
  Date of this version: May 2014
  Report author(s): Derek Foy

  Disclaimer
  Although every effort has been made to ensure accuracy and reliability of the information contained in this report,
  neither Market Economics Limited nor any of its employees shall be held liable for the information, opinions and
  forecasts expressed in this report.

                                                                                              Market Economics Limited
                                                                                                 Level 5, 507 Lake Road
www.me.co.nz                                                                                  PO Box 331 297, Takapuna
                                                                                                     Auckland 0740, NZ
                                                                                                          P 09 915 5510
Contents
1        INTRODUCTION ..................................................................................... 1

1.1     BACKGROUND ................................................................................................ 1

1.2     OBJECTIVE .................................................................................................... 1

1.3     OVERVIEW .................................................................................................... 2

2        ASHBURTON BUSINESS ZONING ............................................................ 4

3        DEMAND AND SUPPLY ASSESSMENT ..................................................... 6

3.1     2013 CENSUS ............................................................................................... 6

3.2     HOUSEHOLD PROJECTIONS ................................................................................ 6

3.3     ASHBURTON RETAIL DEMAND ORIGIN AND DESTINATION......................................... 7

3.4     SUPERMARKET DEMAND PROJECTIONS ................................................................ 9

3.5     ASHBURTON SUPERMARKET SUPPLY .................................................................. 11

3.6     ASHBURTON DEMAND-SUPPLY BALANCE............................................................ 11

4        POTENTIAL IMPACTS............................................................................ 13

4.1     SUPERMARKET SALES IMPACTS......................................................................... 13

4.2     OTHER RETAIL IMPACTS ................................................................................. 14

4.3     IMPACTS ON CENTRES .................................................................................... 15

5        MATTERS OF INTEREST TO COUNCIL .................................................... 16

6        CONCLUSIONS ..................................................................................... 18

APPENDIX 1: BNZ MARKETVIEW DATA............................................................. 20
Figures
FIGURE 1.1: INDICATIVE CATCHMENTS OF PROPOSED SUPERMARKET ............................................................. 3

FIGURE 2.1: LOCATION OF PROPOSED DEVELOPMENT ................................................................................. 5

FIGURE 3.1: MAIN TRADE AREA HOUSEHOLD PROJECTIONS ......................................................................... 7

FIGURE 3.2: ORIGIN OF SALES IN ASHBURTON STORES ................................................................................ 8

FIGURE 3.3: DESTINATION OF ASHBURTON RESIDENT SPEND ....................................................................... 8

FIGURE 3.4: ASHBURTON CONSUMERS’ SUPERMARKET SPEND DESTINATIONS (2013, $M) ............................... 9

FIGURE 3.5: DESTINATION OF ASHBURTON RESIDENT SPEND (2013, $M) ...................................................... 9

FIGURE 3.6: MTA SUPERMARKET/GROCERY DEMAND PROJECTIONS ($M)................................................... 10

FIGURE 3.7: MTA SUPERMARKET/GROCERY DEMAND PROJECTIONS (GFA, M2) ........................................... 10

FIGURE 3.8: ASHBURTON DISTRICT SUSTAINABLE SUPERMARKET/GROCERY SPACE (GFA, M2) ......................... 11

FIGURE 3.9: 2013 MTA SUPERMARKET/GROCERY SUPPLY (GFA, M2) ....................................................... 11

FIGURE 3.10: ASHBURTON DISTRICT SUSTAINABLE SUPERMARKET/GROCERY SUPPLY (GFA, M2) ..................... 11
1 Introduction
1.1 Background
Progressive Enterprises Ltd is investigating the feasibility of developing a second Countdown
store in Ashburton, provisionally called the ‘Rivercrossing Countdown’. The proposed store
would be a new building of some 4,200m2 gross floor area (GFA) on the corner of East and
South Streets. Market Economics Ltd (M.E) completed a feasibility study for the same proposal
in 2012, at which time a private sector developer (Tricroft Properties Ltd) had commissioned
the report for the purposes of entering into negotiations with Progressive. Progressive has
now commissioned M.E to provide an updated version of that 2012 assessment, taking into
account any changes in Ashburton’s retail demand (e.g. market size) and supply (the
competitive environment) since 2012.
The site is on land zoned partly Business 5 and partly Business 3A in the Operative District Plan,
which is proposed to be changed to Business D in the Proposed Plan. The operative Business
3A zoning “makes provision for retail activities within larger retail premises, which (…) will not
detract from the role and function of the inner commercial area, particularly from the vitality
and convenience of its comparison retailing”. The proposed Business D zone will make
retailing a discretionary activity to limit how much retail can locate in the zone, and to ensure
the on-going viability of Ashburton’s main commercial areas.
These rules indicate that the District Plan has, and will continue to have, a centres-based focus
for the location of retail activity, which makes the potential impact of any new retail
development on existing commercial areas a key concern in any consent application for a retail
activity outside those areas (such as the proposed Countdown).
1.2 Objective
The objectives of this assessment are to:
Summarise the current and expected future retail environment in Ashburton, with a
particular focus on the Ashburton town centre.
Describe in qualitative terms the expected impacts of the retail development on other
Ashburton’s centres, and how the catchments of those centres might change.
Provide a high-level overview of the issues relating to retail impacts that will need to
be addressed as the proposal is put to Council.
This report provides a feasibility assessment, and does not provide a detailed quantification
of expected impacts such as would be required to accompany a consent application. A more
detail impact assessment will be required in the future should the development proposal
proceed to that stage. The complete assessment will allow the Ashburton District Council
1(ADC) to both have confidence in what effects to expect and to understand the degree to
which the application will be consistent with the District Plan.
1.3 Overview
1.3.1 The Site
The development is proposed for the corner of East and South Streets in Ashburton, which is
to the immediate east of the Ashburton River. East Street in this location is State Highway One,
the main arterial route through Ashburton. The development site is currently occupied by a
transport company and a timber wholesaler. These activities are proposed to be replaced by
the ‘Rivercrossing Countdown’, a new purpose-built supermarket of 4,200m2 gross floor area
(GFA). The supermarket is to be the only retail activity on the site, and no ancillary retail is
proposed under the application.
1.3.2 The Area
Ashburton is half way between Christchurch and Timaru on SH1, just over an hour’s drive from
each. Ashburton is a town of some 18,930 people, making it the largest population centre
between Christchurch and Timaru (population 27,600). Most of the Ashburton District
population uses Ashburton town as their main service centre, as the next largest towns in the
District are Methven (population 1,630), Rakaia (population 1,180) and Hinds (population
390), none of which have significant retail offerings.
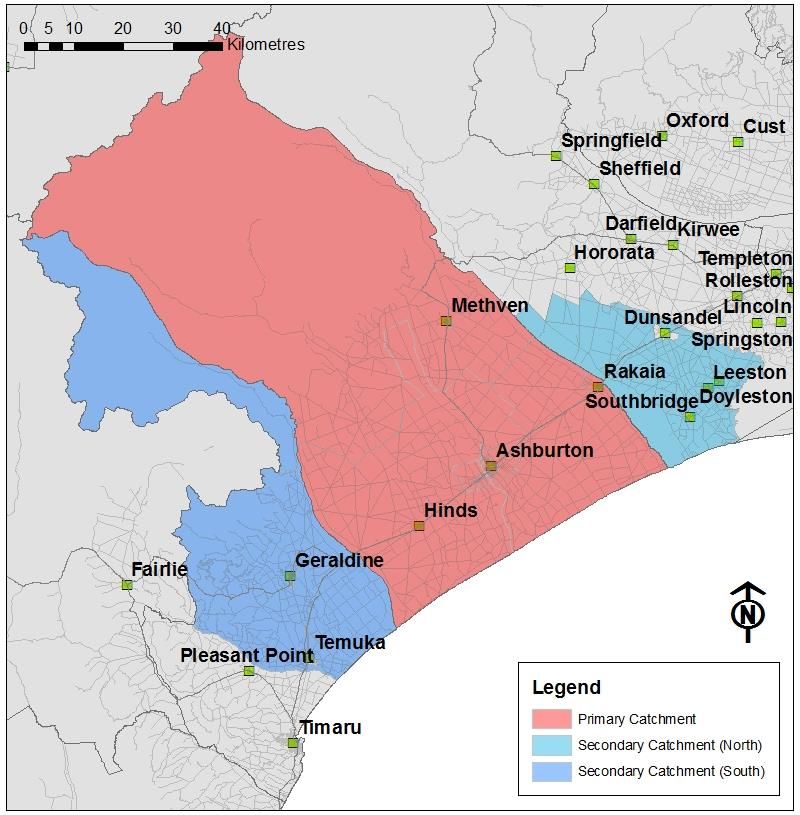
Ashburton town’s primary retail catchment is the extent of the Ashburton District, and the
secondary catchment extends into neighbouring Timaru (to the south) and Selwyn (to the
north) Districts. The primary catchment provides the vast majority of retail sales to town
businesses, with the secondary catchment market being of much less importance to
Ashburton businesses, as explained below in section 3.3. The proposed Rivercrossing
Countdown will share this catchment with Ashburton town’s other retail and service
businesses, including the three existing supermarkets. The extent of the catchments is shown
in Figure 1.1.
2Figure 1.1: Indicative Catchments of Proposed Supermarket
32 Ashburton Business Zoning
M.E’s 2012 assessment was subject to the then Operative District Plan. At that time, the
Proposed District Plan was in the hearings phase and was still subject to change. Subsequently
that hearings process has finished, and appeals to the decisions are now being heard. What
was the Proposed District Plan has now become the Partly Operative District Plan, and it is
that document that is reviewed here. Our understanding is that none of the outstanding
appeals are likely to have any material impact on the proposed Countdown.
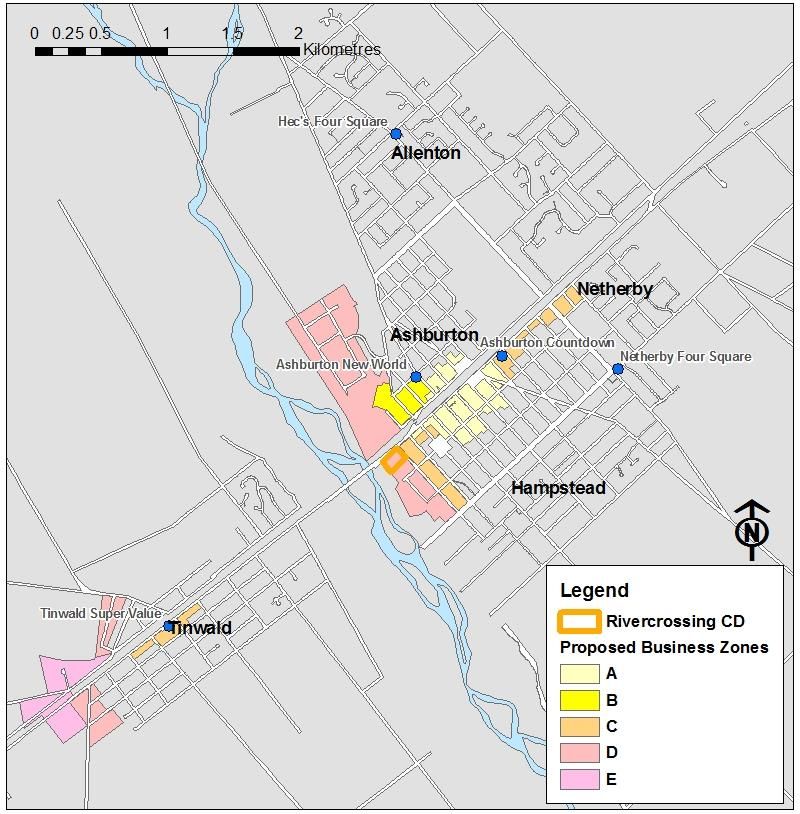
The focus of commercial and retail activity in the Ashburton District is the Ashburton town
centre, which has several zones stepping out from the main shopping area which lies at the
core. These zones are described in the Partly Operative District Plan, and shown in Figure 2.1:
The town centre core is zoned Business A. This zone provides principally for small scale
retail activity, as well as for a range of accommodation, community and commercial
uses (section 5.3.1 of the Plan). Ashburton’s suburban centres are also zoned Business
A.
To the western end of the core north of the railway is the Business B zone, which
provides predominantly for large-scale retail activities. The New World is in this zone,
and the zone provides “for the establishment of supermarkets as the amenity values
anticipated within the zone will be compatible with supermarket shopping” (section
5.3.2 of the Plan).
The Business C zone provides for commercial, retail, service and community activities,
and the largest areas with this zoning are adjacent to the Business A and B Zones. The
activities within those zones are generally complementary but the levels of amenity
anticipated in each zone varies, with generally decreasing amenity expected with
increasing distance from the Business A zone. Larger sized retail businesses are
anticipated in the Business C zone, but in central Ashburton it is expected that larger
format retail outlets will locate in the Business B zone. Commercial activities are
anticipated to include offices of all scales, and service activities will be encouraged to
locate in this zone to provide ease of access from central Ashburton. The existing
Ashburton Countdown is in this zone adjacent to the eastern end of the town centre
core, and the Tinwald Supervalue is also zoned Business C.
The Business D zone is anticipated to primarily accommodate light industrial, service
and commercial activities. To ensure the viability of the main commercial areas,
retailing activities are to be auxiliary to an industrial or service activity. This zoning
may introduce a higher level of amenity to some areas, in recognition of its location
adjacent to the River and residential areas. The proposed Rivercrossing Countdown
site is zoned Business D.
The Business E zone provides for medium to heavy industrial activities that may create
adverse environmental effects, and to other activities including offices, storage and
warehousing activities.
4Figure 2.1: Location of Proposed Development
The changes to the District Plan which have been made as part of the Plan review indicate a
reinforcing of the Plan’s centres-based ethos. The Rivercrossing site is not (under the Partly
Operative Plan) a location in which retail activity is anticipated or desired. This is likely to be a
key matter of concern for Council.
However, in our opinion the Rivercrossing site is an appropriate location for a supermarket
from a retail and economic point of view, being a similar distance away from the core Business
A zone as the two existing supermarkets (New World and Countdown), and on a main arterial
route. The absence of any ancillary retail from the proposed development limits the degree to
which the supermarket will create retail impacts on the town centre, and the location between
the town centre and the river limits the degree to which the supermarket might induce any
out of centre retail proliferation.
53 Demand and Supply Assessment
3.1 2013 Census
While 2013 Census data has started being released by Statistics NZ (SNZ), the data release
programme is ongoing and certain data that we will use for market assessments has not yet
been made available. Key among these data is estimates of household numbers and
population. While Census records the number of persons present in each location on Census
Night, and the number that are Usually Resident, both numbers tend to understate the true
counts due to Census non-response rates.
To take this into account we have used 2013 Census counts, and factored these up to reflect
both the expected magnitude of the Census undercount and a translation to a ‘as at June 30’
estimate, (whereas Census data is at March 5). To do this we applied the undercount observed
in the 2006 Census relative to the subsequently issued as at June 30 2006 estimates. Our
assessment indicates that to translate Census counts into June estimates, the Census counts
should be factored up by around 2.4% in Ashburton District (with some variation across the
District). Higher factors (closer to 4%) are required in the southern part of Selwyn, and slightly
lower factors (around 1.9%) are required in the northern part of Timaru.
These adjustments provide the base (June 2013) population and household counts, to which
we then apply the growth rates projected by SNZ in their most recent population and
household projection series. The result of this assessment is current estimates and projections
of population and household numbers that take into account the most recent available data
published by SNZ.
3.2 Household Projections
The Ashburton Urban Area (Ashburton town) is an established, slow growing market. In 2013
(the base year for this assessment) there were estimated to be 8,140 households in the town,
with a further 4,960 located elsewhere in the District, giving a total of 13,100 households in
Ashburton District, which is the town’s primary catchment (Figure 3.1).
This market size is somewhat larger than was estimated for the 2012 assessment, indicating
that the Census has revealed more significant growth than was expected over this period (by
about 4-5%). This greater than expected growth is apparent to a greater degree in Selwyn
District, and to a less degree in Timaru. One possible inference of this is that the Christchurch
earthquakes have stimulated population growth in the southern part of Canterbury, with
greatest effect in the areas closest to Christchurch.
The secondary catchment is a much smaller market, with 1,540 households in the northern
part of the catchment (in southern Selwyn District) and 3,110 in the southern part (northern
Timaru District). All of these secondary catchment households would be more likely to use
supermarkets in Rolleston or Timaru as their primary supermarket destination. In total then
6there are 17,750 households resident in the Main Trade Area (MTA) of the proposed
Countdown.
Figure 3.1: Main Trade Area Household Projections
Growth 2013-21 Growth 2013-31
2013 2016 2021 2026 2031
n Av Ann % n Av Ann %
Primary Catchment
Ashburton Urban Area 8,140 8,290 8,540 8,660 8,790 400 0.6% 650 0.4%
Ashburton Rural 4,960 5,180 5,560 5,880 6,260 600 1.4% 1,300 1.3%
Sub-total Primary Catchment 13,100 13,470 14,100 14,540 15,050 1,000 0.9% 1,950 0.8%
Secondary Catchment
Southern Selwyn District 1,540 1,600 1,740 1,870 2,010 200 1.5% 470 1.5%
Northern Timaru District 3,110 3,190 3,280 3,360 3,410 170 0.7% 300 0.5%
Sub-total Secondary Catchment 4,650 4,790 5,020 5,230 5,420 370 1.0% 770 0.9%
Total Main Trading Area 17,750 18,260 19,120 19,770 20,470 1,370 0.9% 2,720 0.8%
Notwithstanding this higher than expected recent growth, the best current estimate of future
growth remains SNZ’s population and household projections. Those projections anticipate
slow growth within Ashburton town over the next 20 years, with household growth rates of
0.8-0.9% over this time, and indicate that any recent higher than expected growth is unlikely
to continue into the future.
Those rates equate to an additional 1,000 primary catchment households by 2021, and a
further 950 in the following decade. Growth in Ashburton town households is expected to be
400 in the next decade, or 50 per year on average, slowing to growth of an additional 250
households between 2021 and 2031. Growth in rural Ashburton is projected to be much
stronger, averaging 1.3-1.4% per year out to 2031, or around 65 households per year. Beyond
2021 growth is expected to be greater in the rural parts of the catchment, with urban growth
slowing.
Growth in the secondary catchment is of less importance to Ashburton retailers given the
limited market share these consumers provide, however growth of around 1.0% per year (on
average) is projected to provide growth of 770 households to 2031. The northern part of this
secondary catchment (which is closer to Christchurch) is expected to experience both the
fastest growth and the greatest increase in absolute terms.
3.3 Ashburton Retail Demand Origin and Destination
To understand how Ashburton’s retail market functions, we have analysed BNZ Marketview
data (see Appendix 1 for detail). That data (for the 2010 calendar year) was sourced from BNZ
as a customised data request, and shows:
The origin (by Territorial Authority) of all spending that is directed to Ashburton
District retail and hospitality stores, that is, where shoppers in Ashburton stores live.
The destination (by Territorial Authority) of spend by Ashburton District residents,
that is, where Ashburton residents shop.
7Looked at from a supply-side perspective, the data shows that:
Ashburton stores make a very high proportion of their sales to Ashburton residents,
with 96% of food and liquor store sales made to locals, and 93% of comparison retail
to locals (Figure 3.2). This indicates that Ashburton stores do not attract many
shoppers from outside the District.
Selwyn and Timaru District residents each account for less than 2% of spend made in
Ashburton stores, with no other District making any notable contribution.
Figure 3.2: Origin of Sales in Ashburton Stores
Total Core
Food and Comparison
Territorial Authority Hospitality Retail/
Liquor Retail
Hospitality
Christchurch City 0% 0% 0% 0%
Selwyn District 2% 2% 4% 2%
Ashburton District 96% 93% 89% 94%
Timaru District 2% 4% 6% 3%
Mackenzie District 0% 0% 0% 0%
Waimate District 0% 0% 1% 0%
Waitaki District 0% 0% 1% 0%
Dunedin City 0% 0% 0% 0%
Total these Areas 100% 100% 100% 100%
From a demand-side perspective, Ashburton residents meet a very high proportion (92%) of
their food and liquor spend in businesses within the District, although much lower shares of
spend in other store types is directed to local merchants (Figure 3.3). In non-food retail stores,
Christchurch is a popular destination for spending by Ashburton residents, attracting 30% of
their spend. The Marketview data pre-dates the February 2011 earthquake, which is useful to
understand trends outside of the period during which retail demand patterns were likely to
have been affected by the earthquake and therefore atypical.
Figure 3.3: Destination of Ashburton Resident Spend
Total Core
Food and Comparison
Territorial Authority Hospitality Retail/
Liquor Retail
Hospitality
Christchurch City 6% 30% 20% 16%
Selwyn District 1% 0% 1% 1%
Ashburton District 92% 67% 74% 81%
Timaru District 1% 2% 3% 2%
Mackenzie District 0% 0% 1% 0%
Waimate District 0% 0% 0% 0%
Waitaki District 0% 0% 0% 0%
Dunedin City 0% 1% 2% 1%
Total these Areas 100% 100% 100% 100%
In summary, the Marketview data shows that Ashburton District is very self-sufficient in terms
of food and liquor retail sales. This self-sufficiency is consistent with the relatively large
8distance (more than 30 minutes travel) needed to access alternate supermarket supply and
the high frequency with which these food and liquor transactions are made. That is, Ashburton
residents shop locally for their food because that is what is most convenient, making them a
captive market. Ashburton is less self-sufficient in storetypes (comparison retail and
hospitality) which are less frequently visited and are not as well represented in Ashburton as
food and liquor stores. This poorer supply in non-food stores means that leakage in those
other stores is much higher (25-35%) than is the case for food and liquor stores (less than
10%).
This high level of self-sufficiency means that only a small proportion (8%, or $8.0m) of the
$100.4m supermarket demand resident within Ashburton District is not directed to Ashburton
stores (Figure 3.3 and Figure 3.4). This ‘leakage’ is very low for a supermarket catchment, and
there is always some leakage from catchments as residents shop away from home near work
or on holiday. This reinforces the insularity of the Ashburton supermarket marketplace.
Figure 3.4: Ashburton Consumers’ Supermarket Spend Destinations (2013, $m)
To ADC To non-ADC
Consumer Location Total Spend
stores stores
Ashburton Urban Area $ 57.7 $ 5.0 $ 62.8
Ashburton Rural $ 34.6 $ 3.0 $ 37.6
Ashburton District $ 92.3 $ 8.0 $ 100.4
Another way of looking at this insularity is assessing who sales by Ashburton supermarkets are
made to. An estimated $92.7m of the total $96.3m (96%) in sales made by Ashburton
supermarkets is made to Ashburton consumers, with very small amounts of spend coming into
the District from outside it (Figure 3.5).
Figure 3.5: Destination of Ashburton Resident Spend (2013, $m)
To ADC To non-ADC
Store Location Total Sales
households households
Ashburton Urban Area $ 89.0 $ 3.7 $ 92.7
Ashburton Rural $ 3.4 $ 0.1 $ 3.6
Ashburton District $ 92.4 $ 3.9 $ 96.3
3.4 Supermarket Demand Projections
In line with the household projections above, growth in demand for supermarket and grocery
stores from the primary catchment is projected to grow at a modest rate of around 1.9% per
annum out to 2021, including an allowance (of 1% per year) for assumed increases in real
spend per household (in line with recent trends).
9Figure 3.6: MTA Supermarket/Grocery Demand Projections ($m)
Growth 2013-21 Growth 2013-31
2013 2016 2021 2026 2031
n Av Ann % n Av Ann %
Primary Catchment
Ashburton Urban Area $ 75.7 $ 81.2 $ 87.9 $ 95.4 $ 103.6 $ 12.1 1.9% $ 27.8 1.8%
Ashburton Rural $ 45.4 $ 48.7 $ 52.7 $ 57.2 $ 62.1 $ 7.3 1.9% $ 16.7 1.8%
Sub-total Primary Catchment $ 121.1 $ 129.9 $ 140.5 $ 152.7 $ 165.7 $ 19.4 1.9% $ 44.5 1.8%
Secondary Catchment
Southern Selwyn District $ 17.6 $ 19.4 $ 21.9 $ 24.7 $ 27.8 $ 4.3 2.8% $ 10.2 2.6%
Northern Timaru District $ 32.8 $ 34.8 $ 37.4 $ 39.9 $ 42.5 $ 4.6 1.7% $ 9.7 1.4%
Sub-total Secondary Catchment $ 50.4 $ 54.2 $ 59.3 $ 64.6 $ 70.3 $ 8.9 2.1% $ 19.9 1.9%
Total Main Trading Area $ 171.5 $ 184.1 $ 199.9 $ 217.3 $ 236.0 $ 28.3 1.9% $ 64.4 1.8%
At this rate of growth the pool of demand in the primary catchment will grow from $121m in
2013 to $141m in 2021 and $167m in 2031, an average annual growth of $2.5m (Figure 3.6).
Demand from the secondary catchment will grow from a smaller base, but will grow slightly
faster, giving an increase of $20m in the same period, although only a small proportion of this
will be directed to supermarket and grocery stores in Ashburton.
In floorspace equivalent terms, demand from the primary catchment currently supports
around 9,300m2 GFA, which when added to the secondary catchment demand of 4,800m2
gives resident demand sufficient to support 14,100m2 (Figure 3.7). This is expected to grow by
around 3,900m2 to 2031.
Figure 3.7: MTA Supermarket/Grocery Demand Projections (GFA, m2)
Growth 2013-21 Growth 2013-31
2013 2016 2021 2026 2031
n Av Ann % n Av Ann %
Primary Catchment
Ashburton Urban Area 5,810 6,230 6,580 6,970 7,380 770 1.6% 1,570 1.3%
Ashburton Rural 3,480 3,730 3,940 4,170 4,420 460 1.6% 940 1.3%
Sub-total Primary Catchment 9,290 9,960 10,520 11,140 11,800 1,230 1.6% 2,510 1.3%
Secondary Catchment
Southern Selwyn District 1,680 1,870 2,050 2,270 2,490 370 2.5% 810 2.2%
Northern Timaru District 3,120 3,290 3,460 3,600 3,740 340 1.3% 620 1.0%
Sub-total Secondary Catchment 4,800 5,160 5,510 5,870 6,230 710 1.7% 1,430 1.5%
Total Main Trading Area 14,090 15,120 16,030 17,010 18,030 1,940 1.6% 3,940 1.4%
Not all of this demand will be supported in Ashburton, although in line with the assessment
presented in section 3.3, a very high proportion (around 92%) of the GFA supported by
Ashburton households will be supported in Ashburton District (and of that most will be
supported in Ashburton town). In contrast, the relatively ‘closed’ nature of the supermarket
and grocery environment in Ashburton means that a very small share of the total space
sustainable in the sector in Ashburton will be supported by secondary catchment households.
There will also be a proportion of space that will be supported by consumers not resident in
the MTA, as is the case with all supermarkets. In the case of Ashburton it is estimated that this
share will be around 10%, which is at the lower end of non-local spend nationally.
Taking into account where supermarket and grocery GFA is supported, total sustainable
supermarket floorspace in Ashburton District is currently around 10,330m2, of which 83%
(8,580m2) is supported by consumers in the primary catchment, 7% is supported by the
secondary catchment, and 10% by non-local consumers (Figure 3.8).
10Figure 3.8: Ashburton District Sustainable Supermarket/Grocery Space (GFA, m2)
Growth 2013-21 Growth 2013-31
2013 2016 2021 2026 2031
n Av Ann % n Av Ann %
Total GFA Demand
Primary Catchment 9,290 9,960 10,520 11,140 11,800 1,230 1.6% 2,510 1.3%
Secondary Catchment 4,800 5,160 5,510 5,870 6,230 710 1.7% 1,430 1.5%
Total MTA 14,090 15,120 16,030 17,010 18,030 1,940 1.6% 3,940 1.4%
GFA Supported in Ashburton District
Primary Catchment 8,580 9,200 9,710 10,290 10,900 1,130 1.6% 2,320 1.3%
Secondary Catchment 720 770 830 880 930 110 1.8% 210 1.4%
Total MTA 9,300 9,970 10,540 11,170 11,830 1,240 1.6% 2,530 1.3%
Non-local consumers 1,030 1,110 1,170 1,240 1,310
Total Sustainable GFA 10,330 11,080 11,710 12,410 13,140 1,380 1.6% 2,810 1.3%
3.5 Ashburton Supermarket Supply
There is currently just under 9,000m2 of supermarket and grocery store GFA in Ashburton
District, including 6,540m2 of supermarket space in Ashburton town and Tinwald, and an
estimated 1,960m2 of grocery store space spread throughout the town’s local centres and
other locations (Figure 3.9).
Figure 3.9: 2013 MTA Supermarket/Grocery Supply (GFA, m2)
Total Smkt
Grocery
Consumer Location Supermrkts and
Stores
Grocery
Primary Catchment
Countdown 3,270
New World 2,750
Super Value (Tinwald) 520
Sub-total Ashburton Town 6,540 1,400 7,940
Rest of Ashburton District 400 560 960
Total Primary Catchment 6,940 1,960 8,900
Secondary Catchment 1,230 310 1,540
Total MTA Supply 8,170 2,270 10,440
3.6 Ashburton Demand-Supply Balance
Given the total sustainable floorspace in Ashburton assessed above in section 3.4 (of
10,330m2), this indicates that there is currently sufficient demand in the MTA of Ashburton
for an additional 1,430m2 of supermarket and grocery store GFA , increasing to 2,800m2 by
2021, and 4,200m2 by 2031 (Figure 3.10).
Figure 3.10: Ashburton District Sustainable Supermarket/Grocery Supply (GFA, m 2)
Growth m2
2013 2016 2021 2026 2031
2013-21 2013-31
Total Sustainable GFA 10,330 11,080 11,710 12,410 13,140 1,380 2,810
Current Supply 8,900
Sustainable Additional GFA 1,430 2,180 2,810 3,510 4,240 1,380 2,810
11We note that the national provision of supermarket and grocery GFA per household is around
0.97m2, and provision in Ashburton District is 0.72m2. This indicates that if current provision
in Ashburton was at national levels, there would be an additional 2,500m2 of supermarket and
grocery GFA in the District now (0.27m2 per household). This indicates that our assessment of
additional sustainable GFA is conservatively low, which reflects both:
the area’s rural setting and number of small, space intensive grocery stores that play
a greater role in supplying supermarket and grocery needs than in larger urban areas,
and;
the absence of very large space extensive stores (i.e. Pak’n Saves) which serve to pull
the national average up.
124 Potential Impacts
We have not undertaken a quantitative impact assessment for this report, and the impact
assessment in this section is provided in qualitative terms to indicate the expected spread and
magnitude of impacts on supermarket sales and shopping centre patronage if the
Rivercrossing Countdown opens, and provide an early indication of any potential issues.
4.1 Supermarket Sales Impacts
The main effect of the new store on the existing environment (from a retail and economic
point of view) will arise through direct impacts on the sales made by existing supermarkets.
These direct impacts are trade competition impacts under the RMA, and are not relevant
effect in assessing the overall impacts of the proposed store. The direct impacts will be
assessed though, as they potentially give rise to indirect impacts on town centres, which are
relevant effects in RMA terms.
The proposed Countdown will do little to alter the travel and shopping patterns of residents
living in the store’s MTA, as it will be located very close to the existing supermarkets in
Ashburton, and a similar distance to the Inner Commercial (Business 1) zone as those existing
stores. This location, and the relatively ‘closed’ nature of the supermarket catchment, means
that customers who will patronise the Rivercrossing Countdown are currently likely to be
customers of Ashburton town’s three existing supermarkets (the Countdown, New World and
Tinwald Super Value). The large distance to the nearest alternative supermarkets (at Methven
(34km), Geraldine, Leeston and Temuka (50-60km), all of which are less than half the size of
the existing Ashburton New World and Countdown stores), means that there is unlikely to be
much transferral of custom from non-Ashburton supermarkets to the new store.
Although the Rivercrossing Countdown will be larger than Ashburton’s existing supermarkets
(28% more GFA than the Countdown and 53% more than the New World) the range and depth
of offer of the new store is not likely to be different enough to existing stores for it to
materially change the proportion of spend by Ashburton residents directed to other locations.
This means that the Rivercrossing store will not rely on recapturing leakage of local spend for
its sales, and that the main change caused by the new store will be a redistribution of which
supermarket in Ashburton its residents will shop at.
The proposed Countdown (at 4,200m2) would be a significant addition to Ashburton’s
supermarket supply relative to current supermarket and grocery space (9,020m2) in the
District. This unavoidably means that impacts on existing stores will be significant, but if
Ashburton is to grow from two supermarkets to three, a trade competition impact will
necessarily be created at some stage. The impact would be lessened if the new store were
smaller, however the commercial practicalities of supermarket provision constrain the sizing
options that will be attractive to supermarket operators. The key issue then becomes one of
timing, that is should any new store be opened now, or only when it can be fully supported by
the market (indicatively 2026-2031), or sometime in between these two extremes. In our
opinion the addition of new supply would need to lead growth to some extent to provide
13consumers with an attractive shopping experience, with a resulting trade-off that would see
the new store and the existing stores underperforming until market growth occurs.
Our understanding is that the existing Ashburton stores are currently performing well, and
although would suffer large trade competition impacts after the opening of the Rivercrossing
Countdown, these impacts would not be likely to result in closure of any existing supermarket.
This is true because:
The operator of the existing Countdown (Progressive Enterprises) has undertaken to
keep that store operating, having the opinion that the pool of local demand is
sufficient to support the proposed store in addition to existing supermarket supply.
The New World represents the only presence in the market of its brand, and therefore
would be unlikely to close given the importance of retaining some corporate
representation in the Ashburton market.
The Tinwald Super Value is a small supermarket that serves predominantly a local
(Tinwald) customer base, and would continue to offer a strong convenience role for
those customers even with the proposed Countdown.
Other stores outside Ashburton town are too far away, and too small, to represent
realistic alternative destinations for regular shopping trips by most Ashburton
residents.
This means that the Rivercrossing supermarket would result in a reallocation of the existing
pool of supermarket spending resident in the Main Trade Area, drawing sales away from
existing supermarkets but with existing stores remaining open.
4.2 Other Retail Impacts
Because there is no non-supermarket retail space proposed under the application, the impacts
of the Rivercrossing Countdown on non-supermarket stores in Ashburton is expected to be
very small. The type of products sold by the new store will be very similar to Ashburton’s
existing supermarkets, albeit with an expanded range and depth of offer relative to that
currently available in Ashburton.
This and the fact that these stores have already developed customer bases that prefer them
to the existing Countdown and New World supermarkets, means that there is unlikely to be
any major ‘shock’ to consumers’ purchasing patterns for non-supermarket retail goods.
Consequently we would anticipate that patrons of central Ashburton businesses will continue
to source their non-supermarket retail and service supply in much the same way as they
currently do, even if they choose to shop at a different supermarket. This is also likely because
each of the three supermarkets (two Countdowns and one New World) are located outside
the Business A zone and a similar distance from it, and so the addition of the Rivercrossing
store would do little to change trip chaining involving supermarket visits. This is true of both
stores that have some product range overlap with the Countdown (such as butchers, fruit
shops etc.) and those that do not have any significant overlap (clothing stores etc.).
144.3 Impacts on Centres
The relevant impact in RMA terms is the impact on centres, including how their patronage is
effected, and the flow-on effect on the vitality and vibrancy of those centres and the level of
amenity they offer. The main centre in the District is the Ashburton town centre, which as
discussed above is unlikely to experience more than minor impacts by virtue of the post-
Rivercrossing supermarket environment being similar to the pre-Rivercrossing situation. Other
centres (Tinwald, Rakaia, Allenton, Methven etc.) are also expected to experience only very
small changes in their vitality, because the addition of one new supermarket in close proximity
to the existing three in Ashburton town is unlikely to change how consumers access non-
supermarket goods.
For these reasons, which will be elaborated on in the Stage 2 impact assessment, none of the
centre impacts would be expected to be large enough to reach the significance threshold
established through case law, as presented by Russell McVeagh in their opinion for the 2011
Tawa application.
155 Matters of Interest to Council
This section provides a summary of the key issues we expect will be of interest to Ashburton
District Council during the application process, from a retail/economic point of view. These
matters will need to be addressed more fully if a consent application is to be lodged.
Issues key to the proposed development are contained in section 5 (Business Zones) of the
Partly Operative Ashburton District Plan. That section explains the importance of business
zones as locations of investment and employment and as areas which facilitate economic and
social well-being. Inappropriate location of business activities is identified as an issue because
it can result in a loss of vitality, convenience, accessibility and the identity of such areas, all of
which are important factors in supporting economic and social well-being.
Town centres are identified in the Plan as a source of identity and meeting place for their
communities, and retail is identified as an important contributor to shaping the form and
attractiveness of town centres. As part of this identification, the Plan notes that “it is not
considered efficient to provide for retail activities throughout the residential and rural areas
of the District and neither for such activities to be located in every business zone” (Section
5.2.1).
The Plan is concerned with balancing the need to be able to accommodate economic growth
and the need to avoid dispersal of economic activity, including retail into new locations. That
dispersal may leave vacant buildings in existing business areas, decreasing the attractiveness
of those areas and adversely affecting their vitality. Consolidation into existing business areas
will promote this vitality, with benefits for the community in terms of “the range of services
available, their convenience, pleasantness and accessibility”, and will also prevent the
outward spread of businesses into residential areas.
The concerns of the District Plan relating to retail are summed up well in Section 5.7.16:
The dispersal of general retail activity throughout the business areas may
result in adverse effects on the functioning, convenience, vitality,
pleasantness and viability of the inner commercial areas of the towns.
Fragmentation and dispersal of general retailing activities may result in
closure of shops in the inner commercial areas, a reduction in the range of
services available in these areas, a loss of vitality and attractiveness to
shoppers, and an undermining of their roles as principal areas for
comparison retailing, and as focal-points and sources of identity for their
communities.
Unlimited retail activity throughout the business areas may also result in
the dispersal of activity along the State Highways, with consequential
adverse effects on traffic safety and efficiency, traffic congestion and
vehicle/pedestrian conflicts. Furthermore existing public infrastructure in
the inner commercial areas, in the form of public car-parking and other
street developments, may become inefficiently used.
16The Plan identifies that it is important that the scale and type of building is sympathetic to the
zone it is in, and that new buildings do not significantly exceed existing heights of create large
blank walls with no visual appeal (Section 5.3.2). As such the fine-grained Business A zone is
not ideally suited to large format retail activities such as supermarkets, which are instead
preferred in the Business B or C zones. The Business D zone is anticipated to be a light industry
zone, with the only retail activity anticipated being that which is auxiliary to industrial or
service activities. The proposed supermarket would be a non-complying activity in the
Business D zone (Rules 5.8.2 i and 5.8.6 i).
In this context, it will be important that Progressive can show that the development of a
Countdown at East and South Streets:
Will not detract from the amenity or consolidation of the town centre core (the
Business A zone).
Is not ‘out of step’ with market growth. The key to this will be to show that the
supermarket will not bring on-line more supply than there is demand for, and
therefore will not create an inefficient use of space which might result in vacancies in
established shopping areas, triggering a downturn in people activity, vitality and
vibrancy.
Will not create direct sales impacts on other supermarkets that will lead to impacts
on centres that are significant in resource management terms.
In our opinion the proposed development will be able to be shown to ‘pass’ all of these tests,
and is appropriate from a retail/economic point of view. We would anticipate the need for
Progressive’s planning expert to address the non-compliance of the supermarket activity on
the proposed site.
176 Conclusions
Ashburton functions as a relatively closed retail environment, with a vast majority of sales by
Ashburton stores being made to Ashburton residents, and a vast majority of spend by
Ashburton residents being directed to Ashburton stores. This is a function of the large distance
to the nearest alternative points of retail supply, and means that the effects of any new retail
development in Ashburton town will largely be limited to occurring within Ashburton town.
The direct retail impacts created by the proposed Rivercrossing Countdown will therefore be
focussed on Ashburton’s existing supermarkets, all of which we would expect to continue
operating. The Countdown will continue operating pursuant to a stated intention by its
operator Progressive Enterprises, and the New World represents the only presence in the
market of its brand, and therefore would be unlikely to close given the importance of retaining
some corporate representation in the Ashburton market. The third supermarket in Ashburton
is the Tinwald Super Value, which being small serves predominantly a local customer base,
and would continue to offer a strong convenience role for those customers, and so would also
be likely to remain open.
The proposed Countdown is not expected to have significant impacts on non-supermarket
food retailers (such as butchers and fruit shops), as these stores have already developed
customer bases that prefer them to the existing Countdown and New World supermarkets.
The proposed Countdown is unlikely to significantly change the attractiveness of Ashburton’s
supermarket supply so as to induce any significant change in shopping patterns by the
customers of those speciality food retailers. In any case, any direct impacts on sales are purely
trade competition impacts, and are not relevant under the RMA.
Individuals who divert their spend from one of the town’s existing supermarkets to the new
store would be very unlikely to change the amount of spend or the number of visits they make
to non-supermarket businesses in the town centre. This is the case for two reasons. Firstly,
the nearest alternate retail destination of a comparable size is over an hour’s drive away, and
secondly the proposed Rivercrossing Countdown is a similar distance from the town centre
core (the Inner Commercial zone) as the existing Countdown and New World supermarkets.
This means that the indirect (flow-on) effects on the Ashburton town centre are likely to be
very small, and certainly well below the level of significance established in case law.
There is currently sufficient demand in the main trading area of the proposed Rivercrossing
Countdown of Ashburton for an additional 1,430m2 of supermarket and grocery store GFA,
increasing to 2,810m2 by 2021, and 4,240m2 by 2031. Although this short term sustainable
space is much less than is proposed for the Rivercrossing store (at 4,200m2), provision of new
supermarket space is by necessity ‘lumpy’, occurring through step changes in supply levels
required to service growing markets. The provision of new supermarket supply in Ashburton
will mean that the current under-supply of space is corrected, allowing a more pleasant
shopping environment for Ashburton residents.
In our opinion the proposed site on State Highway 1 (East Street) is a convenient location for
the population base to access efficiently, and the proximity of the site to the Inner Commercial
18area makes the site appropriate from an urban form point of view. Further, we do not
anticipate that the Rivercrossing Countdown will detract from the amenity or consolidation of
the town centre core (the Business A zone), and therefore is not inconsistent with the
objectives and policies in the Partly Operative District Plan, despite being a non-complying
activity under that Plan.
19Appendix 1: BNZ Marketview Data
This Appendix contains an overview of Marketview data, including how it is collected and
published.
BNZ’s Marketview data is credit and debit card data from all BNZ customers. Every transaction
from these cards is processed by BNZ, so the size and timing of every transaction, and the
location and type of merchant involved in the transaction is known by BNZ, and is collated and
available for purchase (in aggregate, to preserve confidentiality of both individual merchants
(i.e. sales and transaction data) and cardholders).
BNZ has about a 16-18% market share of credit and debit cards, and credit and debit cards
make up about 65% of all retail spend. Hence Marketview data covers about 12% of all retail
spending in NZ (market share varies geographically). Because of the very large sample size,
this 12% is a statistically very representative sample of all retail spending.
Data requested for this project was the place of residence of cardholders (whether household
or business cards) that used their cards in transactions at a merchant within Territorial
Authorities in mid- to south Canterbury. Data provided was the quantum of sales from each
TA to Ashburton merchants, and the TA location of spending by Ashburton residents. Note
that the data is not a compete national set, so percentages expressed relate only to the
geographic area assessed, and do not include leakage of spend to non-study area locations
(e.g. the upper South Island and North Island), and the origin of customers in Ashburton stores
does not include people from outside the study area.
20You can also read