Case study of Net Zero Energy Apartment in Shanghai
←
→
Page content transcription
If your browser does not render page correctly, please read the page content below
Purdue University
Purdue e-Pubs
International High Performance Buildings
                                                                                                    School of Mechanical Engineering
Conference

2012

Case study of Net Zero Energy Apartment in
Shanghai
Shuai Deng
deng32@purdue.edu

Wang Ruzhu

Dai Yanjun

Follow this and additional works at: http://docs.lib.purdue.edu/ihpbc

Deng, Shuai; Ruzhu, Wang; and Yanjun, Dai, "Case study of Net Zero Energy Apartment in Shanghai" (2012). International High
Performance Buildings Conference. Paper 94.
http://docs.lib.purdue.edu/ihpbc/94

This document has been made available through Purdue e-Pubs, a service of the Purdue University Libraries. Please contact epubs@purdue.edu for
additional information.
Complete proceedings may be acquired in print and on CD-ROM directly from the Ray W. Herrick Laboratories at https://engineering.purdue.edu/
Herrick/Events/orderlit.html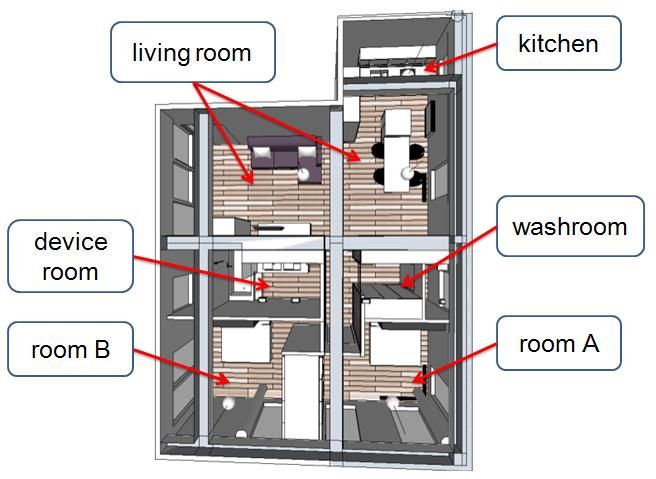
3588, Page 1

                              Case Study of Net Zero Energy Apartment

                                   Shuai DENG1, 2, Yanjun DAI1*, Ruzhu WANG1
                 1
                     Institute of Refrigeration and Cryogenics, Shanghai Jiao Tong University
                                              Shanghai, China, 200240
                                                 yjdai@sjtu.edu.cn
                       2
                           Herrick Laboratories, Mechanical Engineering, Purdue University,
                                            West Lafayette, Indiana, USA

                                                   ABSTRACT
A case study regarding an apartment of net zero energy (NZEA) in Shanghai is introduced in this article. The
passive design of energy efficient, solar collector system, HVAC&DHW system, indoor terminal units and
renewable energy power system of the building are introduced briefly, particularly the concept of the energy system.
Based on performance curves obtained from the experiment, a simulation model for the whole system is established
for the evaluation. The performance of NZEA was evaluated in terms of the indoor comfort, energy balance and life
cycle assessment.

                                              1. INTRODUCTION
Commercial and residential buildings use almost 40% of the primary energy in the United States (Crawley et al.,
2009) and Europe (Aste et al., 2011), and nearly 30% in China (Tsinghua University, 2008). A number of works are
being done worldwide to reach the high performance goals in the building section and reduced the dependence of
building section on the primary energy. Using an approaching goal of net zero energy building (NZEB), the related
energy and environment problems will be addressed in an aggressive and integration way. Regarding the definition
of a net zero energy building, USA department of energy (D.O.E) has present a comprehensive definition which
covers four kinds of high performance buildings and their boundaries and metrics (Crawley et al., 2009).
Furthermore, Satori et al (2012) discussed the criteria for definition of NZEB and REHVA Task Force (2011)
proposes a technical definition for nearly zero energy buildings required in the implementation of the Energy
performance of buildings directive recast. Hernandez and Kenny (2010) discussed the similarities and differences of
various related definitions, and defined a life cycle zero energy building (LC-ZEB). Kilkis (2007) introduced a new
metric for net zero carbon buildings (ZECB) and net zero exergy buildings (NZExB). The status and perspectives of
low energy and net zero buildings in German was reviewed (Voss et al., 2011). Two anther review articles about the
definition of zero energy buildings (ZEB) are present by Torcellini et al (2006) and Marzsel et al (2010). In addition
to definition, boundary and metric, some technologies which can be integrated with NZEB are discussed in
references (Aste et al., 2011, Satori et al., 2010, Kolokotsa et al., 2011, Kerr and Kosar, 2011), in the terms of
roadmap and demonstration towards net zero energy.
Regarding the NZEB cases, a literature search suggests that most of projects summarized in the introduction section
of former publication (Deng et al., 2010) are focused on a feasibility research or simulation evaluation. The case
which covers the integration design, the real operation and the performance evaluation of NEZB are rare. In this
article, a case study about a net zero energy apartment (NZEA) in Shanghai is present. The features of passive
design, building service system, renewable energy power system are introduced briefly. The experiment and
simulation of key components in the system, such as solar collector, hybrid CO 2 HP and photovoltaic panel, are not
introduced in this article owing to the space constraint, but can be found in the other publications of authors. Based
on the experiment and simulation, the performance of NZEA was evaluated in terms of indoor comfortable, primary
energy payback time and CO2 emissions equivalent savings.

                                         2. PROJECT DESCRIPTION

                 International High Performance Buildings Conference at Purdue, July 16-19, 2012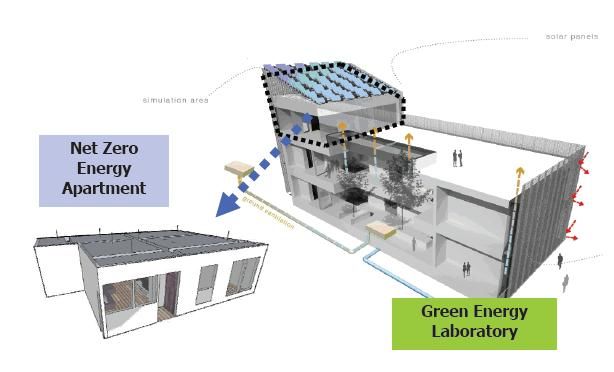
3588, Page 2
The research object is a 90 m2 apartment which is built on the third floor of a green building on the campus of
Shanghai Jiao Tong University, as shown in Figure 1(a). The apartment with the high performance envelopment is
used as a test and demonstration platform for building energy efficiency technologies. The inside structure of
apartment was designed and decorated according to the demand of a typical Chinese household, as illustrated in
Figure 1(b).

                                                  Figure 1: Architectural design: (a) NZEA (b) inside structure

2.1 Passive design
Figure 2 shows the mean values of ambient temperature, relatively humidity (RH) and daily solar radiation for
twelve months. The data are from two typical meteorological year (TMY) files of data source: Chinese Typical Year
Weather (CTYW) (Zhang and Huang, 2008) and International Weather for Energy Calculations (IWEC) (ASHRAE,
2001). The highest temperature in summer nearly reaches 30oC and the lowest in winter is around 5oC. The relativity
humidity (RH) keeps at a high level (above 65%) during the whole year and almost reaches 80% in summer. The
solar radiation results proved the utilization potential is good enough for DHW through the conventional solar
collector (SC). However, if the solar thermal is intended to drive an absorption chiller, the high performance solar
collector is necessary. In a summary, the feature of local weather conditions is "hot summer and cold winter".
According to these weather conditions and China code  (Ministry of Housing and Urban-Rural
Development, 2001), the thermal insulation performance of envelopment is designed. The result, which is stricter
than the request of the code, is listed in Table 1.

                            CTYW       IWEC
                   30
                   25                                                                          Summer
 Mean ambient
  temperature

                   20
     ( C)

                   15
      o

                   10
                    5
                    0                                                                 Winter

                   85
                   80
 Mean relatively

                   75
   humidity
     (%)

                   70
                   65
                   60                                                                                                          Indoor environment
                   25
                   20                                                                                   Module
 Daily solar

 ( MJ / m )
  radiation
          2

                   15
                   10
                    5
                    0
                        1    2     3   4      5     6      7   8   9   10   11   12
                                                   Monthly
                                                                                                                      Block         Appearance

                        Figure 2: Weather conditions of Shanghai                                    Figure 3: Facade of apartment

In addition to the design regarding the thermal insulation of envelopment, an outside facade for increasing the
shading coefficient of inside glass-curtain wall was also considered in the design. The final design employs "cotto"
facade, which has no movement components, and is recyclable material of clay. The rendering pictures of
appearance and visual effect of the inside environment are shown in Figure 3.
Based on the passive design, the building load is calculated through simulation. Two simulation software are applied:

                                 International High Performance Buildings Conference at Purdue, July 16-19, 2012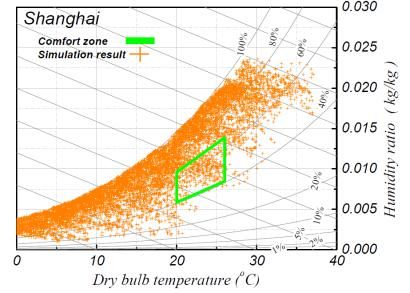
3588, Page 3
EnergyPlus and DeST. The calculation result is compared with baseline building performance, as shown in Figure 4.
The results show that the cooling and heating load of apartment are 10.1 kW and 8.3 kW, respectively. The annual
energy demand of apartment is 69.8(kWh/a) from EnergyPlus, and 78.5(kWh/a) from DeST. It should be noted here
that the load calculation is just for a comparison of passive design with the simplification model of an ideal energy
system.
Table 1: Passive design parameters of NZEA
NZEA Surface [m²] U value [W/(m²K)] G value [-]
Floor 93 0.30 -
Facade. S 45.9 0.31 -
Facade. N 45.9 0.31 -
Facade. E 32.6 0.31 -
Facade. W 32.6 0.31 -
Roof 93 0.21 -
Window. S 7.92 2.5 0.62
Window. N 10.32 2.5 0.62
Window. E 6.96 2.5 0.62
Window. W 0 - -
Other features two skins facade
2.2 Energy System
Solar Solar collector + Heating floor
tank (coil HX) + Radiator
DHW
Absorption
Air chiller Fan coil unit
HRV
CO2 HP
Electricity Appliance
Hybrid CO2 HP
Lighting
Figure 5: Design concept of energy system
Title:
Author:
Date: Sheet:
The energy system here means the entire building service system for the apartment, including solar collector system,
Revision:
HVAC&DHW system, indoor terminal units and renewable energy power system. Figure 5 shows the design
concept of energy system in this NZEA, concerning the relationship among sources, devices and end user. The solar
energy is applied as a main renewable energy source to supply cooling and heating and to electricity generation. The
devices contain a solar collector system and a hybrid CO2 heat pump which will be introduced in the following. The
main demands for end user are cooling, heating, DHW, appliance and lighting. One home energy management
system (HEMS) will be employed for the entire system, after the enough data are collected from the individual test,
experiment or debug of subsystems.
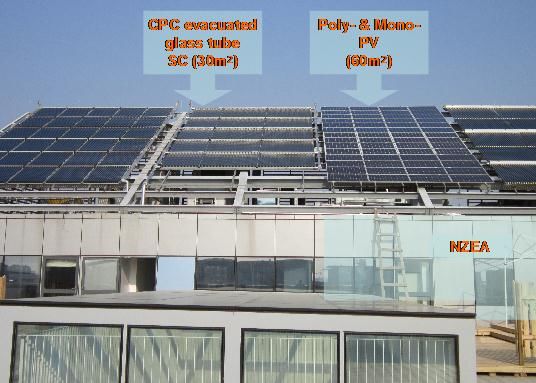
2.2.1 Solar collector (SC) system: The SC array is installed on the slope steel frame above the roof of apartment as
shown in Figure 6. The applied SC is a type of evacuated glass tube (EGT) collector with CPC reflector. Its
configuration is shown in Figure 7. In addition to the innovation in the selective absorption coating, the CPC
reflector is another main updating for the conventional EGT SC. It can obviously increase radiation absorption area
of SC without tracing system, so that a higher efficiency can be achieved. The performance comparison with a black
hose and a flat plate SC is also shown in this figure. It can be seen that the efficiency of EGT collector is obviously
higher than that of flat plate type when the application aim is a production of high temperature water (34.5 oC plot
line). And for solar-thermal-driven air-conditioning (65.5oC plot line), the CPC EGT collector can act as a
reasonable thermal source for cooling in summer and heating in winter, with less electricity consumption.
International High Performance Buildings Conference at Purdue, July 16-19, 2012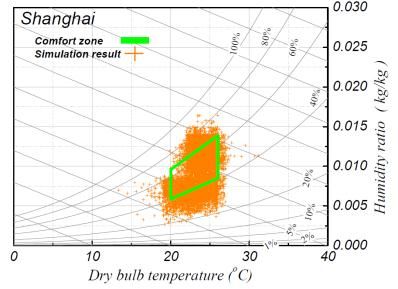
3588, Page 4

2.2.2 HVAC&DHW system: An 8kW air-cooled hybrid carbon dioxide (CO2) heat pump (HP) which uses the solar
thermal energy to assist a electricity-driven vapor compression (VC) air conditioning is developed. The main
components of this device are a small solar thermal-driven Libr absorption chiller and a CO2 HP. The assisted
cooling is mainly used for the further cooling of CO2, when CO2 leaves the air-cooled gas cooler. This technology
solution can dramatically decrease the outlet temperature of CO2 which leaves the gas cooler by heat exchange with
the chilled water of high temperature (15-18oC) from the absorption chiller. In this case, the proper extra-cooling
capacity can be created and a higher COP can be achieved. It also means that electricity consumption of the entire
device can be reduced by the solar energy input. In summer, the solar thermal energy is collected by solar water
collectors. The thermal energy is then transferred from a storage tank (500L) to the loops of HP and DHW. The
Hybrid CO2 HP supplies chilled water to the fan coil unit. In winter, the solar thermal energy can be directly
supplied to the radiation floor (70m2) or radiator. If water temperature of collector tank is not high enough, the CO2
heat pump is operated as a backup.

 Figure 6: Photo of solar collector array and PV             Figure7: Performance comparison of solar collector

  Figure 8: HVAC&DHW system: (a) layout of pipe system (Simplified version in cooling mode); (b) Hybrid HP
                                                  unit

2.2.3 Indoor terminal unit: One 127W heat recovery ventilator (HRV) is used for recovering the both latent and
sensible heat from the exhaust air. In addition, 70 m2 heating radiant floor was installed for a comparison test with
innovation fan coil units and radiators. There are various types of terminal units tested in the demonstration
apartment. Some typical types are shown in Figure 9. In order to obtain an even distribution and quick response of
heat release, boost fans and control system are added into a conventional design of radiators to form a new design.
The infrared pictures of Figure 9 show a compare result after the operation starts 270 seconds between a
conventional steel radiator and this innovation design. The temperature of the conventional radiator continues to rise
at the flow end and across the head; however the part of return flow is still cold. There exists obvious uneven
temperature distribution and overheating. The surrounding environment can not be warmed up quickly from the
startup of system. On the contrary, the effect of radiative is improved in the case of innovation radiator, in terms of
temperature distribution, response speed and interaction with environment. This design is well suit for the typical
life style of Chinese households who are custom to shut down the HVAC system during the unoccupied time.

                 International High Performance Buildings Conference at Purdue, July 16-19, 2012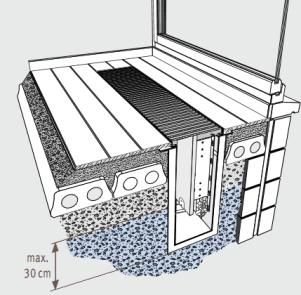
3588, Page 5
Furthermore, the innovation radiator also has some advantage in water-saving and material saving, as listed in Table
2.

2.2.4 Renewable energy power system: Renewable energy power system, which is installed for the entire building,
consists of two photovoltaic (PV) arrays (60m2, see Figure 6), a 5kW wind power system, inverters, controllers and
meters for export and import. The outputs of polycrystalline and monocrystalline arrays are 2.88kW and 3.84kW,
respectively. Table 3 shows the main parameters of polycrystalline PV and wind turbine. When the electricity
generation from renewable energy power system is not enough for consumption, the grid will output the power to
the office zone and demonstration apartment in the building. Thus, the apartment can benefit from a reliable power
supply by using this off-grid power generating system. Figure 10 presents a schematic diagram of the power system.
The whole power system is used to check whether the energy consumption of the entire building service system can
be offset by the renewable energy generation. It should be noted that the wind turbine system is used as a backup
power system, not only for demonstration apartment, but also for the other zones in the laboratory building. Thus, its
electricity generation is only used as one comparison case in simulation and it not contained in the final evaluation
of affordable NZEA.

                   Under floor fan coil unit                                       Radiator with boost fan

           Infrared pictures of conventional radiator           Infrared pictures of innovation radiator
                                     Figure 9: Photos of indoor terminal units

                             Table 2: Parameter comparison among different radiators.
               Item               Cast iron radiator      Traditional radiator        Low-H2O radiator
         Water content (L)                 25                       7                        1
          Weight (kg)                     105                      37                        4
            Material                      Steel                   Steel               Copper/aluminum
          Warm-up rate                 Very slow                  Slow                      Fast

                                                                                 Power meter
                                                                 Inverter
                                                                                       1   2   3

                                  PV module      Controller                            4

                                                                                       7
                                                                                           5

                                                                                           8
                                                                                               6

                                                                                               9

                                                                                           0

                                  Wind turbine   Controller     Inverter

                                                                     1   2   3

                                                                     4   5   6

                                                                     7   8

                                                                         0
                                                                             9
                                                                                           Grid

                                       GEL apartment          Power meter

                           Figure 10: Design concept of renewable energy power system

                 International High Performance Buildings Conference at Purdue, July 16-19, 2012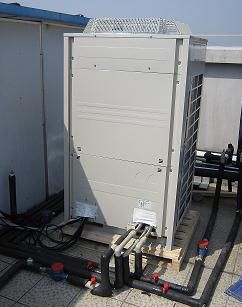
3588, Page 6

                                              3. EVALUATION
In order to evaluate the performance of apartment, the indoor comfort level was firstly analysis based on the
simulation results. Further, the primary energy payback time is calculated for the apartment, because it can be
considered as a “net zero energy” evaluation for the whole building life cycle. Based on this comprehensive
evaluation, the CO2 equivalent saving can be also obtained.
Regarding the methodology of evaluation, Figure 11 is a data flow diagram to show the scope and object used in the
evaluation as well as tools and indexes. The whole life cycle of NZEA can be divided into 4 processes, including:
preparation (manufacture and transport), construction, maintenance and demolition. The primary energy needed
during the whole life time includes: embodied energy, operation energy and recycling energy. Regarding the
research method, design, experiment, simulation and evaluation are the main approaches. The design results are
validated by the devices simulation, and performance of device unit can be predicted. The erection can realize the
design idea. After that, performance parameters and curves of components in the entire system can be obtained
through various steady state experiments. The performance information is then input into a system simulation
module so that the system performance of a hourly dynamic operation can be recorded for evaluation. The
evaluation indexes in this article are the indoor comfort, energy balance for net zero energy and impact of energy
and environment during the life cycle.

                                      Figure 11: Flow diagram of evaluation

3.1 Indoor Comfort Evaluation

The result regarding the apartment indoor comfort from the system simulation is the first evaluation index. And it
can also be considered as the base of evaluation, because the energy-saving would lose its rationality if an accepted
indoor comfortable level cannot be achieved. Figure 12 shows psychrometric diagrams of the simulated
temperatures and humidity for the indoor environment of NZEA and ambient environment as well as a defined
comfort zone (20-26°C and 40-65% relative humidity). There are result points for 8760 hours in every figure based
on a whole year hourly simulation. One parameter, namely comfortable zone fraction (CZF), which denotes how
many result points are inside the comfortable zone are defined and calculated. By CZF, the influence from HVAC
system on the comfortable level of indoor environment can be evaluated. Similarly, an index, namely, comfortable
temperature fraction (CTF), is defined to show how many points are inside the comfortable temperature range (20-
26°C). The simulation results for these two parameters are both shown in Table 4. The CZF reaches 45.83% and
CTF reaches 92.67%.

    Figure 12: Temperature and humidity ratio distribution for 8760 hours: (a) Indoor environment; (b) Outdoor
                                                   environment

                 International High Performance Buildings Conference at Purdue, July 16-19, 2012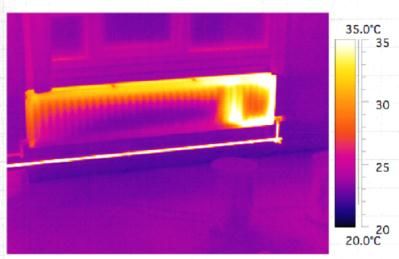
3588, Page 7

3.2 Net Zero Energy Analysis

The result for couple operation simulation between system and building is shown in Table 4 as well as one reference
case installed in Madrid (Deng et al., 2010). The total electricity consumption for the typical Chinese life style is
84.22 kWh/(m2a). The HVAC and DHW system, including HP, pumps and terminal units, takes 59.39% of total
electricity consumption, as Figure 13 shown. In GEL, the backup heat source is HP, not the assisted electricity
heater. Thus, the electricity consumption for this part is smaller than that of NZEB in reference (Deng et al., 2010).
The percentage of electricity consumption in control system is round 8%. The other parts take approximately one
third of the total consumption. In summary, total electricity consumption for the Chinese life style is 7832kWh for
one year. Besides, 2.88kW PV, 3.84kW PV and 5kW wind turbine are used as three schemes of renewable energy
power supplies, according to the real experiment system. Based on the simulation, 2.88kW polycrystalline PV can
output 3767kWh per year. In addition, the electricity generations of 3.84kW PV and 5kW wind turbine are
5072kWh and 4681kWh per year in Shanghai, respectively. Thus, three cases regarding the renewable energy
supply are proposed to offset the energy consumption of maintenance (or called operation), as shown in Figure 13.
The energy solution of first case is a combination of two PV arrays (6.72kW). The total electricity generation is
8839kWh per year. The annual electricity consumption can be offset by the generation of this solution and surplus
1007kWh electricity generation can be available to shorten the recovery time of investment.

                                        Table 4: Simulation result of system
                              Item                           GEL                  Reference case
             Consumption
             HP                                             25.05                       13.5
             SC pump                                          7.8
             Tank pump                                       4.06                       7.7
             Supply pump                                     8.42
             Fan coil units                                  0.65                        0.6
                                                             4.04                       3.20
             DHW
                                                        (Assisted HP)       (Assisted electricity heater)
             Control box                                     6.72                       23.5
             Appliance                                      11.13
                                                                                        23.5
             Light                                          16.35
             Inverter                                        --﹡                          2
             Total                                          84.22                        74
             Generation
             PV (2.88 kWp)                                   40.50
                                                                                203.80(12.5 kWp)
             PV (3.84 kWp)                                   54.54
             Wind (5 kWp, backup)                            50.34                       --
             Indoor comfort
             Comfortable temperature fraction (%)           92.67%                    99.37%
             Comfortable zone fraction (%)                  45.83%                    46.76%
* The electricity consumption of inverter is not shown in the table, because the power generation shown is already
  the final generation after inverter.

                 International High Performance Buildings Conference at Purdue, July 16-19, 2012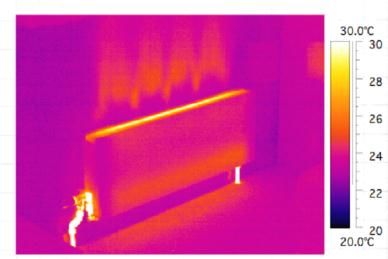
3588, Page 8

                                       Figure 13: Balance between consumption and generation, distribution of energy consumption

3.3 Life Cycle Assessment

Objects of the assessment is limited into the apartment and system during the whole life when is from the
construction, operation to the end of apartment life. The total fossil primary energy necessary for materials and
system has been calculated and estimated to 868GJ through inventory analysis. At the end of life, those materials
can be either recycled, or incinerated (thermally used), or put in landfills. The effective total primary energy needed
for the apartment material is then 676GJ. The total embodied energy over the life cycle, as well as the recycling
potential, is illustrated in Figure 14. The total energy needed for operation and energy generation from renewable
power system has been shown in Figure 13.
Figure 15 shows breakdown of the primary energy demand for construction materials. The “other parts” in this
figure, which contains seal, mineral wool, gluten, polyolefin film, etc., takes 27.9% for total primary energy.
Insulation glass takes the second highest percentage, because the window-wall ratio of the south facade is around
70.0%. The steel part accounts for 15.1%, because all the building body is a steel frame type.
.

                             1400
                                                         Thermal recycling     Materal recycling              2.46% 2.28%   5.15%               Construction wood
.

                             1200                        Apartment             Landfill                                             1.61%       Concrete
                                                         Systems Engineering                           15.09%
Total Primary Energy [GJ]

                             1000                                                                                                               Inside decoration
                             800                                                                                                                Aluminium
                                                                                                                                                Foamed insulation
                             600
                                                                                                     19.94%                                     Insulation glass
                             400                                                                                                       27.87%   Steel
                                                                                                                                                Solid structural timber
                             200
                                                                                                                                                Water proof film, etc
                                0                                                                                                               Others
                                                                                                          13.47%               11.95%
                                    Construction stage     Disposal stage           Net demand
                            Figure 14: Embodied and recycling energy                               Figure 15: Breakdown of primary energy demand for materials

Based on this calculation result for construction and the simulated energy demand during operation, the primary
energy payback time (NPE) can be calculated. Primary energy factors (PEF) for the conversion from electricity to
fossil primary energy are needed for this calculation. The conversion factors of GEMIS (a life-cycle assessment
program and database for energy, material, and transport systems) have been used to consider the electricity mix
generation of China (GEMIS, 2010). The calculation equation can be seen in Equation (1). It can be found that NPE
is highly depended on the installed capacity of renewable energy, when the primary energy demands of construction
and maintain are fixed as well as convention factor. With the increase of PV capacity, the NPE decrease, as table 4
shown. If the PV capacity can be increased to 10kW, the payback time can be limited below 10 years. Once the
primary energy needed has been recovered, the CO2 equivalent emissions savings during the rest of the lifetime can
be estimated, as Equation (2) shown. The conversion factor of GEMIS for China electricity mix is used and the

                                               International High Performance Buildings Conference at Purdue, July 16-19, 2012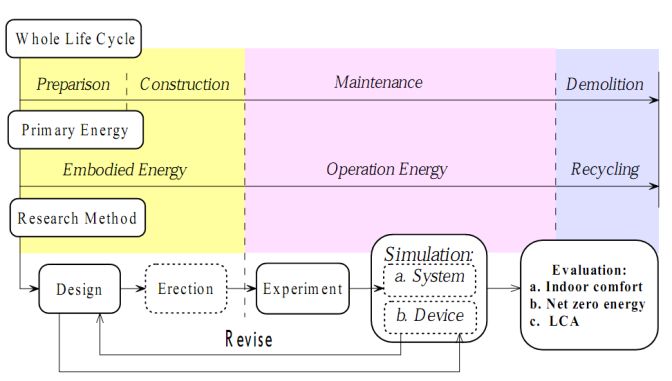
3588, Page 9
value is 0.813kg/kWhel. One other conversion factor from one China research result (Wang and Feng, 2006) is also
used as a reference and the value is 0.921 kg/kWhel. The lifetime of apartment is assumed as 50 years. The results
show that CO2 equivalent savings are 173.05T and 196.04T (SI: T, or ton), respectively, for GEMIS and MOST
conversion factors.
Qconstruction
N PE
(Qrenewable Qma int ain ) PEF (1)
M total FCO2 (Qrenewable Qma int ain ) ( N LT N PE )
(2)
Table 5: CO2 emissions equivalent savings for NZEA in 50 years of building life
NPE CO2eq emissions saving (T or ton)
Item
(Year) GEMIS MOST
7 (kW) 39 12.30 13.93
8 (kW) 20 65.62 74.34
Proposal PV capacity
9 (kW) 13 120.50 136.51
10 (kW) 10 173.05 196.04
4. SUMMARY
In this article, a case study regarding NZEA is introduced in terms of design and evaluation. Based on the
performance data of experiments, the numeral model was built and system simulation can be carried out to obtain
the electricity consumption and indoor comfortable parameters for the whole year. And these results can be used for
the evaluation of NZEA, analysis regarding the indoor comfort, energy balance and environment impact was
performed as well as a life cycle assessment.
With respect to the design of NZEA, solar energy is an important consideration for renewable energy input in this
case. The first integration solution is the optimal absorption of solar radiation through the building elevation or the
second skin facade. The fixed facade without movable elements is preferred because of no-energy-driven and low
cost, but a deep design regarding the optic optimization, thermal ventilation between facade and elevation is
necessary. The second integration solution is the solar thermal driven cooling and heating system, including solar
air-conditioning, domestic hot water system, and combined heating supply system. Because of the intermittent
supply and high cost, the independent solar HVAC and DHW system still keep at a demonstration stage, even
though all the products are all available in market. The third solution is the PV array that is widely used in the
existed NZEB projects. Due to limited surface area of building body and pollution of production process, existed
silicon-based PV technology limited further development of NZEB and meets a challenge of technology update.
NOMENCLATURE
CPC compound parabolic collector (‒) Subscripts
DHW domestic hot water (‒) el electricity
EGT evacuated glass tube (‒) eq equivalent
F conversion factor (‒) LT life time
M CO2eq emissions saving (T/ton) PE primary energy
N number of year (year)
Q primary energy (GJ)
PEF primary energy factors (‒)
SC solar collector (‒)
REFERENCES
ASHRAE, 2001, International Weather for Energy Calculations (IWEC Weather Files) Users Manual, ASHRAE,
Atlanta.
International High Performance Buildings Conference at Purdue, July 16-19, 20123588, Page 10
Aste, N., Adhikari, R.S., Del Pero, C., 2011, Photovoltaic technology for renewable electricity production: Towards
net zero energy buildings, In: Int. Conf. Clean. Electri. Power. (ICCEP), Ischia.
Building effiecncy research centre, Tsinghua University, 2008, 2008 annual report on China building energy
efficiency, China Architecture and Building Press, Beijing. (in Chinese).
Crawley, D., Pless, S., Torcellini, P., 2009, Getting to Net Zero, ASHRAE. J, vol. 51, no. 9: p. 18-25.
Deng, S., Dalibard, A., Martin, M., Dai, Y.J., Eicker, U., Wang, R.Z., Jan. C., 2010, Energy supply concepts for zero
energy residential buildings in humid and hot/dry climates. In: 9th. Int. Conf. Sustain. Eng Tech., Shanghai.
GEMIS, 2010, Global Emission Model for Integrated Systems, Version 5.5, www.gemis.de/en/index.htm. (access:
20120121).
Hernandez, P., Kenny, P., 2010, From net energy to zero energy buildings: Defining life cycle zero energy buildings
(LC-ZEB).Energ. Buildings., vol. 42, no. 6: 815-821.
Jaga, 2008, Energy savers, www.jaga.be/Default.aspx (access: 20120121)
Kerr, R., Kosar, D., 2011, Gas use roadmap to zero energy homes. ASHRAE. T, vol. 117, no.1: 340-347.
Kilkis, S., 2007, A new metric for net-zero carbon buildings. In: Proc. Eng. Sustain. Conf., California.
Kolokotsa, D., Rovas, D., Kosmatopoulos, E., Kalaitzakis, E., 2011, A roadmap towards intelligent net zero- and
positive-energy buildings. Sol Energy, vol. 85, no. 12: 3067-3084.
Kurnitski, J. et al, 2011, How to define nearly net zero energy buildings nZEB. REHVA. Euro. HVAC. J., vol. 3,
www.rehva.eu/en/374.how-to-define-nearly-net-zero-energy-buildings-nzeb (access: 2012.0127).
Marszal, A.J., Hesiselberg, P., Bourrelle, J.S., Musall, E., Voss, K., Sartori, I., Napolitano, A., 2010, Zero Energy
Building – A review of definitions and calculation methodologies. Energ. Buildings.,
DOI:10.1016/j.enbuild.2010.12.022.
Linuo Ritter USA, 2011, Collector performance. www.linuo-ritter-usa.com/faq/ (access: 20111001).
Ministry of Housing and Urban-Rural Development of the People’s Republic of China, 2001, Design standard for
energy efficiency of residential buildings in hot summer and cold winter zone (JGJ 134-2001), China
Architecture & Building Press, Beijing. (in Chinese).
Satori, I., Napolitano, A., Marszal, A., Pless, S., Torcellini, P., Voss, K. 2011, Criteria for Definition of Net Zero
Energy Buildings. www.iea-shc.org/publications/task.aspx?Task=40 (access: 20120128).
Torcellini, P., Pless, S., Deru, M., 2006, Zero Energy Buildings: A Critical Look at the Definition (Preprint version),
In: ACEEE. Summe.r Study. Pacific. Grove., California.
Voss, K., Musall, E., Lichtmeß, M., 2011, From Low-Energy to Net Zero-Energy Buildings Status and Perspectives,
J. Green. Buidlings., vol. 6, no. 1: 46-57.
Wang, G., Feng, X., 2006, CO2 emission reduction through energy integration, In: Chem. Ind Eng Prog., Beijing,
China. (in Chinese).
Zhang, Q.Y., Huang. J, 2008, Chinese Typical Year Weather Data for Architectural Use, China Machine Press,
Beijing. (in Chinese).
ACKNOWLEDGEMENT
The authors appreciate the support from the research project CREATIV, financially supported by the Research
Council of Norway (p.no.195182/S60). The first author also appreciated the financially support from the 2011-2012
PHD student visiting study program of Shanghai Jiao Tong university.
International High Performance Buildings Conference at Purdue, July 16-19, 2012You can also read