APPLYING ATHLETES UNLIMITED
  SOFTBALL SCORING TO MLB
 BASEBALL: TEAM PARITY AND
  INDIVIDUAL PERFORMANCE
←
→
Page content transcription
If your browser does not render page correctly, please read the page content below
APPLYING ATHLETES UNLIMITED SOFTBALL SCORING TO MLB BASEBALL: TEAM PARITY AND INDIVIDUAL PERFORMANCE
Applying Athletes Unlimited Softball Scoring
    to MLB Baseball: Team Parity and
         Individual Performance
                      Authors: Soham Mahabaleshwarkar, Philip Maymin

               Abstract: Athletes Unlimited developed an alternative scoring
               system for the sport of softball, designed to produce greater team
               parity and to highlight individual performance on a more granular
               level. The system was analyzed and tested on Major League
               Baseball data from the 2019 season to determine whether individual
               performance evaluation and team parity changed when the new
               scoring system was applied to a similarly scored sport.

Introduction
This paper investigates the parity and evaluation implications in the innovative scoring system to
be employed by the Athletes Unlimited (AU) professional softball league.

Traditional scoring systems run on a strict win/loss system. By contrast, the AU team scoring
system allocates points to the winner of each inning as well as to the winner of the game overall.
In addition, the AU individual scoring system allocates points to individual players based on
offensive plays and their degree of impact on the game. By creating a scoring system that rewards
individual contributions as well as team accomplishments, overall evaluation should improve.
Here, we test that hypothesis.

While some historical data exists for United States professional softball, the consistency of both
team and individual performance ranges widely and does not paint an accurate picture of closely-
matched competition. Major League Baseball, on the other hand, has a long, complete, and stable
historical database and provides an excellent testbed to evaluate the efficacy of the new AU scoring
system. Using MLB data from the 2019 season, we applied the AU scoring system to answer the
following questions:

   1. What impact does this scoring system have on team parity?
   2. What impact does this scoring system have on individual rankings?

Athletes Unlimited Softball
In brief, the AU scoring system attempts to measure athletic performance at both the team and the
individual level in an intuitive manner for both athletes and fans to understand. These points
determine cumulative league standings each week, with the top 4 players serving as team captains
and conducting draft picks. These aspects of the system are beyond the scope of this paper; for a

Athletes Unlimited, LLC | www.AUProSports.com | @AUProSports                                      2
more thorough description of the AU scoring system, please see the theoretical white paper on
team parity.
Individual athletes earn Win Points, MVP Points, and Individual Points. For the purposes of this
paper, we consider only Win Points and Individual Points.
Win Points: Athletes earn 50 points for each victory and an additional 10 points for every non-
overtime inning they win.
Individual Points:
1) +10 points for walks (including BB, IBB, or HBP)
2) +10 points for sacrifice hits (bunts) or sacrifice flies
3) +10 points for each stolen base (-10 points if caught stealing)
4) +10 points for singles
5) +20 points for doubles
6) +30 points for triples
7) +40 points for home runs
8) Pitchers:
a. +4 points for each out recorded
b. -10 points for each earned run allowed
The AU scoring system does not award points on the basis of defense due to a lack of clear and
simple defensive metrics (apart from tracking errors), and to avoid encouraging more conservative
play in order to avoid mistakes. In addition, errors are inherently dependent on the opportunity to
make plays. Players who have more frequent opportunities to make defensive plays based on the
likelihood of receiving the ball during a play will usually have a higher error count. This would
penalize players in certain defensive positions, such as infielders, if the scoring system simply
counted errors.
The rules of play largely follow regulations set forth by the NCAA and WBSC, with games taking
place over 7 innings.
Team Parity Methodology
In order to understand the scoring system’s effect on team parity, we took five different sample
sizes of the MLB season from the middle of the season, to account for specific behaviors that tend
to occur at the beginning or end of the season that could potentially skew the results of our analysis
(i.e. warm-up period for players at the beginning of the season; injuries and benching as the
postseason nears). To more accurately reflect AU’s 4-team, 15-game structure, we analyzed data
in samples of 4 teams based on divisions and general placement in the league rankings. For this
paper, we examined the four middle teams in the league during the MLB’s 2019 season: the
Arizona Diamondbacks, the Chicago Cubs, the Boston Red Sox, and the New York Mets (which
ranked between 12 and 15 in the league during the season overall); as well as the top four teams
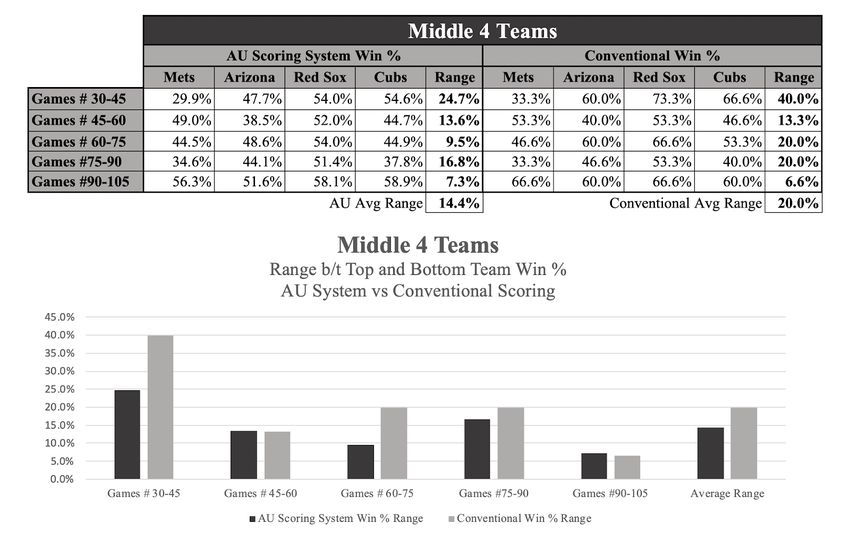
Athletes Unlimited, LLC | www.AUProSports.com | @AUProSports 3in the league for the 2019 season: the Houston Astros, the Minnesota Twins, the Los Angeles Dodgers, and the New York Yankees. For this analysis, we took the entire nine innings of MLB games and proportionally raised the AU Scoring System team points won per game. All extra innings were counted and considered in the scoring model as well and proportionally weighted according to the AU Scoring System. The measure of team parity we employed was a basic range of the highest and lowest team win percentage over each 15-game sample size. We also analyzed the potential change in league standings from the actual MLB system to the new AU scoring system. Middle Four Teams Analysis We first performed an analysis on the middle-performing teams of the 2019 MLB season based on the assumption that these teams represented the average level of athletic performance in the league. Teams in the middle of the pack may experience a wider range of competitive ability, thus generating larger gaps in win percentage. If the AU scoring system can improve parity between teams that are not as closely matched, it suggests the efficacy of the model as the foundation for a level playing field. To identify the win percentage range while observing the MLB conventional scoring system, we set the upper and lower bounds by the highest and lowest performing teams in this sample group, which were the Boston Red Sox (#12) and the New York Mets (#15). When measuring this sample group while observing the AU Scoring Methodology, we found a much smaller range/area between the two curves in this AU Methodology case as compared to the MLB Win %. Table 1: Win Percentage for Middle Four Teams, AU vs. MLB Comparison Athletes Unlimited, LLC | www.AUProSports.com | @AUProSports 4
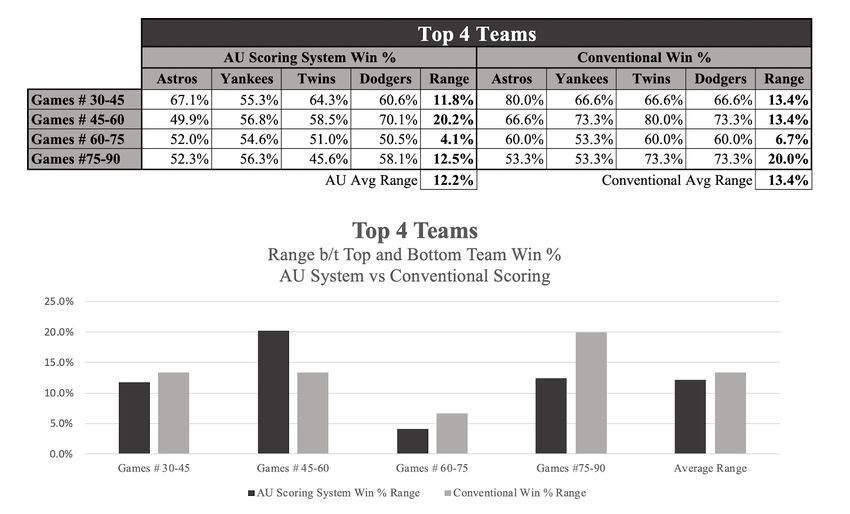
Figure 1: Win Percentage Range for Middle Four Teams, AU vs. MLB Comparison

Conventional MLB:                                    AU Scoring:
Average: 19.98%                                      Average: 14.34%
Standard Deviation: 11.175                           Standard Deviation: 6.27
Confidence Interval: 7.53 - 14.81                    Confidence Interval: 3.11 - 9.38

On average, the AU scoring system has a significantly lower average range difference and standard
deviation than the MLB scoring system. A closer range and smaller standard deviation imply closer
matches, more equal teams and greater team-wise parity in the league.

Top Four Teams Analysis
After observing improved parity in the middle of the MLB pack, we next performed a similar
analysis on the top MLB teams of the 2019 season to see if the AU scoring system could also make
a measurable impact on these statistically high achievers. Teams at the top of the league standings
tend to experience smaller gaps in win percentages, since consistency in team performance is a
key factor in rising to the top. If the AU scoring system can improve or maintain parity at this
level, it will suggest that the model remains fair for teams at any standing.

To identify the win percentage range while observing the MLB conventional scoring system, we
set the upper and lower bounds by the highest and lowest performing teams in this sample group,
which were the Los Angeles Dodgers (#2) and the Minnesota Twins (#4). When measuring this
sample group while observing the AU Scoring Methodology, we once again found a much smaller
range/area between the two curves in this AU Methodology case as compared to the MLB Win
percentage.

Athletes Unlimited, LLC | www.AUProSports.com | @AUProSports                                     5
Table 2: Win Percentage for Top Four Teams, AU vs. MLB Comparison

Figure 2: Win Percentage Range for Top Four Teams, AU vs. MLB Comparison

Conventional MLB:                                   AU Scoring:
Average: 13.4%                                      Average: 12.15%
Standard Deviation: 4.7                             Standard Deviation: 5.70
Confidence Interval: 1.76 - 7.64                    Confidence Interval: 2.62 - 8.78

The AU scoring system has a similar average range difference and standard deviation to the MLB
conventional scoring system. The MLB 2019 season had four exceptionally close matched teams
at the top, and the existing system was exceptionally good at maintaining parity at this level.

The analysis performed here demonstrates that the AU scoring system improves on the
conventional MLB model by improving on parity in the middle of the league, bringing the whole
league closer together competitively speaking. In a league model where athletes are routinely
drafted onto different teams, improved team parity across the board reduces the negative impact
of a team loss on an individual player. Being drafted onto a “worse” team is no longer a player’s
ill-fated destiny, but simply a setback that can be overcome.

Athletes Unlimited, LLC | www.AUProSports.com | @AUProSports                                   6
Individual Parity Methodology
The AU scoring system is unique in its measurement of individual performance in addition to team
performance. It is important that the system rewards players accurately based on their performance
on the field. In order to determine whether the AU scoring system properly evaluates individual
contributions, we took the top 200 offensive players of the MLB season according to their
offensive Wins Above Replacement (WAR) statistic. This non-standardized sabermetric baseball
statistic measures a player’s total contributions to their team by placing a numeric value on the
number of additional wins the player’s team has achieved versus what would be expected if the
player were replaced. It is one of the few all-encompassing metrics that measures the overall
performance of an individual player. WAR is also context, league, and park neutral. As a result,
WAR can be used to compare players between years, leagues, and teams. However, WAR is not a
perfect holistic measurement, which is discussed later in the paper.

To observe whether or not the AU scoring system properly evaluates individual production, the
results of this analysis should be evaluated based on the similarity in individual rankings between
WAR and AU. Further, the range of scores between WAR and AU can also illustrate the degree
of separation in each system. We calculated the top individual player scores of the MLB 2019
season according to AU’s scoring methodology.

An example calculation for an individual (Cody Bellinger) through the season and the points
accumulated is shown in Figure 3.

Figure 3: Application of AU individual scoring system to Cody Bellinger of the LA Dodgers

Athletes Unlimited, LLC | www.AUProSports.com | @AUProSports                                     7
Table 3: Top 20 Offensive Players in the MLB 2019 season according to AU Scoring

                       Player                  Team               Position       AU Score
            1      Cody Bellinger       LA Dodgers              Right fielder      5680
            2      Alex Bregman         Houston Astros          Third baseman      5500
            3      Christian Yelich     Milwaukee Brewers       Right fielder      5390
            4      Pete Alonso          NY Mets                 First baseman      5360
            5      Mike Trout           LA Angels               Center fielder     5300
            6      Anthony Rendon       LA Angels               Third baseman      5200
            7      Marcus Semien        Oakland Athletics       Shortstop          5200
            8      Mookie Betts         LA Dodgers              Right fielder      5150
            9      Xander Bogaerts      Boston Red Sox          Shortstop          5140
            10     Freddie Freeman      Atlanta Braves          First baseman      5110
            11     Rafael Devers        Boston Red Sox          Third baseman      5110
            12     Jorge Soler          Kansas City Royals      Right fielder      5090
            13     Ronald Acuna Jr.     Atlanta Braves          Center fielder     5070
            14     Nolan Arenado        Colorado Rockies        Third baseman      5030
            15     Juan Soto            Washington Nationals    Left fielder       4990
            16     Bryce Harper         Philadelphia Phillies   Right fielder      4960
            17     Eugenio Suarez       Cincinnati Reds         Third baseman      4940
            18     Carlos Santana       Cleveland Indians       First baseman      4890
            19     Trevor Story         Colorado Rockies        Shortstop          4870
            20     J.D. Martinez        Boston Red Sox          Right fielder      4830

Table 4: Top 20 Offensive Players in the MLB 2019 season according to MLB Offensive WAR

                          Player                 Team                Position     WAR
               1     Mike Trout          LA Angels               Center fielder    8.3
               2     Alex Bregman        Houston Astros          Third baseman     7.7
               3     Marcus Semien       Oakland Athletics       Shortstop         7.5
               4     Christian Yelich    Milwaukee Brewers       Right fielder     7.3
               5     Xander Bogaerts     Boston Red Sox          Shortstop         7.1
               6     Ketel Marte         Arizona Diamondbacks    Center fielder    6.6
               7     Cody Bellinger      LA Dodgers              Right fielder     6.6
               8     Anthony Rendon      LA Angels               Third baseman     6.4
               9     Pete Alonso         NY Mets                 First baseman     5.8
              10     Rafael Devers       Boston Red Sox          Third baseman     5.7
              11     Jorge Polanco       Minnesota Twins         Shortstop         5.4
              12     Mookie Betts        LA Dodgers              Right fielder     5.2
              13     DJ LeMahieu         NY Yankees              Second baseman    5.2
              14     Yoan Moncada        Chicago White Sox       Third baseman     5.2
              15     George Springer     Houston Astros          Right fielder     5.1
              16     Nolan Arenado       Colorado Rockies        Third baseman     5.0
              17     Trevor Story        Colorado Rockies        Shortstop         4.9
              18     Jonathan Villar     Miami Marlins           Second baseman    4.8
              19     Matt Chapman        Oakland Athletics       Third baseman     4.8
              20     Ronald Acuna Jr.    Atlanta Braves          Center fielder    4.8

Athletes Unlimited, LLC | www.AUProSports.com | @AUProSports                                8
Analysis Nearly all of the MLB Top 20 offensive players, according to their WAR scores, make an appearance in the top 20 offensive players according to the AU scoring methodology. This suggests that the AU scoring system generally reflects the individual performance of athletes as measured by conventional empirical metrics. In a system where teams change weekly and where compensation is directly impacted by the individual’s performance, it is important that the system can reflect that athlete’s performance accurately, no matter which team they are drafted on. We can further analyze the degree of continuity between these two systems by measuring the correlation between them, both by player rankings in the season and by their WAR scores. Figures 4 and 5 show scatterplots examining these correlations. Figure 4: Scatterplot of Top 200 Player Rankings according to MLB Offensive WAR vs. AU Offensive Score The correlation calculated between the AU Rank and the Actual WAR Rank is 0.698. Athletes Unlimited, LLC | www.AUProSports.com | @AUProSports 9
Figure 5: Scatterplot of Top 200 Players according to MLB Offensive WAR vs. AU Offensive
Score

The correlation calculated between the AU Offensive Score and the Actual MLB WAR Score is
0.766 which demonstrates a high correlation - and thus high continuity - between these systems.

Further Discussion: Drawbacks to WAR
As mentioned previously, the WAR statistic, while impressive in its ability to generate holistic
scores, is an imperfect empirical comparison to the AU scoring system. During this analysis, we
identified a few MLB players that perform well in the AU scoring system, but do not appear in the
top 20 MLB players according to WAR:

   1.   Freddie Freeman, 1st Baseman (AU: 10, MLB: 36)
   2.   Jorge Soler, Right Fielder/DH (AU: 12, MLB: 33)
   3.   Juan Soto, Left Fielder (AU: 15, MLB: 22)
   4.   Bryce Harper, Right Fielder (AU: 16, MLB: 64)
   5.   Eugenio Suarez, 3rd Baseman (AU: 17, MLB: 30)
   6.   Carlos Santana, 1st Baseman/DH (AU: 18, MLB: 29)
There are three major contributing factors to this discrepancy, which are briefly summarized as
follows. In-depth discussion of the specific mechanics and calculations mentioned here are beyond
the scope of this paper. For more information on the statistics that are mentioned in this discussion,
please visit https://www.baseball-reference.com/about/war_explained.shtml.

Positional Adjustment
Certain defensive positions are more difficult to play than others and thus have greater impact on
the likelihood of a team victory. WAR attempts to factor in these discrepancies by assigning point
values to positions. For example, according to Baseball Reference’s calculation of WAR, the
position multiplier (see figures below) is multiplied by the total innings played at such position
and normalized by dividing by 1,350 innings:

Athletes Unlimited, LLC | www.AUProSports.com | @AUProSports                                       10
1.   +10.0 for a catcher
   2.   +7.5 for a shortstop
   3.   +3.0 for a second baseman
   4.   +2.5 for a center fielder
   5.   +2.0 for a third baseman
   6.   −7.5 for a left fielder
   7.   −7.5 for a right fielder
   8.   −10 for a first baseman
   9.   −15.0 for a designated hitter.

The AU scoring system does not measure differences in performance between positions because
it does not incorporate defensive performance into its overall methodology. Not only does this
avoid the inevitable complexity of factoring defensive value into a new system, it prioritizes
simplicity in order for fans to quickly understand and follow the events of a game. This discrepancy
between the AU scoring system and WAR is the primary reason the AU scoring system awards
certain MLB players more than they traditionally experience.

Park Factor Adjustment
The MLB is a national league with venues across the country. While all major league baseball
fields follow some standard dimensions and regulations, there are variations that impact the
likelihood of certain offensive events. There are also discrepancies in climate, altitude, and weather
that can impact the velocity and properties of baseballs and equipment, such as bats. WAR uses a
complex equation to modify offensive statistics for these variations. A simple way to review the
impact of “park factor” is to compare standard On-Base Plus Slugging (OPS) to OPS+. In contrast
to the MLB, a major component of the Athletes Unlimited softball league is that the entire season
is set to take place in one market (and thus one field). Since players will never leave the market to
compete for league standings, adjusting for park factor becomes irrelevant. This difference
between the AU scoring system and WAR can also factor into the discrepancy in MLB individual
performance from the analysis.

Other Adjustments
Finally, there are minor differences in the weight of offensive events between the AU scoring
system and WAR. A WAR statistic that is useful to reference for these calculations is known as
Weighted On-Base Average (wOBA). Examples of differences include: singles are weighted more
heavily than walks in WAR, whereas AU scores singles and walks equally; and getting caught
stealing incurs a heavier penalty than successfully stealing, whereas AU weighs the reward and
the penalty equally. Additionally, WAR calculates point valuations for specific events that the AU
scoring system does not, such as the impact of hitting a ground ball that results in a double play,
or participating in the execution of a double play. For the sake of simplicity, the AU scoring system
does not account for all variations of offensive events such as the ones listed above. These
discrepancies, while small in comparison to the whole, can add up and make discrepancies larger
than expected.

Athletes Unlimited, LLC | www.AUProSports.com | @AUProSports                                       11
Conclusion
The simulations we performed with the MLB data demonstrate that the AU scoring system has
greater team parity in the league and aligns with conventional measures of individual performance.
The model has greater opportunities to empower athletes and create better and more balanced
sports leagues, and it has far-reaching consequences for increased competition, which can lead to
a better experience for both fans and athletes. Further discussion could be dedicated to the
implementation of a similar system in the MLB and to think of the butterfly effect on the various
decisions and implications it may have. How would player behavior change? How would team
coaches and captains approach the draft? How would approaches to teamwork evolve as players
have fairer chances to represent themselves individually? The AU scoring system has the potential
to set a new precedent for athletic competition by making the game fairer and more intuitive for
players and fans alike.

Athletes Unlimited, LLC | www.AUProSports.com | @AUProSports                                   12
About the Authors
Soham Mahableshwarkar is a graduate student at New York University pursuing a Masters in Computer
Science specializing in Data Analytics, having previously completed his undergraduate degree in Computer
Engineering from University of Pune. He is the co-founder and CEO of Scriblr, a literature tech company
he founded in 2019 aiming to change the way readers and writers both create and consume books. He
previously founded FuzzyMonster Studios, a game development studio venture and Gamer Unit, a game
review website during his high school years. He is currently a Data Science intern at Athletes Unlimited.

He is a published poet with his debut poetry collection ‘Reveries’ launched in 2017 and is currently working
on the final draft of his fiction novel, Dreamcatcher. He has previously co-written research papers as part
of his undergraduate curriculum in the fields of Computer Vision and Neural Networks as well.

                                                    ***

Dr. Philip Z. Maymin is a professor of analytics and the director of the Master of Science in Business
Analytics program at the Fairfield University Dolan School of Business. He is the founding managing editor
of Algorithmic Finance and the co-founder and co-editor-in-chief of the Journal of Sports Analytics. He is
the Chief Technology Officer for the Esports Development League (ESDL), an Insight Partner with
Essentia Analytics, an advisor to Athletes Unlimited, and an affiliate of the Langer Mindfulness Institute,
and has been an analytics consultant with several NBA teams.

He holds a Ph.D. in Finance from the University of Chicago (dissertation chair: Richard H. Thaler), a
Master's in Applied Mathematics from Harvard University, and a Bachelor's in Computer Science from
Harvard University. He also holds a J.D. and is an attorney-at-law admitted to practice in California.

He was a finalist for the 2010 Bastiat Prize for Online Journalism. He was awarded a Wolfram Innovator
Award in 2015. He won the Wolfram Live Coding Challenge in 2016 and second place in 2018, and he
won the Wolfram One-Liner Competition in 2015, 2016, 2018, and 2019. He was named one of the Top 50
Data and Analytics Professionals in the US and Canada by Corinium in 2018. He is the only person to have
won both the Grand Prize for Best Research Paper (2018) and the Hackathon (2020) at the MIT Sloan
Sports Analytics Conference.

His popular writings have been published in dozens of media outlets ranging from Bloomberg to Forbes to
the New York Post to American Banker to regional newspapers, and his research has been profiled in
dozens more, including The New York Times, Wall Street Journal, USA Today, Financial Times, Boston
Globe, NPR, BBC, Guardian (UK), CNBC, Newsweek Poland, Financial Times Deutschland, and others.

His research on behavioral and algorithmic finance has appeared in Quantitative Finance, North American
Journal of Economics and Finance, Journal of Portfolio Management, Journal of Wealth Management,
Journal of Applied Finance, and Financial Markets and Portfolio Management, among others, and his
textbook Financial Hacking was recently published by World Scientific.

Athletes Unlimited, LLC | www.AUProSports.com | @AUProSports                                             13
You can also read