2021 Integrated Resource Plan - February 5, 2021 - El Paso ...
←
→
Page content transcription
If your browser does not render page correctly, please read the page content below

2021 Integrated Resource Plan
             February 5, 2021
Welcome
2021 El Paso Electric Company Integrated Resource Plan
Public Participation February 2021 Meeting

Agenda

1) Modeling Update joint presentation by E3 and EPE
2) Discuss dates of future meetings

Safe Harbor

Certain matters discussed in this Integrated Resource Plan ("IRP") public advisory group presentation other than statements of
historical information are "forward-looking statements" made pursuant to the safe harbor provisions of the Section 27A of the
Securities Act of 1933, as amended, and Section 21E of the Securities Exchange Act of 1934, as amended.

Forward-looking statements often include words like we “believe”, “anticipate”, “target”, “project”, “expect”, “predict”, “pro forma”,
“estimate”, “intend”, “will”, “is designed to”, “plan” and words of similar meaning, or are indicated by the Company’s discussion of
strategies or trends. Forward-looking statements describe the Company’s future plans, objectives, expectations or goals and include,
but are not limited to, statements regarding [anticipated future generation costs, resource need, customer growth rates, rate
structure, fuel costs, purchased power pricing]. Such statements are subject to a variety of risks, uncertainties and other factors,
most of which are beyond El Paso Electric Company's ("EPE" or the "Company") control, and many of which could have a significant
impact on the Company's operations, results of operations, and financial condition, and could cause actual results to differ materially
from those anticipated. Additional information concerning factors that could cause actual results to differ materially from those
expressed in forward-looking statements is contained in EPE's Form 10-K for the fiscal year ended December 31, 2019 and
Quarterly Reports filed in 2020. Any such forward-looking statement is qualified by reference to these risks and factors. EPE cautions
that these risks and factors are not exclusive.

Although the Company believes that the expectations reflected in such forward-looking statements are reasonable, no assurances
can be given that these expectations will prove to be correct. Forward-looking statements by their nature that could substantial risks
and uncertainties that could significantly impact expected results, and actual future results could differ materially from those
described in such statements. Management cautions against putting undue reliance on forward-looking statements or projecting any
future assumptions based on such statements. Forward-looking statements speak only as of the date of this IRP public advisory
group presentation, and EPE does not undertake to update any forward-looking statement contained herein, except to the extent the
events or circumstances constitute material changes in this IRP that are required to be reported to the New Mexico Public Regulation
Commission ("NMPRC" or "Commission") pursuant to its IRP Rule, 17.7.3 New Mexico Administrative Code.
Meeting Format and Guidelines

  • Presentations will be by EPE staff and invited speakers.
     ‒ Presenters will complete presentation prior to answering
       questions.
  • Participants may submit questions through the WebEx
    Q&A box.
  • Please use the Chat box for technical issues/questions.
  • Communications should be respectful, to the point and
    on topic.
  • Written questions submitted after the meeting will be
    responded to in writing within 10 days.
New Mexico IRP Objectives
Primary objective the NM RPS and requirements
   • Provide a resource portfolio for New Mexico that:
      • Meets the New Mexico Renewable Energy Act
        requirements for renewables and decarbonization,
      • In the most cost-effective manner,
      • While maintaining reliability.
   • Analyze our total system resource planning which
     includes Texas resource requirements
      • To leverage as much as possible the benefits of
        economies of scale,
      • Continue to pursue heavy renewable and clean energy
        integration for total system,
      • Assess operational requirements for total system which
        EPE will need to effectively address to maintain reliability.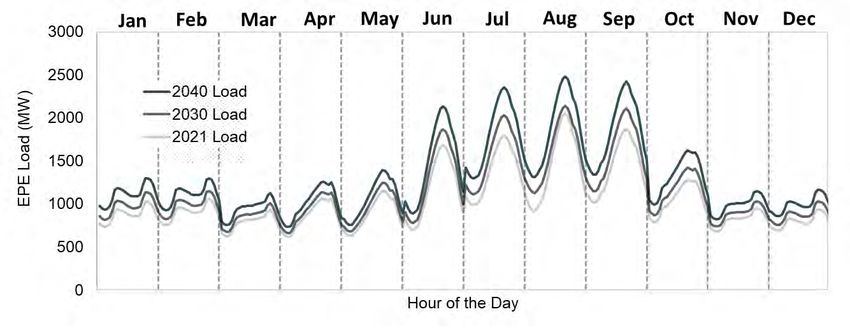
Modeling to Meet Objectives
  • Analyze the most cost-effective portfolio without
    RPS requirements imposed to establish baseline
    cost

  • If the previous portfolio does not meet New Mexico
    RPS, impose the NM RPS requirements

  • EPE will further analyze total system scenarios with
    greater renewables and decarbonization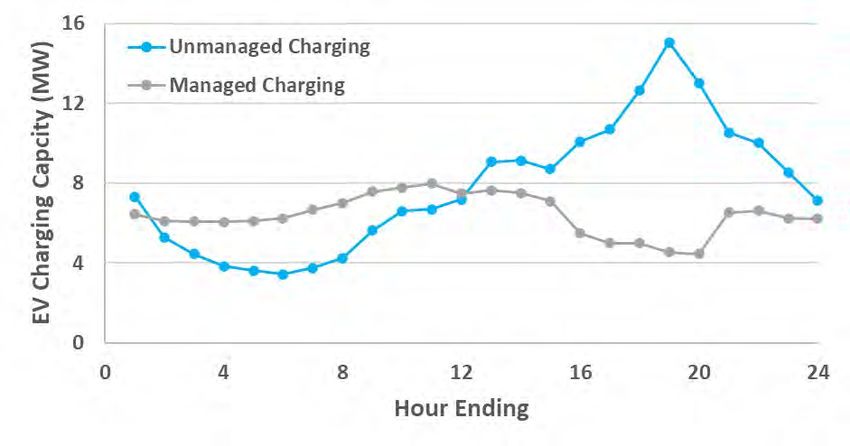
Presentation of NM IRP and Total System
  • The presentations will include total system
    results and will identify NM specific implications
    where applicable

  • Future meetings will include both NM portfolio
    details and total system portfolios

  • Jurisdictional allocation of resources and
    associated costs will be discussed in future
    meetings
EPE Joining the Western EIM
  • EPE will be joining the Western Energy Imbalance
    Market in 2023

  • The EIM offers cost benefits to customers and will add
    further benefits integrating additional renewables

  • Both Public Service of New Mexico and Tucson Electric
    Power are joining and now offer EPE a contiguous
    transmission connection to the Western EIM

  • Joining the EIM does not absolve EPE’s obligation to
    plan for resources to meet customer load nor does it
    impact the IRP
El Paso Electric IRP
Modeling Update
Preliminary inputs, assumptions, and scenarios
2/5/2020

                                       Arne Olson, Senior Partner
                                             Jack Moore, Director
                                 Joe Hooker, Managing Consultant
                                           Huai Jiang, Consultant
                                      Manu Mogadali, Consultant
                                           Yuchi Sun, Consultant
                                         Chen Zhang, Consultant
Outline
Future system needs
Existing and planned resources
Resource options
Draft PRM results
Draft ELCC results
Proposed scenarios
Confidential Preliminary Draft 10Future System Needs through
2045*
* The NM ETA requires 100% zero carbon in 2045Load forecast
Before accounting for electric Energy demand (without EVs)
vehicles,* load is forecast to grow
from ~8,000 GWh in 2021 to ~13,000
GWh in 2045
Before accounting for electric
vehicles, peak load is forecast to
grow from 2,000 MW in 2021 to 3,000
MW in 2045
These load forecasts are net of
incremental energy efficiency Peak demand (without EVs)
programs, which help mitigate load
growth
• Incremental EE reaches 1,000
GWh and 170 MW of contribution to
peak by 2045
The demand and energy forecasts
will be updated in April
* EPE filed its Transportation Electrification Plan in Docket No. 20-00241-UT. Note: energy demand and peak demand is not net of incremental DGPV.
Confidential Preliminary Draft 12Monthly average daily load shapes
Energy demand for cooling in the summer results in significant
differences in seasonal energy usage and seasonal load profiles
Average Daily Load Shape By Month Across Weather Conditions (without EVs)
Note: hour of day based on MST
Confidential Preliminary Draft 13Electric vehicle forecast
EPE is currently developing an Number of electric vehicles
updated forecast for electric
vehicles
• The current forecast relies on a data
from EPE through 2039 and then is
extrapolated linearly through 2045
• EVs include both battery electric
vehicles (BEVs) and plug-in hybrids
(PHEVs)
Based on this forecast, EV Electric vehicle energy demand
charging would constitute 12% of
total electric load by 2045
Confidential Preliminary Draft 14Managed vs. unmanaged charging
E3 developed two sets of charging profiles for a population of electric
vehicles:
• The unmanaged charging profile assumes that vehicles are charged immediately
following the completion of trips
• The managed charging profile assumes that vehicles charge according to a time-of-
use rate or some other mechanism that ensures charging coincides with lower-cost
hours
Summer Weekday Charging in 2030
Managed charging
reduces charging
demand over during
the afternoon and
early evening hours,
reducing the
contribution to peak
The peak load impact is ~5 MW in
load
2030 andReserve requirements
During each hour, El Paso Electric maintains the following reserves to
ensure reliable operations of the system:
Spinning reserves
• 3.5% of load
• Synchronized resources that can serve load in the event of a system contingency
Non-spinning reserves
• 3.5% of load
• Resources that can serve load in the event of a system contingency
Regulating reserves
• 35 MW upward and 35MW downward reserves
• Fast-response generators to balance real time fluctuations in load
The planning reserve margin is used for long-term planning ensures that
the system has enough resources to ensure reliability. The planning reserve
margin is described in a later section
Confidential Preliminary Draft 16Clean energy policy requirements
New Mexico’s Energy Transition NM RPS and ETA requirement
Act sets increasing RPS and 100%
by 2045
clean energy targets over time 80% Zero
by 2040 Carbon
65%
• 80% RPS as fraction of retail sales by 2035
50%
by 2040 40% by 2030
by 2025
• 100% zero-carbon generation by
2045 RPS Energy Demand
TX RPS Requirement
Texas’ RPS policy sets a fixed
RPS energy requirement (in
GWh) in all years
• El Paso Electric’s share of the state
365 GWh
RPS is assumed to remain constant in all years
RPS Energy Demand
Note: the GWh is based on the EPE forecast for retail sales. The
requirement is defined in terms of a percentage of retail sales
Confidential Preliminary Draft 17Existing and Planned Resources
EPE Existing and Planned Resources

                         Existing Resources                          Planned Resources*
                                                                              2022-2023

* 19-00348-UT – 100 MW Solar and 100 MW Solar/50 MW Battery
* 19-00099-UT – 70 MW Solar
* 19-00349-UT – CCN New gas disallowed in New Mexico

                                             Confidential Preliminary Draft               19
Existing thermal resources
The following are thermal resources in EPE’s resource portfolio
In the next decade, 192 MW of capacity is expected to retire in 2022, 317 MW of
capacity is expected to retire in 2026, and 63 MW is expected to retire in 2030, for
a total of 572 MW
Summer Planned
Conventional Generation Jurisdiction Fuel Type COD Year Age at Retirement
Net MW Retirement Year
Rio Grande 6* System Gas Conv. Steamer 45 1957 Inactive Reserve 63
Rio Grande 7 System Gas Conv. Steamer 46 1958 2022 64
Rio Grande 8 System Gas Conv. Steamer 144 1972 2033 61
Rio Grande 9 System Gas CT 88 2013 2058 45
Newman 1 System Gas Conv. Steamer 73 1960 2022 62
Newman 2 System Gas Conv. Steamer 73 1963 2022 59
Newman 3 System Gas Conv. Steamer 90 1966 2026 60
Newman 4 System Gas 2x1 CC 227 1975 2026 51
Newman 5 System Gas 2x1 CC 266 2009 2061 52
Copper System Gas CT 63 1980 2030 50
Montana 1 System Gas CT 88 2015 2060 45
Montana 2 System Gas CT 88 2015 2060 45
Montana 3 System Gas CT 88 2016 2061 45
Montana 4 System Gas CT 88 2016 2061 45
Palo Verde 1 System Nuclear Steam 207 1986 2045 59
Palo Verde 2 System Nuclear Steam 208 1986 2046 60
Palo Verde 3 System Nuclear Steam 207 1988 2047 59
* EPE filed for an application with NMPRC for abandonment on Oct 6, 2020 (Case No. 20-00194-UT). RG 6 is no longer included in EPE
Official L&R.
Confidential Preliminary Draft 20Existing renewable resources
The following are renewable resources in EPE’s resource portfolio that are
currently operating:
Existing Renewable Nameplate Capacity Planned Retirement
Jurisdiction
Facilities* (MW) Year
Hatch (Solar) 5 NM 2036
Chaparral (Solar) 10 NM 2037
Airport (Solar) 12 NM 2037
Roadrunner (Solar) 20 NM 2031
Macho Springs (Solar) 50 System** 2034
Newman (Solar)*** 10 TX 2044
Texas Community Solar 3 TX 2047
Holloman (Solar) 5 NM 2048
* This table does not include planned renewable facilities
** System allocation between TX and NM. TX/NM allocation is approximately 80/20.
*** Newman Solar allocates 8 MW to Texas and 2 MW to EPE Community Solar Program.
Confidential Preliminary Draft 21Planned resource additions
The following are resources that are not currently online but are contracted
and scheduled to come online soon:
Nameplate Capacity Planned Retirement
Planned Renewable Generation (MW) Jurisdiction COD Year
Hecate Energy Santa Teresa 1 (Solar) 100 System* 2022-23 2042
Buena Vista Energy Center 1 (Solar/Storage) 100/50 System 2022-23 2042
Hecate Energy Santa Teresa 2 (Solar) 50 NM 2022-23 2042
Buena Vista Energy Center 2 (Solar) 20 NM 2022-23 2042
Newman Unit 6 (gas) 228 TX** 2023 2063
* System allocation between TX and NM. TX/NM allocation is approximately 80/20.
** Newman Unit 6 was rejected by NMPRC. EPE will continue with permitting and planning for construction of
the NWMN Unit to meet its projected Texas customer demand in 2023.
Confidential Preliminary Draft 22Resource Options
Potential resource options

         Original version presented at the 8/14/20 Public Advisory Meeting

             Confidential Preliminary Draft                                  24
Supply-Side Resources
Renewable resources in EPE service area

Wind                                    Solar

                                        Geothermal

           Confidential Preliminary Draft            26
Renewable resource locations
Southeast of
Albuquerque Wind
(51% CF)
Geothermal
Sites (80% CF) East of
Artesia Wind
(44% CF)
Solar
North of
Lordsburg Wind Existing / Planned
Wind
(37% CF) Solar Sites
Geothermal
The system currently does not have any wind or geothermal facilities. These are locations for potential future projects
Confidential Preliminary Draft 27Wind and solar profiles simulated using
NREL data
E3 creates location-specific hourly profiles for wind and solar resources
using NREL’s publicly available datasets
Wind Integration National Dataset (WIND Toolkit)
• 126,000 sites across continental US
• 5-min temporal resolution
• 2007-2013 historical period
• Available through Wind Prospector
National Solar Radiation Database (NSRDB)
• 4 x 4 km grid spatial representation
• 30-min temporal resolution
• 1998-2017 historical period
• Available through Solar Prospector
Confidential Preliminary Draft 28Solar profiles
Average Daily Solar Profile By Month Across Weather Conditions
Annual
capacity factor
Future
• 32%
Existing/planned:
• 28% (avg.)
Note that these are average values. The profiles vary hour to hour and year to year
Confidential Preliminary Draft 29Wind profiles
Average Daily Wind Profile By Month Across Weather Conditions
(44% capacity factor)
(50% CF)
(37% CF)
(44% CF)
Note that these are average values. The profiles vary hour to hour and year to year
Confidential Preliminary Draft 30Geothermal profile
Average Daily Geothermal Profile By Month Across Weather Conditions
Source: Black & Veatch WREZ model
Note that these are average values. The profiles vary hour to hour and year to year
Confidential Preliminary Draft 31Sources for resource cost information
Resource Input Solar PV
Source of Data
Resource Potential Given the abundance of solar and wind resources relative to the size of
• Technical potential (MW) EPE’s system, no limits are applied for renewables
NREL Annual Technology Baseline (ATB) for Renewables/Thermal
Supplemented with regional cost adjustments and
Technology Cost interconnection costs from NREL ReEDS datasets
• Capital cost ($/kW)
• Fixed O&M ($/kW-yr)
• Interconnection cost ($/kW) Lazard Levelized Cost of Storage 6.0 / NREL ATB for Batteries
Lazard’s LCOS 6.0 costs are used for batteries in the near term and
the long-term cost decline trajectory from the NREL ATB is applied
Financing E3 Pro Forma Financial Model
• Project capital structure Calculates price for a long-term cost-based power purchase
• Tax credits agreement between a third-party developer and a credit-worthy utility
Transmission El Paso Electric System Planning team
• Existing headroom Provided a simplified representation of the transmission system for purposes
• Cost to expand transmission of determining headroom on the transmission system and the cost of expansion
Confidential and
Confidential Deliberative
Preliminary Draft
Draft 32Renewable costs
The cost of renewables on a Real Levelized Cost ($/MWh)
$/MWh basis shows a clear
ordering from lower cost to
higher cost:
• Solar
• Wind
• Geothermal
• Biomass
The value of each resource differs
and depends on several factors:
• Coincidence with load, during peak
months and throughout the year
• Diversity relative to other resources
• Need for incremental transmission
Note: these costs do not include interconnection or transmission upgrade costs
Confidential Preliminary Draft 33Solar and wind costs
The PPA rates for wind and Real Levelized Cost ($/MWh)
solar are expected to rise in the
near term
• This is due to the expiration of the
production tax credit (PTC) and the
step-down of the investment tax
credit (ITC)
Technological improvements
are expected to drive down the
costs of solar and wind
resources in the long run
Note: these costs do not include interconnection or transmission upgrade costs
Confidential Preliminary Draft 34Simplified topology for modeling
For wind, requires wheeling
via Western Spirit to south of
Load West Mesa
Solar Southeast East of
of ABQ Artesia
Wind Wind
Wind
Northeast
Geo El Paso
NM
New Tx
North of
Northwest
Lordsburg El Paso
El Paso
Wind
East EP,
VanHorn,
Hatch
There is existing headroom on
the system that can be utilized Rest of TX
for renewable resources
Confidential Preliminary Draft 35Transmission expansion beyond headroom
limits for additional remote renewables
El Paso Electric estimated transmission upgrade costs for increasing the transfer
capability beyond existing headroom limits
Below is information related to the upgrades:
Length
Zone(s) Terminus Resource Voltage
(miles)
Northwest El Paso Load Centers Solar 55 345 kV
East El Paso,
Load Centers Solar 25-40 115 kV
Hatch
Northeast El Paso Load Centers Solar 75 115 kV
East of Artesia Northeast El Paso Wind 200 345 kV
Southeast of ABQ Load Centers Wind 125 345 kV
North of Lordsburg Northwest El Paso Wind 50 345 kV
Confidential Preliminary Draft 36Resource costs for batteries and gas units
The cost of batteries is expected to decline significantly over the next few decades,
while the cost of gas facilities is expected to remain more steady
Upfront Capital Cost ($/kW) Levelized Cost ($/kW-yr)
Confidential Preliminary Draft 37Demand-Side Resources
Demand Response Comparison

Actual Energy Efficiency for New Mexico & Texas, 2019

Energy Efficiency Savings is currently being updated for 2020 actuals.
Does not include Voluntary Load Management
Demand Side Management/Energy Efficiency

• EPE is exploring the possibility of contracting a national
  consultant to perform a Potential Study for DSM/EE as a
  follow up to the IRP
• In the IRP, the modeling will incorporate general levels
  of DSM to assess resource portfolio cost impact
• EPE is open to dialogue for DSM/EE options; however,
   – Solicit options that are technologically viable
   – Levels that are attainable considering EPE customer count
      (i.e., customer count x demand reduction per customer)
   – Reasonable demand reduction amount (i.e., 1 kW per
      customer for thermostat program)
   – Characteristics for dispatchability and if any constraints for
      number of dispatches
Market assumptions
Gas prices
E3 provided the gas price Gas Hub Prices
forecast through 2029 and E3
trended this to follow the gas
price forecast from EIA’s 2020
Annual Energy Outlook
Gas prices are projected to rise
steadily from 2020 through 2045
Relative to other utilities, EPE
has access to gas that is
relatively lower cost
Confidential Preliminary Draft 42Market prices
Below is E3’s draft market price forecast by time of day (in 2021 $/MWh)
Off-Peak Average Price
Annual Average Price
On-Peak Average Price
Confidential Preliminary Draft 43Modeling imports and exports
Imports Exports
EPE can import power from remote EPE can export power to other entities in
generation facilities in WECC via Path 47 WECC via Path 47
• Total import capability: 645 MW (via • Total export capability: 645 MW (via
Path 47) Path 47)
• EPE utilizes most of this import • First, EPE has the potential to sell a
capability to import it’s share of Palo portion of the generation from its share
Verde generation (622 MW) of Palo Verde (622 MW) to other
entities. This would reduce imports
• Additionally, the model allows market
purchases and imports from the Palo • Additionally, excess local generation
Verde trading hub can be exported to WECC, if economic
Imports can vary on an hourly basis Exports can vary on an hourly basis
depending on the hourly energy price at depending on the hourly energy price at
the Palo Verde trading hub and available the Palo Verde trading hub
headroom
The Eddy Line (DC tie to Eastern
Interconnection) provides 35 MW of
capacity for reliability but does not serve
as an import market
Confidential Preliminary Draft 44Draft PRM results
Overview
The planning reserve margin (PRM) is calculated to ensure that the
system has enough capacity to limit loss of load events to below the
reliability target (i.e. to ensure resource adequacy)
E3’s proprietary RECAP model simulates load and resource availability
over thousands of simulations years to determine the system PRM and
the ELCC of resources
The PRM is a function of:
• Load variability within and across years
• Operating reserves that must be held under all circumstances
• For the ICAP PRM convention (which is used in this presentation), thermal generator
forced outages also contribute to the reserve margin requirement
Confidential Preliminary Draft 46Simulated annual peak load
Simulated load will get scaled based on monthly peak load and energy
forecast in the future analysis years
Annual Peak Load under Different Weather Year in 2030 Conditions
Statistic Peak
1-in-2 2,392
Basis for
1-in-5 2,494 calculating
PRM
1-in-10 2,527
requirement
1-in-20 2,586
1-in-50 2,596
Confidential Preliminary Draft 47Inputs for thermal generators
The capacity rating is based on weather conditions during summer. The
forced outage rates are based on multiple years of historical observations,
with extreme outage events removed
*Note: Newman 6 is a planned resource addition
** Palo Verde is also subject to transmission line outages
Confidential Preliminary Draft 48Planning reserve margin results
Below are planning reserve margin and system reliability metrics
for the EPE system in 2021, 2030, and 2040
2021 EPE 2030 EPE 2040 EPE
Statistic
System System System
1-in-2 Peak Load
2,103 2,367 2,890
(incl. EV, EE, and existing DGPV)
Total Operating Reserves (MW) 109 120 135
Target Installed Capacity (“ICAP”) PRM 21.1% 19.2% 16.1%
Total Effective Capacity Requirement
2,547 2,821 3,355
(MW)
Capacity Shortfall (MW) 351 Not assessed Not assessed
EUE (MWh/year) 3,571 Not assessed Not assessed
LOLE (days/year) 10.8 Not assessed Not assessed
LOLH (hours/year) 41.1 Not assessed Not assessed
Confidential Preliminary Draft 49Load and resource table
RECAP Modeling Outputs for El Paso (2021)
1-in-2 Peak 2,103 MW 1
Reliability Metric LOLE
Target Value 0.1 days/yr
ICAP PRM Requirement (21%) 2,547 MW
Summer Maximum Effective Average
Supply Resources
Capacity (MW) Capacity (MW) ELCC %
Gas 1,412 1,289 91%
Palo Verde2 622 579 93%
Solar (incl. incremental DGPV) 136 79 58%
Wind/Geothermal/Storage 0 0 n/a
Interruptible Load 43 43 100%
Imports via Eddy Line 50 35 70%3
TOTAL 2,263 2,025
Total MW for Satisfying ICAP PRM 1,412 + 622 + 79 + 43 + 35 = 2,191
Capacity shortfall (MW) 351
Actual PRM (ICAP)4 4% (vs. 21% target PRM)
1) Including EVs, EE, and existing DGPV
2) PV3 is modelled as a system resource and subject to proxy pricing in Case No. 20-00104-UT.
3) De-rate of 30% is applied to Eddy line, based on outage data in 2020
4) The ICAP PRM convention counts thermal resources at summer maximum capacity and other resources at effective capacity. The
PRM requirement accounts for the effect of forced outages at the thermal facilities
Confidential Preliminary Draft 50Loss of load probability distribution in
2021 and 2030
In 2021, most of the loss-of-load events are concentrated during the peak period
in the summer
In 2030, following the addition of utility-scale and distributed solar, loss-of-lead
events become more predominant in the evening hours
2021
2030
After retirements and including planned additions but no other additions
Confidential Preliminary Draft 51Draft ELCC results
Overview
Effective load carrying capability (ELCC) is the quantity of ‘perfect
capacity’ that could be replaced or avoided with wind, solar, storage, etc.
while providing equivalent system reliability. ELCC is calculated by
RECAP in this study
The ELCC of a resource depends primarily on the following:
• Coincidence with load
– Positive correlation with load results in higher capacity value
• Production variability
– The prevalence of low production periods reduces the capacity value
• Existing quantity of other resources The ELCC of a resource is a
– Same or similar resource types have diversity penalty function of its penetration
and the penetration of other
– Complementary resource types have diversity benefit resources
Confidential Preliminary Draft 53Solar and storage ELCC dynamics
Below is a hypothetical example to illustrate the ELCC dynamics for solar additions,
storage additions, and solar/storage additions on a hypothetical system
• Adding solar in isolation reduces loss-of-load events during the day, but not during the
evening, so the contribution to resource adequacy decreases at higher penetrations
• Adding storage in isolation can help reduce loss-of-load events, but the relatively short
duration becomes more limiting at higher penetrations of storage
• Adding both solar and storage to the system results in a greater contribution to resource
adequacy than when added individually. Solar additions concentrate loss-of-load events
during a limited number of hours, during which storage can discharge
Add 15 GW Solar Add 15 GW Storage Add 15 GW Solar & Storage
Confidential Preliminary Draft 542030 Solar ELCC curves
The first 500 MW solar by 2030 has an Average and Incremental ELCC for Solar
average ELCC of about 45%
• This includes existing utility-scale solar,
planned utility-scale solar, and incremental
distributed solar
• The initial tranche of solar achieves the highest
incremental contribution to resource adequacy
The incremental ELCC of solar drops off
at higher levels
• For 1 GW), the ELCC of
solar improves
• This suggests a significant diversity benefit
between solar and storage
• RECAP captures this diversity benefit by
modeling a solar/storage ELCC surface
Confidential Preliminary Draft 552030 Storage ELCC curves
The first 400 MW of 4 hour Average and Incremental ELCC for Storage
storage has an ELCC of close
to 100% in 2030
The incremental ELCC falls at
higher penetration levels
• The duration becomes limiting as
more storage is added
If the system has more solar,
the ELCC of storage is higher
• When the system has 500 MW of
solar, the incremental ELCC of
storage is ~40% for the 0.5-1 GW
tranche
• When the system has 1,000 MW
of solar, the incremental ELCC of
storage is ~60% for the 0.5-1 GW
tranche
Confidential Preliminary Draft 562030 Wind ELCC curves
The ELCC of wind represents Average and Incremental ELCC for Wind
the ELCC of a combination of
wind resources
• Including the North of Lordsburg,
Southeast of Albuquerque, and
East of Artesia locations
• The high capacity factor of ~40%+
is negated partially by
misalignment between wind output
and energy demand
– EPE load peaks in the summer
and late afternoon
– Wind output is concentrated in
spring/winter and late evening
The incremental ELCC of wind
starts at 30% and drops to 5%
at ~1 GW
Confidential Preliminary Draft 572030 Geothermal ELCC curves
Geothermal has an ELCC of 50%, Average and Incremental ELCC for Geothermal
which is much lower than its
capacity factor of ~80%
• Like wind, this is due to the
misalignment between energy
demand and geothermal output
• Geothermal has a production dip
in summer and mid day due to the
higher temperatures
The ELCC of geothermal shows
much lower diminishing returns
with increase penetration
• This is because geothermal
produces around the clock each
day
• Even at high penetration levels,
geothermal can contribute to
ensuring resource adequacy
Confidential Preliminary Draft 58Proposed capacity expansion
scenariosProposed scenarios
Least-cost case
• Counterfactual for assessing other cases
Base case (New Mexico ETA-compliant)
• The New Mexico ETA applies to all cases except for the least-cost case
Low carbon cases
• Scenarios that increase the share of zero-carbon resources by more than existing
policies
High DG case
• Higher penetration of distributed solar
High DSM case
• Higher levels of energy efficiency and demand response
No new gas case
• No addition of gas capacity after the addition of Newman 6
Carbon price cases
• Three carbon price trajectories
Confidential Preliminary Draft 60Next steps
Gather stakeholder feedback
Perform capacity expansion portfolio analyses
Perform sensitivity analysis on reliability target
Confidential Preliminary Draft 61Discussion
Future meetings
1) Week of March 15, 2021
2) Week of April 22, 2021Thank You!
You can also read