Citius, Altius, Fortius; Is It Enough to Achieve Success in Basketball? - MDPI
←
→
Page content transcription
If your browser does not render page correctly, please read the page content below
International Journal of
           Environmental Research
           and Public Health

Article
Citius, Altius, Fortius; Is It Enough to Achieve
Success in Basketball?
Javier García-Rubio 1,2, * , Daniel Carreras 1 , Sebastian Feu 3 , Antonio Antunez 1            and
Sergio J. Ibáñez 1
 1    Training Optimization and Sports Performance Research Group (GOERD), Sport Science Faculty,
      University of Extremadura, 10005 Caceres, Spain; danielcarreras1995@gmail.com (D.C.);
      Antunez@unex.es (A.A.); sibanez@unex.es (S.J.I.)
 2    Facultad de Educación, Universidad Autónoma de Chile, Santiago 7500912, Chile
 3    Facultad de Educación, University of Extremadura, 60001 Badajoz, Spain; sfeu@unex.es
 *    Correspondence: jagaru@unex.es

 Received: 2 August 2020; Accepted: 29 September 2020; Published: 9 October 2020

 Abstract: The NBA Draft Combine includes a series of standardized measurements and drills that
 provide NBA teams with an opportunity to evaluate players. The purpose of this research was to
 identify the Combine tests that explain draft position and future performance in the NBA rookie
 season. Variables were selected from the previous categories of anthropometric measurements and
 strength and agility tests. A regression analysis was carried out. Combine variables, anthropometric
 and agility/strength variables were analyzed to explore their effect on draft position. Moreover,
 correlation analyses were performed to identify relationships among: (i) Combine anthropometric
 and strength and agility measures and game performance through game related statistics; and (ii)
 the draft position and game performance using Pearson’s correlation coefficients. Results show
 that the Combine test does not predict draft position, with the exception of hand width and height
 in frontcourt players, and standard vertical jump and running vertical jump. Future performance
 indicators were explained by several Combine tests in all players.

 Keywords: physical conditioning; performance; basketball

1. Introduction
      It has been stated that several physical capacities or athletics abilities are related with high level
performance and can influence players’ game performance, such as morphological characteristics,
physical fitness or technical and tactical skills [1–3]. In fact, athletic measurement has been widely
used with future sport performance success purposes [4]. However, research on National Basketball
Association (NBA) and National Football League (NFL) players has shown that higher picks in the draft
will not always have successful careers [5,6]. Moreover, research has pointed out that the best teams
recruit young players according to their chronological age [7], meaning that more mature players have
better opportunities of being scouted. In this respect, it has been hypothesized that, perhaps, on-court
performance, measured from game-related statistics (points, rebounds . . . ), is a better indicator of
future performance than fitness measurements with physical tests (anthropometric and strength and
agility) in the Combine [8].
      The fitness evaluation of basketball players is carried out through generic or specific tests for
sports both with laboratory and field tests. The literature review reveals the paucity of specific tests
to assess the physical qualities of basketball players [9]. For an ecological evaluation and greater
application and transfer to the real context of the competition, it is necessary to use specific and field
tests [10], which involve the identification and motivation of the players.

Int. J. Environ. Res. Public Health 2020, 17, 7355; doi:10.3390/ijerph17207355     www.mdpi.com/journal/ijerph
Int. J. Environ. Res. Public Health 2020, 17, 7355 2 of 10
Athletic ability is positively associated with future success in basketball, especially morphological
features [11]. In the NFL, several athletics measurements such as power [12], sprint time [13] or vertical
jump height in collegiate players [14] have been associated with success. Moreover, in hockey it has
been stated that players’ speed, strength, power and body composition are critical components for
play [15,16]. In those sports where physical contact is allowed and necessary to succeed for some
playing positions, such as in football or hockey, speed is fundamental. In basketball, the playing field
is smaller, so speed is not as crucial as in football. However, in both sports the context is continuously
changing and unpredictable, so other skills are also important to succeed. Specifically, in the basketball
Combine, drafted players outperformed undrafted players in height, wingspan, vertical jump height
and reach, line agility and three-quarter sprint test in all five playing positions. Specifically, drafted
guards achieved better results in leg power and height and wingspan. For forwards and centers, height
and wingspan were also determinants, as were speed and agility [17]. In another study, Combine
measurements and on-court performance of drafted players, revealed a positive association between
anthropometric measurements and performance. This study makes groups with Combine variables,
establishing three subscales of all measurements. Moreover, on-court performances are not individual
statistics, are they are based on team performance [18]. For all the above, the purpose of this research
was to identify the Combine tests that explain draft position and future performance in the NBA rookie
season. The specific objectives were: (i) to predict what Combine measures explain draft position,
in order to establish what tests are useful; (ii) to analyze what Combine measures are related to game
performance; and (iii) to analyze draft position and rookie year performance.
2. Materials and Methods
2.1. Participants
The participants in the study were those basketball players that participated in the NBA Draft
Combine from 1999 to 2018 (20 seasons). Data were retrieved from https://stats.nba.com/draft/
combine/ [19], the official website of the Combine. Only drafted players (who subsequently played in
the NBA) were selected for the study (n = 723). The Combine is composed of three different types of
test: anthropometric measurements, strength and agility tests, non- stationary and spot up shooting
tests. For the present study only anthropometric and strength and agility test were used. This is
a retrospective study design, using data from Combine, which are available in various public domains.
European General Data Protection Law procedures were followed in order to maintain the anonymity
of the sampled players. This study was conducted as a secondary statistical analysis of data available
through web-based public access with no individual health information.
2.2. Variables and Procedures
Variables were selected from the previous categories of anthropometric measurements and strength
and agility tests. Anthropometric measures included: (i) Height without shoes (H): using a physician
scale measured in feet and inches; (ii) Weight (W) (kg): measured with a physician scale; (iii) Wingspan
(WS): Measured using a measuring tape in feet and inches, from the tip of the left hand to the tip of the
right hand with the arms held horizontally; (iv) Standing Reach (SR), measured with a measuring tape,
from the floor to the longest tips of the hands with both arms reaching up and players standing straight;
(v) Body fat Percentage (BFAT), using a skinfold caliper, measuring the skinfold thickness of pectoral,
abdomen, and quadriceps; (vi) Hand Length (HL) (cm), The length from the bottom of the player’s
palm to the tip of the middle finger measured with a measuring tape; and (vii) Hand Width (HW, cm),
the length from the tip of the player’s thumb to the tip of the little finger measured with a measuring
tape. Strength and agility tests included: (i) Strength (Str): 83.9 kg (135 pounds) Bench Press, maximum
number of bench press repetitions at 83.9 kg with proper technique is recorded; (ii) Power: Vertical
Jump (VJ). The vertical jump is an athlete’s explosive leg power test. Two versions of this test are
performed, the standard (no step) vertical jump and a running Max Vert (RVJ). (iv) Speed: 34 CourtInt. J. Environ. Res. Public Health 2020, 17, x 3 of 12
Int. J. Environ. Res. Public Health 2020, 17, 7355 3 of 10
running Max Vert (RVJ). (iv) Speed: ¾ Court Sprint (¾ CS), time to sprint over the distance of three
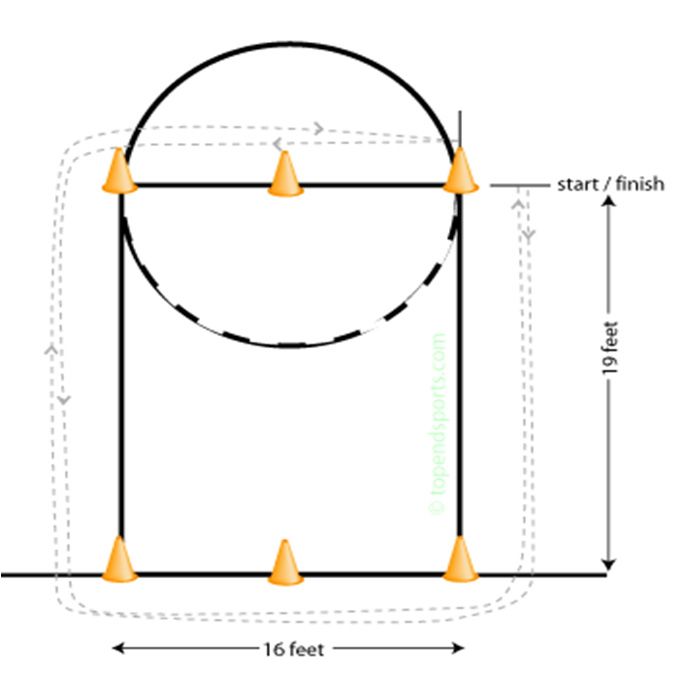
quarters of the court is measured in seconds; (v) Agility: Lane Agility Drill (LAD), starting from the
Sprint ( 34 CS), time to sprint over the distance of three quarters of the court is measured in seconds;
left corner of the free-throw line, with one foot behind the line, no rocking movement allowed. Run
(v) Agility: Lane Agility Drill (LAD), starting from the left corner of the free-throw line, with one foot
forwards to the baseline. At the cone, change movement to a side shuffle, and move sideways to the
behind the line, no rocking movement allowed. Run forwards to the baseline. At the cone, change
right across the baseline. At the next cone back pedal up the lane to the foul line, then side shuffle left
movement to a side shuffle, and move sideways to the right across the baseline. At the next cone back
back towards the start line. Here the subject touches the floor at a point even with the starting cone,
pedal up the lane to the foul line, then side shuffle left back towards the start line. Here the subject
then reverses direction to return back around the course to complete another revolution. First side
touches the floor at a point even with the starting cone, then reverses direction to return back around
shuffle right, forward sprint, side shuffle left then back pedal to complete the test. Remain facing
the course to complete another revolution. First side shuffle right, forward sprint, side shuffle left
forwards towards the baseline throughout the test. Two trials are allowed (Figure 1); vi) Agility:
then back pedal to complete the test. Remain facing forwards towards the baseline throughout the
Reactive Shuttle Run (RSR), the player starts in the middle of the key and runs to each side of the key
test. Two trials are allowed (Figure 1); (vi) Agility: Reactive Shuttle Run (RSR), the player starts in the
before returning to the center (Figure 1).
middle of the key and runs to each side of the key before returning to the center (Figure 1).
a b
Figure 1. Lane Agility Drill (a) and Reactive Shuttle Run test description (b).
Moreover, performance of the rookie year was measured through game related statistics: points
Figure 1. Lane Agility Drill (a) and Reactive Shuttle Run test description (b).
scored, one-, two- and three-point field-goals attempted, converted and percentage, defensive and
offensive rebounds,
Moreover, assists, turnovers,
performance steals,
of the rookie blocks
year was and fouls. through
measured Draft position was also
game related collected
statistics: points
from 1 to 60 (first and second round). Players were classified into backcourt players and
scored, one-, two- and three-point field-goals attempted, converted and percentage, defensive and frontcourt
players, according
offensive to theassists,
rebounds, information available
turnovers, at blocks
steals, the moment in theDraft
and fouls. draftposition
(accessedwas
in September 2019).
also collected from
Variables measured in inches and pounds were converted into cm and kg manually.
1 to 60 (first and second round). Players were classified into backcourt players and frontcourt players,
according to the information available at the moment in the draft (accessed in September 2019).
2.3. Statistical Analysis
Variables measured in inches and pounds were converted into cm and kg manually.
First, a descriptive analysis with mean and standard deviation was carried out for different player
2.3. Statistical
positions, frontcourt Analysis
and backcourt, in order to characterize the sample. In all the variables the number
of players was noted, as not all players were evaluated in all variables. In second place, a regression
First, a descriptive analysis with mean and standard deviation was carried out for different
analysis was carried out. Combine variables, anthropometric and agility/strength variables were
player positions, frontcourt and backcourt, in order to characterize the sample. In all the variables the
analyzed to explore their effect on draft position. The model is as follows:
number of players was noted, as not all players were evaluated in all variables. In second place, a
regression analysis was carried out. Combine variables, anthropometric and agility/strength
DP = β1 + β2 × H + β3 × W + β4 × WS + β5 × SR + β6 × BFAT + β7 × HL + β8 × HW +
variables were analyzed to explore their effect on draft position. The model is as follows:
β9 × Str + β10 × VJ + β11 × RVJ + β12 × 43 CS + β13 × LAD + β14 × RSR + εi
DP = β1 + β2 x H + β3 x W + β4 x WS + β5 x SR + β6 x BFAT + β7 x HL + β8 x HW +
The Durbin-Watson
β9 x Str test
+ β10was used
x VJ to check
+ β11 x RVJ whether
+ β12 x ¾theCSresiduals in the+ model
+ β13 x LAD were+ independent
β14 x RSR εi
and look within the data for controlling collinearity effects. Finally, a correlation analysis was performed
Therelationships
to identify Durbin-Watson test was
among: used to check
(i) Combine whether theand
anthropometric residuals
strengthin the
andmodel
agilitywere independent
measures and
game performance through game related statistics; and (ii) the draft position and game performancewas
and look within the data for controlling collinearity effects. Finally, a correlation analysis
performed
using Pearson’s to correlation
identify relationships
coefficients.among: (i) Combine
Statistical anthropometric
significance and strength
of Pearson’s correlation and agility
coefficients
measures
depend and game
on sample size,performance through
so effect sizes game related
of correlations werestatistics;
reportedand (ii) theofdraft
because position
varied sampleand game
size,
performance using Pearson´s correlation coefficients. Statistical significance of Pearson´s correlation
and Cohen’s effect size criteria for correlation coefficients was used to interpret it (small: |r| = 0.10–0.29,
coefficients depend on sample size, so effect sizes of correlations were reported because of variedInt. J. Environ. Res. Public Health 2020, 17, 7355 4 of 10
medium: |r| = 0.30–0.49, and large: |r| = 0.50 [20]. The analyses were performed using IBM SPSS
software v. 22 (IBM Corp., Armonk, NY, USA), and the significance level was set at p < 0.05.
3. Results
In the first place, descriptive statistics are shown in Table 1. Results show how frontcourt players
achieved higher values in anthropometric variables, whereas backcourt players scored more than
frontcourt players in strength and agility, with the exception of the bench press.
Table 1. Descriptive statistics (M and SD) of the NBA Combine according to player’s position.
Frontcourt Backcourt
Combine Measures
N M SD N M SD
Body fat 222 8.51 3.21 403 6.54 1.83
Hand Length 136 9.08 0.38 245 8.56 0.38
Hand Width 136 9.71 0.71 245 9.20 0.59
Height 262 2.08 0.04 457 1.94 0.07
Weight 262 108.76 8.51 456 91.59 7.82
Wingspan 263 2.20 0.06 457 2.08 0.12
Lane Agility Drill 223 11.67 0.56 406 11.15 0.67
Reactive Shuttle Run 58 3.11 0.18 131 3.06 0.16
3 225 3.35 0.13 409 3.23 0.10
4 Court Sprint
Standard vertical jump 227 28.67 2.87 411 30.14 2.87
Running Max Vert 227 32.98 3.07 410 35.87 3.38
Bench Press 198 12.03 5.19 345 9.73 4.81
Table 2 presents the regression analysis results. Durbin-Watson values in both regressions are near
to 2, meaning that data are independent. Only two variables in each regression achieved significant
values. Hand width and height in frontcourt players, and standard vertical jump and running vertical
jump in backcourt players. All β-values are negative, but standard vertical jump. Negative values
mean that, if the variable increase, the draft position is better. Whereas the standard vertical jump
increase, the draft position also increases.
Results for correlation analysis between game related statistics and combine test are presented
in one table. Variables with correlation coefficients higher than |0.20| are shown. Table 3 shows
the relationship in frontcourt and backcourt players. Whereas many correlations have been found,
only two relationships are considered medium (Int. J. Environ. Res. Public Health 2020, 17, 7355 5 of 10
Table 2. Effects of Combine test on overall draft position according to playing positions.
Frontcourt Backcourt
Combine Measures Non- Standardized Coefficients Standardized Coefficients Non- Standardized Coefficients Standardized Coefficients
B Standard error Beta t Sig. B Standard error Beta t Sig.
(Constant) 568.85 227.87 2,49 0.02 28.79 110,60 0.26 0.79
Body fat −0.89 1.29 −0.16 −0.69 0.49 0.05 1.31 0.00 0.04 0.96
Hand Length −4.28 8.37 −0.11 −0.51 0.61 0.16 6.08 0.00 0.02 0.97
Hand Width −8.71 4.46 −0.40 −1.95 0.06 1.18 3.64 0.04 0.32 0.74
Height −170.25 79.064 −0.49 −2.13 0.04 −19.00 41.67 −0.08 −0.45 0.65
Weight 0.27 0.54 0.13 0.51 0.61 0.32 0.45 0.14 0.71 0.47
Wingspan 43.04 46.30 0.22 0.93 0.36 −26.96 23.71 −0.17 −1.13 0.25
Lane Agility Drill −1.33 6.43 −0.05 −0.20 0.83 0.19 1.48 0.01 0.13 0.89
Reactive Shuttle Run 5.89 18.89 0.08 0.31 0.75 16.33 10.65 0.18 1.53 0.13
3 −19.03 26.55 −0.17 −0.71 0.48 7.72 21.00 0.05 0.36 0.71
4 Court Sprint
Standard vertical jump −1.18 1.67 −0.25 −0.70 0.48 2.36 1.25 0.43 1.89 0.06
Running Max Vert −2.40 1.81 −0.54 −1.32 0.20 −2.64 1.00 −0.59 −2.64 0.01
Bench Press 0.36 0.67 0.11 0.54 0.59 0.22 0.42 0.07 0.51 0.60
Dependent variable: draft. In bold: p > 0.05.Int. J. Environ. Res. Public Health 2020, 17, 7355 6 of 10
Table 3. Pearson correlation coefficients between COMBINE measures and game performance indicators in Frontcourt and Backcourt players (r value and (n)).
Fouls Fouls
Frontcourt Draft Points FG Made FG Tried 3PFG Made 3PFG Tried FTm FT Tried OFF REB DEF REB Assists TO STLs BLK
Committed Received
−0.137 −0.01 −0.153 * −0.163 * 0.03 0.07 0.01 0.368
Wingspan −0.01 (243) −0.04 (243) 0.05 (243) 0.09 (243) 0.05 (243) −0.10 (243) 0.09 (243) 0.06 (243)
* (263) (243) (243) (243) (243) (243) (243) ** (243)
Reactive Shuttle 0.316 * −0.10 −0.16 −0.310 −0.19 −0.10
−0.08 (54) −0.08 (54) 0.00 (54) −0.01 (54) −0.14 (54) −0.06 (54) −0.18 (54) −0.26 (54) −0.25 (54) −0.14 (54)
Run (58) (54) (54) * (54) (54) (54)
Backcourt
−0.126 −0.10 −0.09 0.178 ** −0.267 ** −0.156 0.02 0.182
Hand Length −0.09 (230) −0.11 (230) −0.10 (230) −0.10 (230) −0.07 (230) 0.12 (230) 0.05 (230) −0.06 (230)
* (245) (230) (230) (230) (230) * (230) (230) ** (230)
−0.07 −0.123 −0.112 * −0.135 ** −0.139 ** −0.146 ** −0.117 0.237 ** −0.416 ** −0.263 −0.148 0.293 −0.124 *
Height −0.09 (418) 0.120 * (418) −0.05 (418)
(457) * (418) (418) (418) (418) (418) * (418) (418) (418) ** (418) ** (418) ** (418) (418)
−0.105 0.01 0.04 0.280 ** 0.214 ** −0.270 ** −0.128 −0.03 0.269
Weight 0.01 (417) −0.01 (417) −0.05 (417) −0.05 (417) 0.07 (417) 0.07 (417) 0.01 (417)
* (456) (417) (417) (417) (417) (417) ** (417) (417) ** (417)
−0.07 −0.05 −0.114 * −0.105 * −0.01 0.259 ** 0.135 ** −0.269 ** −0.127 −0.04 0.237
Wingspan −0.04 (418) −0.06 (418) 0.02 (418) 0.02 (418) −0.04 (418)
(457) (418) (418) (418) (418) (418) (418) (418) ** (418) (418) ** (418)
−0.10 0.101 * 0.123 * 0.09 0.07 0.03
Running Max Vert 0.10 (374) 0.09 (374) 0.03 (374) 0.05 (374) 0.121 * (374) 0.00 (374) 0.08 (374) 0.07 (374) 0.06 (374) 0.09 (374)
(410) (374) (374) (374) (374) (374)
* p > 0.05; ** p > 0.01; In bold: p > 0.05 for a better identification.Int. J. Environ. Res. Public Health 2020, 17, 7355 7 of 10
Finally, Table 4 presents the relationship between draft position and game performance
indicators. All game performance indicators are negatively correlated with draft position in all
players, and frontcourt and backcourt players separately. These results indicated that the better the
draft position (nearer to 1), the higher the scores in all game performance indicators. Points, Field-Goals
made and Field-goals tried are strongly related to draft position ( 0.05; ** p > 0.01.
4. Discussion
Results show that the Combine tests, with the exception of hand width and height in frontcourt
players and standard vertical jump and running vertical jump in backcourt players, do not predict
draft position. Future performance indicators were explained by several Combine tests in all
players. Specifically, stronger relationships were wingspan with blocks and shuttle run with draft in
frontcourt players; and between height with assists and blocks in backcourt players. In recent years,
few studies have examined the validity of the NBA Draft Combine to identify and select young talented
players [17,18]. To the best of our knowledge, this is the first study to examine combine measures with
performance indicators in depth, analyzing all data raw. The purpose of this investigation was to
identify the Combine tests that explain draft position and future performance in the NBA rookie season.
Some studies have accounted for the importance of accurate assessment of players for NBA teams.
This is crucial to make the best draft election [18] or be conscious of specific demands of different
players’ positions [17]. In addition, as the NBA is the most important basketball competition in the
world, the findings offer teams and organizations a deeper understanding of talent identification for
future performance [1].
Some studies have attempted to identify and classify the efficacy of different Draft Combines,
(NBA, NFL and NHL) in predicting future performance in the sport. The NFL Combine has identified
those tests and measures that successfully predict performance in different playing positions [1].
These identifications were in the positions that are most dependent on speed and agility, which is what
Combine assesses. In fact, the authors stated that the Combine does not measure those factors that are
important for success. In the NBA Combine, differences in anthropometric characteristics and physical
fitness ability were found between drafted and non-drafted players [17]. Also, specific measures were
useful for being selected as guards (leg power) and power forwards and centers (agility and speed).Int. J. Environ. Res. Public Health 2020, 17, 7355 8 of 10
One study in basketball stated that the Draft Combine has value for predicting future players’
performance [18]. This study reduces all measures to three components: length-size, power-quickness,
and upper-body strength. Also, on-court performance was a calculation of different metrics (Player
Efficiency Rating, Offensive Win Shares, Defensive Win Shares, Win Shares, Win Shares Per 48 min,
Offensive Box Plus/Minus, Defensive Box Plus/Minus, Box Plus/Minus, and Value Over Replacement
Player) and almost all are based on team performance. This study finds that the Draft Combine predicts
future performance in the first year and three years when variables were grouped.
It has been stated, that beyond anthropometric and fitness variables, there are other factors that
have an important prediction power on future performance. Mulholand and Jensen [21] described
“football intelligence” as the ability to learn offensive schemes, memorize routes or recognize patterns
in the defense to attack or catch passes. McGee et al. [1], establish that quickness to react and the
ability to read the offense is fundamental in football, as well as an athlete’s determination, toughness,
and ability to work as part of a team. In basketball players, these variables are even more important
than in football. Players are in continuous interaction with teammates and opposing players in chaotic
interactions and unexpected contexts [22]. None of the Combine measures challenge players to find
contextual information and choose the accurate solution for each game situation [23,24]. The NBA
Draft Combine performance measurements only measure physical capabilities.
In fact, some of the measurements of the Combine are correlated with each other. Power
measurements are highly correlated with speed assessment [1,16]. According to this information,
it seems that lane agility drill, reactive shuttle run, 34 court sprint, standard vertical jump and running
vertical jump are measuring the same ability. In this respect, the Combine measurements are not sport
specific, they are general and common tests used to assess physical condition in basketball [25]. It is
necessary to choose specific tests for each sport modality and position that are related to the sport and
report specific results with greater validity [26–28].
Other studies have attempted to identify the key components and variables that players and
coaches have to development to reach a high performance in basketball [29]. This study collects
information from professional coaches and international basketball players (among other experts) and
states that it is the interaction of a multitude of social, biological and psychological factors that lead
to best performance. In fact, other studies have identified 12 factors that contribute to the success of
Olympic champions in the U.S. [30,31]. Saénz-López et al., [29] pointed out that the environmental
factors are the most important to reach high level performance, followed by psychological, tactical
and technical factors. Finally, this sample of experts identified anthropometry and physical condition,
as the two factors that the Combine tries to measure.
Some of the reasons for NBA teams to not choose players according to the results of these test
could be: (i) the belief that these physical skills can be taught; (ii) the training effect: there are players
that prepare these specific tasks in order to perform better on the test day [1]. On the other hand,
on-field performance in college is likely the strongest predictor of success in the NFL [32]. In basketball,
similar findings have been presented. Scoring performances in the NCAA tournament are related
to draft placement and the probability of being drafted [33]. So, the question is why is the Combine
anthropometric and power-agility test conducted in its current state?
5. Conclusions
From the results of the current study, it is suggested that battery tests have to be modified,
including measures that are sport specific. In addition, other attributes and characteristics of players,
such as psychological factors or mental strength, have to be measures along with college on-field
performance indicators. The Draft Combine costs a lot of money, and teams send scouts and coaches
to the event in order to get better knowledge of the possibly drafted players. Moreover, physical
condition seems not to be the key factor to advance to the next level. Tactical and technical level
or on field performance receive much attention during the NCAA season. It could be important to
measure other factors in the Combine that are not as evident as those, such as mental preparation,Int. J. Environ. Res. Public Health 2020, 17, 7355 9 of 10
game intelligence, and others for which tools for measurement are available. As practical applications,
other sports should design their own Combine tests according to game demands and specifications of
different player positions and functions. In basketball, teams and technical staff have to eliminate all
the paraphernalia of the Combine, and focus on what is important for their organizations, along with
on-court performance.
6. Limitations
There are limitations to this study to take into consideration. It is a secondary analysis of data
not directly collected by the authors so it was impossible to test validity measures and collection
technique. The correlations model is presented with a large number of relationships, and several
spurious findings are shown, but only those with medium effects are commented on. The existence of
a high number of significant but spurious correlations could explain the little importance given to the
measurements in the NBA teams draft elections. However, the study has used data available from
20 years, strengthening the validity of the present findings.
7. Future Research
In future research other variables have to be included, such as the Combine shooting test,
and advanced statistics (e.g., offensive rating, defensive rating, net rating, assist to turnover ratio,
effective field goal percentage, player impact estimate, and more).
Author Contributions: Conceptualization, J.G.-R.; Data curation, D.C.; Formal analysis, J.G.-R., D.C. and S.J.I.
Funding acquisition, S.J.I.; Methodology, J.G.-R.; Resources, S.F. and S.J.I.; Software, J.G.-R. and D.C.; Validation,
J.G.-R.; Visualization, J.G.-R. Writing—original draft, J.G.-R. and D.C. Writing—review & editing, S.F., A.A. and
S.J.I. All authors have read and agreed to the published version of the manuscript.
Funding: This study has been partially subsidized by the Regional Government of Extremadura (Ministry of
Economy and Infrastructure); with the contribution of the European Union through the FEDER (GR18170).
Conflicts of Interest: The authors declare no conflict of interest.
References
1. McGee, K.J.; Burkett, L.N. The National Football League combine: A reliable predictor of draft status?
J. Strength Cond. Res. 2003, 17, 6–11. [CrossRef] [PubMed]
2. Köklü, Y.; Alemdaroğlu, U.; Koçak, F.; Erol, A.; Fındıkoğlu, G. Comparison of chosen physical fitness
characteristics of Turkish professional basketball players by division and playing position. J. Hum. Kinet
2011, 30, 99–106. [CrossRef] [PubMed]
3. Apostolidis, N.; Emmanouil, Z. The influence of the anthropometric characteristics and handgrip strength
on the technical skills of young basketball players. J. Phys. Educ. Sport 2015, 15, 330–337.
4. Hoffman, J. Norms for Fitness, Performance, and Health; Human Kinetics: Champaign, IL, USA, 2006.
5. Groothuis, P.A.; Hill, J.R.; Perri, T. The dilemma of choosing talent: Michael Jordans are hard to find.
Appl. Econ. 2009, 41, 3193–3198. [CrossRef]
6. Mayhew, J.; Piper, F.; Schwegler, T.; Ball, T. Contributions of speed, agility and body composition to anaerobic
power measurement in college football players. J. Strength Cond. Res. 1989, 3, 101–106.
7. Ibáñez, S.J.; Mazo, A.; Nascimento, J.; García-Rubio, J. The Relative Age Effect in under-18 basketball: Effects
on performance according to playing position. PLoS ONE 2008, 13, e0200408. [CrossRef]
8. Perez-Toledano, M.A.; Rodriguez, F.J.; Garcia-Rubio, J.; Ibáñez, S.J. Players’ selection for basketball
teams, through Performance Index Rating, using multiobjective evolutionary algorithms. PLoS ONE
2019, 14, e0221258. [CrossRef]
9. Mancha-Triguero, D.; García-Rubio, J.; Antúnez, A.; Ibáñez, S.J. Physical and Physiological Profiles of Aerobic
and Anaerobic Capacities in Young Basketball Players. Int. J. Environ. Res. Public Health 2020, 17, 1409.
[CrossRef]
10. Triguero, D.M.; García-Rubio, J.; Ibáñez, S.J. Batería de test de campo para evaluar la condición física de
jugadores de baloncesto: SBAFIT. EBM RECIDE 2019, 15, 107–126.Int. J. Environ. Res. Public Health 2020, 17, 7355 10 of 10
11. Vaquera, A.; Santos, S.; Villa, J.G.; Morante, J.C.; García-Tormo, V. Anthropometric characteristics of Spanish
professional basketball players. J. Hum. Kinet. 2015, 46, 99–106. [CrossRef]
12. Teramoto, M.; Cross, C.L.; Willick, S.E. Predictive value of NFL scouting combine on future performance of
running backs and wide receivers. J. Strength Cond. Res. 2016, 30, 1379–1390. [CrossRef] [PubMed]
13. Kuzmits, F.; Adams, A. The NFL combine: Does it predict performance in the National Football League?
J. Strength Cond. Res. 2008, 22, 1721–1727. [CrossRef] [PubMed]
14. Fry, A.; Kraemer, W. Physical performance characteristics of American collegiate football players. J. Strength
Cond. Res. 1991, 5, 126–138.
15. Chiarlitti, N.A.; Delisle-Houde, P.; Reid, R.E.; Kennedy, C.; Andersen, R.E. Importance of body composition
in the national hockey league combine physiological assessments. J. Strength Cond. Res. 2018, 32, 3135–3142.
[CrossRef]
16. Robbins, D.W. The National Football League (NFL) combine: Does normalized data better predict performance
in the NFL draft? J. Strength Cond. Res. 2010, 24, 2888–2899. [CrossRef]
17. Cui, Y.; Liu, F.; Bao, D.; Liu, H.; Zhang, S.; Gómez, M.Á. Key Anthropometric and Physical Determinants for
Different Playing Positions During National Basketball Association Draft Combine Test. Front. Psychol. 2019,
10, 2359. [CrossRef]
18. Teramoto, M.; Cross, C.L.; Rieger, R.H.; Maak, T.G.; Willick, S.E. Predictive validity of national basketball
association draft combine on future performance. J. Strength Cond. Res. 2018, 32, 396–408. [CrossRef]
19. Draft Combine. Available online: http://stats.nba.com/draft/combine (accessed on 18 April 2018).
20. Cohen, J.W. Statistical Power Analysis for the Behavioral Sciences; Lawrence Erlbaum Associates: Hillsdale, NJ,
USA, 1988.
21. Mulholland, J.; Jensen, S.T. Predicting the draft and career success of tight ends in the National Football
League. J. Quant. Anal. Sports 2014, 10, 381–396. [CrossRef]
22. Grehaigne, J.-F.; Bouthier, D.; David, B. Dynamic-system analysis of opponent relationships in collective
actions in soccer. J. Sports Sci. 1997, 15, 137–149. [CrossRef]
23. Glazier, P.S. Game, set and match? Substantive issues and future directions in performance analysis. Sports
Med. 2010, 40, 625–634. [CrossRef]
24. García-Rubio, J.; Gómez, M.Á.; Cañadas, M.; Ibáñez, J.S. Offensive Rating-Time coordination dynamics in
basketball. Complex systems theory applied to Basketball. Int. J. Perform. Anal. Sport 2015, 15, 513–526.
25. Mancha-Triguero, D.; Garcia-Rubio, J.; González-Calleja, J.; Ibanez, S.J. Physical fitness in basketball players:
A systematic review. J. Sports Med. Phys. Fit. 2019, 59, 1513–1525. [CrossRef] [PubMed]
26. Salinero, J.J.; González-Millán, C.; Vicente, D.R.; Vicén, J.A.; García-Aparicio, A.; Rodríguez-Cabrero, M.;
Cruz, A. Valoración de la condición física y técnica en futbolistas jóvenes. Int. J. Med. Sci. Phys. Act. Sport
2013, 13, 401–418.
27. Vincent, L.M.; Blissmer, B.J.; Hatfield, D.L. National Scouting Combine Scores as Performance Predictors in
the National Football League. J. Strength Cond. Res. 2019, 33, 104–111. [CrossRef] [PubMed]
28. Robbins, D.W.; Goodale, T. Evaluation of the physical test battery implemented at the National Football
League Combine. Strength Cond. J. 2012, 34, 1–10. [CrossRef]
29. Sáenz-López, P.; Ibáñez, S.J.; Giménez, J.; Sierra, A.; Sánchez, M. Multifactor characteristics in the process of
development of the male expert basketball player in Spain. Int. J. Sport Psychol. 2005, 36, 151–171.
30. Gould, D.; Dieffenbach, K.; Moffatt, A. Psychological characteristics and their development in Olympic
champions. J. Appl. Sport Psychol. 2002, 14, 172–204. [CrossRef]
31. Durand-Bush, N.; Salmela, J.H. The development and maintenance of expert athletic performance: Perceptions
of world and Olympic champions. J. Appl. Sport Psychol. 2002, 14, 154–171. [CrossRef]
32. Lyons, B.D.; Hoffman, B.J.; Michel, J.W.; Williams, K.J. On the predictive efficiency of past performance and
physical ability: The case of the National Football League. Hum. Perform. 2011, 24, 158–172. [CrossRef]
33. Thomas, C. March Madness in June: An Analysis of the NCAA Tournament and its Impact on the NBA
Draft from 2004–2008. Ph.D. Thesis, Haverford College, Haverford, PA, USA, 2009.
© 2020 by the authors. Licensee MDPI, Basel, Switzerland. This article is an open access
article distributed under the terms and conditions of the Creative Commons Attribution
(CC BY) license (http://creativecommons.org/licenses/by/4.0/).You can also read