Machine Learning Based Network Coverage Guidance System
←
→
Page content transcription
If your browser does not render page correctly, please read the page content below
Machine Learning Based Network Coverage Guidance System

                                         Srikanth Chandar, Muvazima Mansoor, Mohina Ahmadi, Hrishikesh Badve, Deepesh Sahoo, Bharath Katragadda1

                                           Abstract—With the advent of 4G, there has been a huge                    In this paper, a unique approach to resolve the problems
                                         consumption of data and the availability of mobile networks has         faced by the MNOs (identification of areas with weak signal
                                         become paramount. Also, with the burst of network traffic based         strengths), as well as the problems faced by end-users (weak
                                         on user consumption, data availability and network anomalies
                                         have increased substantially. In this paper, we introduce a             signal strengths), is presented. With the help of a mobile
                                         novel approach, to identify the regions that have poor network          application, network strength densities across a region are
                                         connectivity thereby providing feedback to both the service             identified and 360-degree feedback on network conditions to
                                         providers to improve the coverage as well as to the customers to        both MNOs and end customers is provided. The solution
                                         choose the network judiciously. In addition to this, the solution       presented in this paper enables the end-user to navigate to
                                         enables customers to navigate to a better mobile network cov-
                                         erage area with stronger signal strength location using Machine         a location with a stronger mobile network and also provides a
                                         Learning Clustering Algorithms, whilst deploying it as a Mobile         dynamic visual representation of varying network strength and
arXiv:2010.13190v1 [cs.LG] 25 Oct 2020

                                         Application. It also provides a dynamic visual representation of        range across nearby geographical areas. The dynamic visual
                                         varying network strength and range across nearby geographical           representation of varying network strength is provided for the
                                         areas.                                                                  different kinds of MNOs that operate in a region. This enables
                                           Index Terms—4G, Mobile Network, Machine Learning, Mobile
                                         Application, Network Strength, Unsupervised Learning, RSSI              the user to judiciously switch to an MNO with more uniform
                                                                                                                 signal connectivity and also provides the MNOs a comparative
                                                              I. INTRODUCTION                                    view of the signal strengths of their competition.

                                            The growing demand for mobile network connectivity as-                                   II. R ELATED W ORKS
                                         sociated with increased smartphone ownership, greater mobile               Parallels can be drawn between this paper and the work
                                         usage indoors and higher data rates are driving the evolution           done in Opensignal[1], in terms of deploying network strength-
                                         of mobile networks. Due to the annual increase in the number            based heat-maps. The means of deploying heat-maps in
                                         of cellular subscribers and the increase in competition with            Opensignal is one through a meticulous process of data
                                         other network operators, there is a growing interest by the             collection and averaging. It deals with collecting billions of
                                         network operators to maximize the deployment of the network             individual measurements every day, from over 100 million
                                         infrastructure to achieve maximum coverage. The definition              devices worldwide, per day. In addition to reaching such
                                         of network infrastructure is not only limited to electronic             extensive limits of data collection, there exists a dependency
                                         components of the network but also the passive elements                 on partner applications to collect said data, which aids the
                                         such as physical sites and towers that are required to operate          data collecting venture. An averaging metric is then applied
                                         the network. While the cellular subscribers do not directly             onto this vast database, to produce heat-maps pertaining to a
                                         perceive the composition or the configuration of the infras-            geographical location, and of a particular MNO. While this
                                         tructure, the throughput and latency of the mobile network              may be accurate owing to the sheer quantity of data collected,
                                         infrastructure determine the user experience and therefore the          using a clustering model to attribute new data into pre-defined
                                         network infrastructure and its deployment have been one of the          clusters and periodically updating the cluster metric itself,
                                         key challenges faced by Mobile Network Operators (MNOs).                will definitely reduce complexity and be cheaper. Using such
                                         Since network coverage is of utmost importance to the MNOs,             algorithms to fill in the blanks of the existing vast geography
                                         one would expect the users to have a seamless experience with           may be more efficient than trying to get every location’s detail,
                                         strong uniform network connectivity. However, this is not the           which essentially amounts to a brute force method. Another
                                         case. The network coverage distribution in tall structures /large       outlook is to use such algorithms on existing vast databases-
                                         buildings is inconsistent and significant variations in signal          such as the ones in Opensignals- which may be further added
                                         strengths exist. With the increase in dependency on network             to accuracy while reducing complexity and cost.
                                         connectivity and the need for high network speeds, the lack
                                         of consistent and strong signal strength is a growing concern.                         III. PROBLEM STATEMENT
                                                                                                                 A. Poor Network Connectivity
                                           1 Third-yearB-Tech ECE students, PES University, Outer Ring Rd, Ba-
                                         nashankari 3rd Stage, Banashankari, Bengaluru, Karnataka 560085            The mobile network user faces the issue of poor internet
                                          Srikanth.chandar@gmail.com,                                            connectivity multiple times in a day, in a particular area, due
                                         muvazima99@gmail.com, mohina1729@gmail.com,                             to various reasons – most of which are due to external factors
                                         hrishi.badve11@gmail.com,
                                         deepeshsahoo99@gmail.com,                                               such as physical obstruction, multiple reflections due to water
                                         ashubharath99@gmail.com,                                                bodies or tank chambers, weather at the given instant, etc. But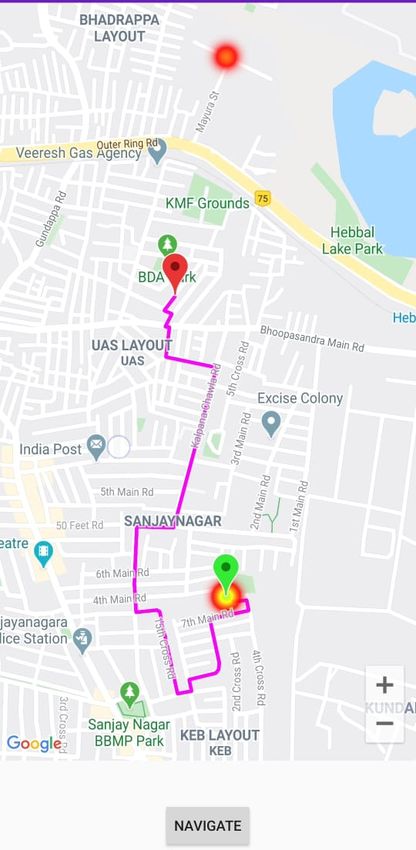
more often than not, this network strength magnitude is not        respective network strength of that cluster. The clustering
constant over an area; it is not even constant across the same     model accuracy increases as more UEs start consuming the
building. There are points in the building where there is an       RSSI mapping service and generate data to build the clustering
evident increase in network strength. If there were a tangible     model. Currently, a window of 10 seconds is used to generate
way to deduce such geographical locations and direct the           the data. Once the model is built and if the UEs fall under
user towards the same, much of today’s day to day network-         a lower network connectivity area, they are directed to the
related issues could be solved to a good extent, with ease. For    nearest location, belonging to a region with a stronger network,
instance, by directing the user to a window, from inside a lift.   computed based on optimization algorithms using RSSI of the
                                                                   UEs. The UE is then directed to this new stronger network
B. Telecommunication companies
                                                                   area, using traditional navigation modules. From a user’s
   Acquiring sites for the deployment of network infrastructure    perspective, this framework could serve as an advantageous
has become very difficult due to network densification to          alternative to current day extant methods which predominantly
address demands in indoor environments. Due to closely             use a trial and error approach, to compare network signal
spaced buildings, there is very little space for indoor base       strengths. On the other hand, the data collected could prove
stations to be installed. Furthermore, multiple mobile operators   useful to the Network Service providers, as it provides an
have to compete for the same few sites. The comparative            insight into the continuous gradient of signal strength, across
data of signal strengths of all Mobile Network Operators in        an area. This could help in better frequency planning and cell
a particular area could help the telecommunication companies       site deployment upgrades. It can also provide strategic insight
to judiciously deploy network infrastructure or participate in     into the exact location where a signal tower can be installed,
infrastructure sharing.                                            in such a way that it is beneficial to the maximum number of
                   IV. H IGH L EVEL S OLUTION                      weak network clusters, thereby optimizing cost.
                                                                                     V. D ETAILED S OLUTION
                                                                     The proposed framework can be divided into 3 phases-
                                                                     • Data Collection and Storage
                                                                     • Cloud Clustering Model
                                                                     • Heat map, Nearest Strong Network Area Navigation

                                                                   A. Data Collection and Storage phase
                                                                      The front end mobile application updates network and
                                                                   geographic-specific details from the user, every 10 seconds.
                                                                   This process runs as a Background Service, while simultane-
                                                                   ously storing this data into Google-Firebase[2]. The Firebase
                                                                   Realtime Database is a NoSQL cloud-based database that
                                                                   syncs data across all clients in real-time and provides offline
                                                                   functionality. Data is stored in the Real-time database as
                                                                   JavaScript Object Notation (JSON), and all connected clients
                                                                   share one instance, automatically receiving updates with the
                                                                   newest data[2].
                                                                      1) Geographic Location: The user’s precise geographical
                                                                   location is determined by collecting the latitude and the
         Fig. 1.   High-Level Heat map Architecture Diagram        longitude of the device. This data is collected using the
                                                                   FusedLocationProviderApi[3]. Fused Location Provider gives
   This white paper proposes a solution to the above-mentioned     accurate locations, and optimizes the battery usage. It com-
problems, by using an interactive mobile application front that    bines signals from GPS, Wi-Fi, cell networks, as well as an
would cater to the user and the user’s geographical area’s         accelerometer, gyroscope, magnetometer, and other sensors to
network problems; while simultaneously building the database       provide accurate results. It can demarcate various spots within
in the back end, which could provide greater insight into          a building or a household.
larger signal network problems as a whole. The solution is            2) Network Strength: The effective network strength of the
a mix of data engineering, vector quantization algorithms,         device is a metric of the LTE RSSI data. The carrier RSSI
heat maps, geographical area identifications to partition User     measures the average total received power in the measurement
Endpoints (UEs) based on - geographical location, Long-Term        bandwidth over N resource blocks, in decibels. The total
Evolution Received Signal Strength Indicator (LTE RSSI) and        received power of the carrier RSSI includes the power from
Mobile Network Operator (MNO). The vector quantization             co-channel serving and non-serving cells, adjacent channel
approach generates clusters and each cluster is associated         interference, thermal noise, etc. It is totally measured over 12-
with an integer tag, thereby normalizing and denoting the          sub carriers including Received Signal (RS) from Serving Cell
and Traffic in the Serving Cell. The module used to collect is a provider of wireless communications services that owns
the RSSI data is getAllCellInfo() method under the class or controls all the elements necessary to provide services to an
TelephonyManager[4]. It requests all available cell information end-user including radio spectrum allocation, wireless network
from all radios on the device including the camped/registered, infrastructure, backhaul infrastructure, billing, customer care,
serving, and neighboring cells. The response can include provisioning computer systems, and marketing and repair or-
one or more CellInfoGsm, CellInfoCdma, CellInfoTdscdma, ganizations. This information helps segment users based on the
CellInfoLte, and CellInfoWcdma objects, in any combination. MNO they use, which further helps in the clustering models
Refer Table I. discussed later. The getSimOperatorName method under the
class TelephonyManager is used to collect this information.
OBJECT FIELD DESCRIPTION 4) Unique Identity: Every data set collected from the user
Indicates whether needs to be distinguishable from another user’s- this is to avoid
the cell is being multiple data entry from the same device in a short period
used or would be when it does not provide new information. It also helps track
CellInfoLte- mRegistered the data associated with the device, while moving. The Internet
used for signalling
Immutable cell Protocol (IP) address provides this information, as it is unique
communication if
information to a user over a network at a given point of time. The modules
necessary.
from a point used to collect this are InetAddress and NetworkInterface[5].
To determine the
in time.
mTimeStamp recency of
B. Cloud Clustering Model
CellInfo data.
mCellConne Determines the 1) K- Means Clustering: K Means algorithm[6] is an
-ction Status connection status iterative vector quantization algorithm that partitions the data
MCI 28 bit cell identity set into K predefined distinct non-overlapping subgroups (clus-
MPCI Physical cell ID ters) where each data point belongs to only one group. It makes
16 bit tracking the intra-cluster data points as similar as possible while also
MTAC keeping the clusters as different (far) as possible. Data points
CellIdentityLte- area code
to represent a 18 bit absolute RF are assigned to a cluster such that the sum of the squared
MRFNC distance between the data points and the cluster’s centroid
unique LTE cell channel number
Cell Bandwidth (arithmetic mean of all the data points that belong to that
mBandwidth cluster) is at the minimum. The lesser the variation within
in KHz
Mobile country clusters, the more homogeneous (similar) the data points are
mMCC within the same cluster. The reasons for the popularity of k-
code
Mobile network means are ease and simplicity of implementation, scalability,
mMNC speed of convergence, and adaptability to sparse data.
code
Network carrier The way K means algorithm works in this project is as
mAlphaLong follows:
name
Network carrier • Specify number of clusters K (5)
mAlphaShort • Initialize centroids by shuffling data set and randomly
name
Received Signal selecting K data points for the centroids without replace-
RSSI ment, with the dimensions being Latitude, Longitude, and
Strength Indication
Reference SIgnal RSSI strength.
CellSignalStrength RSRP • Iterate until there is no change to the centroids. i.e.
Received Power
Lte-LTE signal assignment of data points to clusters does not change.
Reference SIgnal
strength related RSRQ • Compute sum of the squared distance between data points
Received Quality
information. and all centroids.
Reference Signal
RSSNR Signal to Noise • Assign each data point to the closest cluster (centroid)
Ratio and attribute a normalized network strength integer tag
Channel Quality (0-5)
CQI • Compute the centroids for the clusters by averaging all
Indicator
TA Timing Advance data points that belong to each cluster.
Level of signal The approach K means follows to solve the problem is called
LEVEL
strength Expectation-Maximization. The E-step is assigning the data
OPLEVEL Output Level points to the closest cluster. The M-step is computing the
TABLE I. Description of getAllCellInfo() fields centroid of each cluster. The objective function is:
m K
3) Network Service Provider: The Network Service 2
J=∑ ∑ wik x i − µk (1)
Provider- more formally known as Mobile Network Operator- i=1 k=1where wik = 1 for data point x if it belongs to cluster k; substantial changes in network details or heat maps, which
otherwise, wik = 0. uk is the centroid of xi ’s cluster. have to be updated via the clustering model.
It is a minimization problem of two parts. First J w.r.t. wik
C. Heat map, Nearest Strong Network Area Navigation
is minimized treating uk as a constant. Then J w.r.t. uk is
minimized treating wik constant. Therefore E step is: 1) Heat map and Nearest Strong Network Detection: The
updated database, which contains the geographical location
∂J m K
2 associated with a network strength in the form of normalized
= ∑ ∑ xi − µk tags is presented to the user as a heat map of network strengths.
∂ wik i=1 k=1
( (2) This helps in providing a dynamic visual representation of
2
1 if k = argmin j xi − µ j varying network strength and range across nearby geographical
⇒ wik =
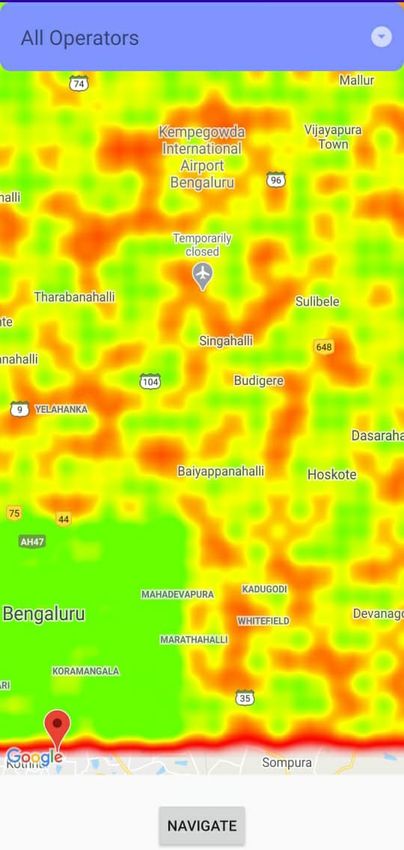
0 otherwise. areas, centered around the user. Fig.2 is the heat map of
Bangalore generated using sample values of signal strength
In other words, assign the data point xi to the closest cluster for illustration purposes.
judged by its sum of squared distance from cluster’s centroid.
M-step is:
m
∂J
= 2 ∑ wik xi − µk =0
∂ µk i=1
(3)
∑m
i=1 wik x
i
⇒ µk = m
∑i=1 wik
Which translates to recomputing the centroid of each cluster
to reflect the new assignments.
1 mk i 2
∑ x − µck
mk i=1
(4)
2) Deployment as Cloud Service : Once the clustering
model is functional and accurately models new user data
to one of the clusters, it is to be deployed as a cloud
service that can run in the back end. It should also update
the database with the predicted/clustered mapping of users
across areas. The updated database will then be used for the
navigation modules discussed later. The output of the model
will be the cluster predictions denoted by integer tag, along
with the geographical locations. The service is hosted using
Google Virtual-Machine[7] (VM) Instance. A virtual machine
is a software that acts as an interface between a computer
program that has been compiled into instructions understood
by the virtual machine and the microprocessor (or “hardware
platform”) that actually performs the program’s instructions.
A Terminal Multiplexer (TMUX[8]) session is initialized to
allow multiple terminal accessibilities, which is facilitated by
the VM instance, using the Secure Shell (SSH[9]). TMUX
is a protocol that allows multiple short transport segments, Fig. 2. Heat map of Bangalore using sample data for illustration purpose
independent of application type, to be combined between a
server and host pair. The Secure Shell (SSH) Protocol is a The database is analyzed with a click of a button “Find
protocol for secure remote login and other secure network Nearest Strong Network”; to find the 3 most optimal nearest
services over an insecure network[9]. A Cron-Job[10] is used stronger network locations to the user, in a 100m radius.
to schedule the service to run as a task every 15 minutes. The user then can choose the one location which is most
Essentially, the clustering on all data- including the latest data comfortable to reach.
that was collected at a 10s interval- is modeled, and the output 2) Navigation: Given the user’s real-time location, and
is updated onto the database. This ensures that the changes in the location of the nearest optimal stronger network location
the heat map or the general tendencies of variations are always (corresponding to a higher tag integer, than the one associated
mapped. The 15-minute buffer is optimal- as this is too low a with the user’s location), a walkable route can then be traced
period for massive network property changes to occur, and at to reach from one point to the other. This is done using
the same time gives a sufficient threshold to account for small predefined Application Programming Interfaces (API), such asDirection and Routes[11] API, provided by Google. In Fig.3, useful for MNOs looking to increase their connectivity and
the red marker represents the user’s current location and the quality.
green marker represents the closest location at which the signal
ACKNOWLEDGMENT
strength is the strongest. The red marker gets updated when
there is a change in the user’s current location. We would like to thank Mr. Karthik Natarajan for mentoring
us. Without his valuable knowledge and expertise, this would
not have been possible. We would also like to thank Prof. M
Rajasekar (PES University) for providing us this opportunity
and for his continuous support. We extend our thanks to PES
University, who provided us a platform that helped us to team
up and pursue this project.
R EFERENCES
[1] H. Khatri, “India mobile network experience report,” online at:
https://www.opensignal.com/reports/2020/04/india/mobile-network-
experience, 2020.
[2] L. Moroney, Moroney, and Anglin, Definitive Guide to Firebase.
Springer, 2017.
[3] B. R. Prakash and S. S. Kulkarni, “Navigation technology to meet new
people using fused location api,” in 2019 3rd International Conference
on Computing and Communications Technologies (ICCCT). IEEE,
2019, pp. 63–67.
[4] J. Chen and D. Advocate, “An introduction to android,” Google I/O,
2008.
[5] M. Daniele, B. Haberman, S. Routhier, and J. Schoenwaelder, “Textual
conventions for internet network addresses,” Nework Working Group,
pp. 1–16, 2000.
[6] O. Oyelade, O. O. Oladipupo, and I. Obagbuwa, “Application of k means
clustering algorithm for prediction of students academic performance,”
arXiv preprint arXiv:1002.2425, 2010.
[7] H. Sexton, D. Unietis, M. Jungerman, S. Meyer, and D. Rosenberg,
“Using a virtual machine instance as the basic unit of user execution in
a server environment,” Feb. 10 2009, uS Patent 7,490,330.
[8] P. Cameron, D. Crocker, D. Cohen, and J. Postel, RFC1692: Transport
Multiplexing Protocol (TMux). RFC Editor, 1994.
[9] T. Ylonen, C. Lonvick et al., “The secure shell (ssh) protocol architec-
ture,” 2006.
[10] M. S. Keller, “Take command: cron: Job scheduler,” Linux Journal, vol.
1999, no. 65es, pp. 15–es, 1999.
[11] F. Wang and Y. Xu, “Estimating o–d travel time matrix by google
maps api: implementation, advantages, and implications,” Annals of GIS,
vol. 17, no. 4, pp. 199–209, 2011.
Fig. 3. Navigating a user to the nearest green zone [12] C.-F. Tsai and C.-Y. Sung, “Dbscale: An efficient density-based clus-
tering algorithm for data mining in large databases,” in 2010 Sec-
ond Pacific-Asia Conference on Circuits, Communications and System,
VI. CONCLUSIONS vol. 1. IEEE, 2010, pp. 98–101.
[13] H.-P. Kriegel, P. Kröger, J. Sander, and A. Zimek, “Density-based clus-
A novel approach, to navigate to better mobile network tering,” Wiley Interdisciplinary Reviews: Data Mining and Knowledge
coverage area with stronger signal strength using Machine Discovery, vol. 1, no. 3, pp. 231–240, 2011.
Learning Clustering Algorithms while deploying it as a Mobile
Application has been discussed and tested. This paper helps in
understanding the technicalities involved in collecting relevant
data using a mobile application, storing them on a real-time
database, Firebase, and using a cloud service to cluster the
data using the K-means algorithm. The Mobile Application
provides a dynamic visual representation of varying network
strength and range across nearby geographical areas, centered
around the user and also guides the user to a location with
the strongest signal strength. There is a lot of scope for future
work. Analyses beyond heat-map and navigation map can be
done with the data collected, to determine the density of the
population that resides in low signal strength areas, using
DBSCALE[12]. Future work extends to areas of implementing
the same idea but by using DENCLUE[13] as the clustering
model instead of K-Means-Clustering. This could prove to beYou can also read