Leveraging core strengths to help shape the future of energy - Capital Markets Day
←
→
Page content transcription
If your browser does not render page correctly, please read the page content below
Leveraging core strengths to help shape the future of energy

Capital Markets Day
11 February 2021

Forward-looking Statements

    All statements in this presentation other than statements of historical fact, are forward-looking
    statements, which are subject to a number of risks, uncertainties, and assumptions that are difficult
    to predict and are based upon assumptions as to future events that may not prove accurate. These
    factors include TGS’ reliance on a cyclical industry and principal customers, TGS’ ability to continue
    to expand markets for licensing of data, and TGS’ ability to acquire and process data products at
    costs commensurate with profitability. Actual results may differ materially from those expected or
    projected in the forward-looking statements. TGS undertakes no responsibility or obligation to update
    or alter forward-looking statements for any reason.

See the energy at

TGS.com                                                -2-
Agenda

                    Time CET    Presentation
                    1400-1410   Introduction
                    1410-1430   Presentation of Q4 2020 and 2021 guidance
                    1430-1445   Market outlook
                    1445-1500   Strategic priorities
                    1500-1520   New Energy Solutions
                    1520-1535   Sustainability strategy
                    1535-1600   Summary and Q&A

See the energy at

TGS.com                                                -3-
Presentation Team

                    Kristian Johansen   Fredrik Amundsen     Jan Schoolmeesters   Tanya Herwanger
                    CEO                 CFO                  EVP Operations       EVP Staff & Support

See the energy at

TGS.com                                                    -4-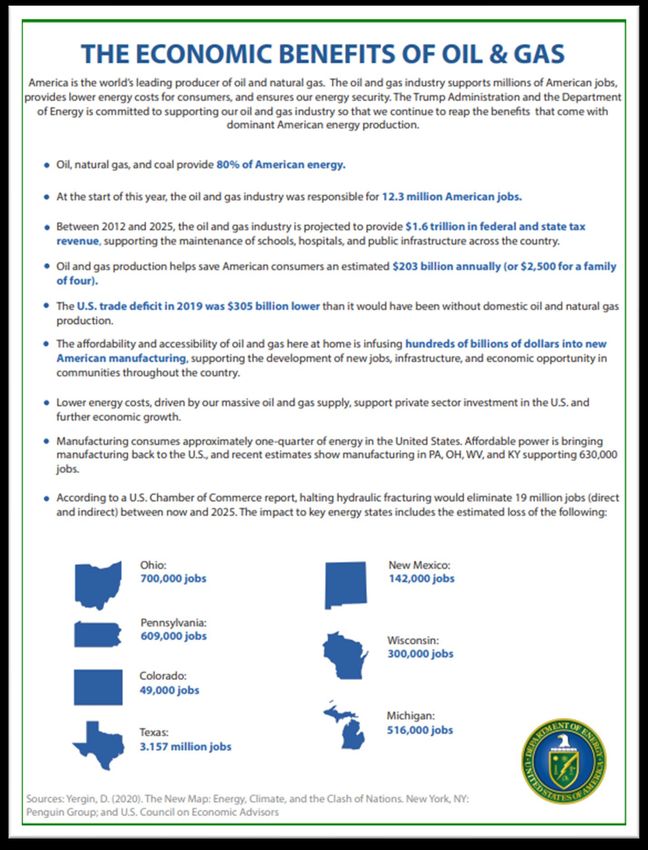
Introduction
Kristian Johansen, CEO

Market Volatility Since Capital Markets Day 2019
                    80

                    70

                    60

                    50

                    40

                    30

                    20

                    10

                    0

                         Oil price back to pre-COVID levels
See the energy at

TGS.com                                   -6-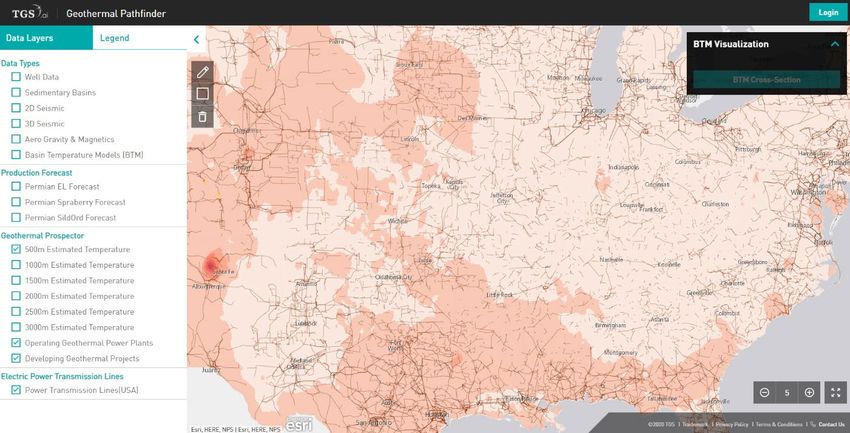
Delivering on the Strategic Agenda, Despite Market Disruption
           Strategic priorities as presented in CMD Feb 2019              Progress and achievements as of Feb 2021

                                New technologies in mature basins          ~11,000 km2 of modern OBN acquired in GoM and NCS
               O&G data

                                                                           Acquisition of Spectrum and ~60,000 km2 new 3D acquired
                              Strengthening position in South Atlantic
                                                                           in Latin America

                                      Further growth onshore               All-time high onshore late sales in 2019 before market collapse

                                                                           New analytics application added (> Million ARLAS) and instrumental
                            Expand value chain through Data & Analytics
               Technology

                                                                           in the development of unique marketplace for seismic in 2020

                                                                           New management, high grading of technologies, imaging closer to
                                   Imaging quality and reputation
                                                                           infrastructure

                    Feb 2019                                                                                                   Feb 2021

See the energy at

TGS.com                                                                     -7-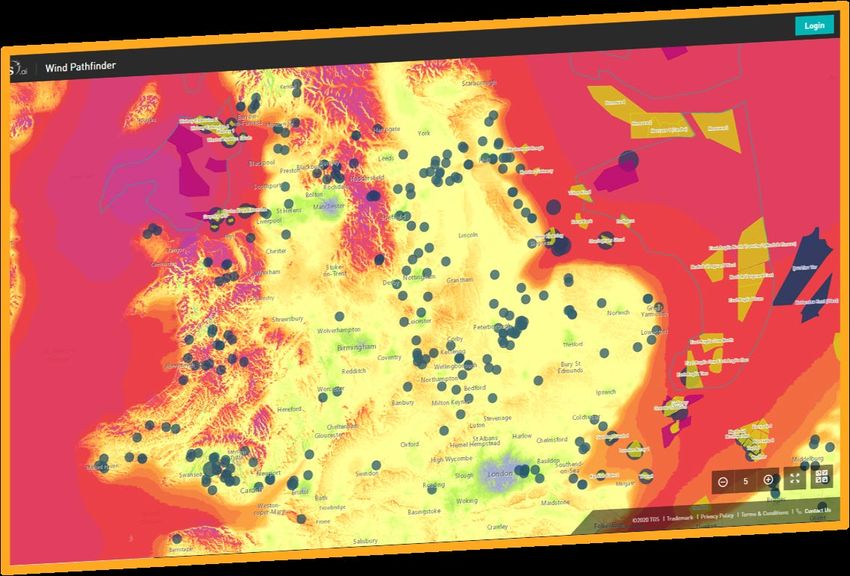
Q4 2020 Results and 2021 Guidance
Fredrik Amundsen, CFO
IFRS 15
            • The accounting standard IFRS 15 regarding revenue recognition implemented
              from 1 January 2018
            • Implications for TGS
                    • Recognition of revenues related to multi-client projects postponed until projects are delivered
                      to customers
                    • No amortization until completion of the project
                    • No impact on sales from the library of completed surveys
            • Internal reporting
                    • TGS will continue to use the previous percentage-of-completion-method for internal segment
                      and management reporting (referred to as Segment Reporting)
                    • Provides the best picture of the performance and value creation of the business
            • External reporting
                    • Two sets of accounts: Segment Reporting and IFRS Reporting
                    • Main focus in external communication will be on Segment Reporting

See the energy at

TGS.com                                                              -9-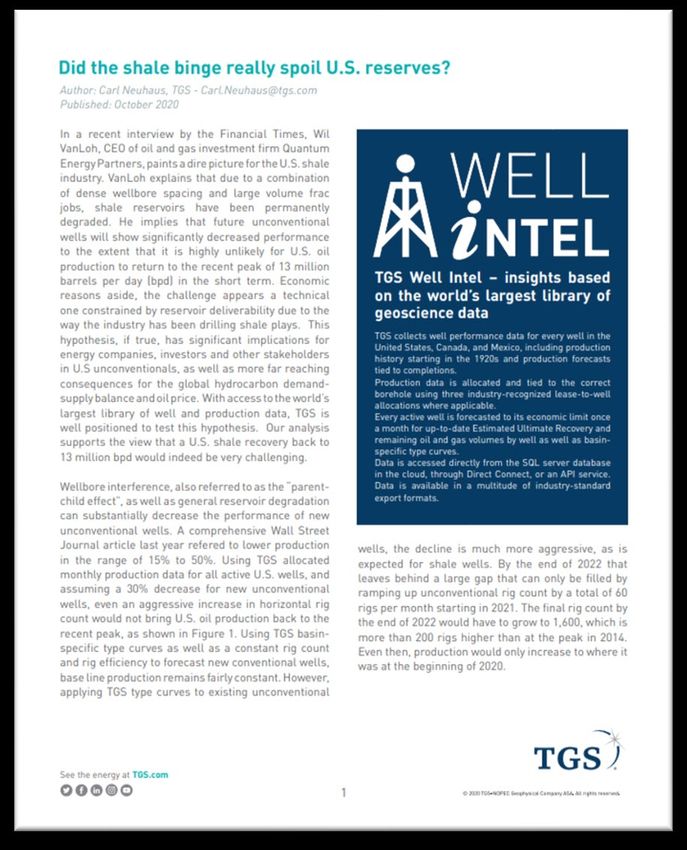
Highlights

    • Q4 2020 net revenues of USD 120.3 million
             • Late sales USD 103.2 million
             • Pre-funding USD 13.3 million

    • Costs and capex re-set to reflect challenging market conditions
             • Personnel and Other operational costs down 58% y/y
             • Forward run-rate reduced ~40-45% compared to 2019 pro-forma

    • Increasing return to shareholders
             • Q4 2020 Free cash flow of USD 28.4 million
             • Quarterly dividend increased to USD 0.14 per share
             • Launching USD 20 million in share buy-back program

    • 2021 financial guidance
             • Multi-client investments of approximately USD 200-230 million
             • Continued sector outperformance on cash flow and ROACE
             • Industry-leading distribution to shareholders

See the energy at

TGS.com                                                                  - 10 -
Net Revenues Pro-forma including SPU See the energy at TGS.com - 11 -
Operating Expenses, EBIT, MC Investments
 Pro-forma including SPU

        1.    Personnel costs and other operating expenses excluding reported non-recurring items

         2.    Earnings before interest and taxes excluding reported non-recurring items

See the energy at

TGS.com                                                                                             - 12 -
Income Statement Segment reporting See the energy at TGS.com - 13 -
Balance Sheet
 Segment reporting

See the energy at

TGS.com              - 14 -
Cash Flow Statement
 Segment reporting

See the energy at

TGS.com                - 15 -
2020 Operational Highlights
 Investment Distribution                                                  • Investment profile highly influenced by
                                                                            high backlog entering 2020
                                                     EUR                  • Activity quickly scaled back due to
                                                      8%                    COVID market impact – reducing
                                                                            investment guidance from USD 450
                                                                            million to USD 300 million
                    Onshore & WDP                                         • Cash cost base reduced with 58%
                                                                            comparing Q4 2020 with Q4 2019
                           23%
                                                                          Investments by quarter:
                                    NA
                                                                           50%

                                    17%
                                                                           40%

                                                                           30%

                                                                           20%

                                                               AMEAP
                                                                           10%
                                          LA
                                                                    10%
                                                                            0%
                                                                                   Q1       Q2      Q3       Q4

                                               42%

See the energy at

TGS.com                                                    - 16 -
2021 Market Outlook Impacted by Uncertainty
E&P’s have guided flat to negative spending
Higher political risk (e.g. US pausing of federal O&G leasing)
80
60
Positive momentum in oil price
40
20
0
Production from onstream fields
Vaccines are showing results
See the energy at
TGS.com - 17 -Backlog
1. Sales committed by customers but not yet recognized in the Segment Reporting accounts
See the energy at
TGS.com - 18 -2021 Operational Guidance
Investment Distribution • Investment plan for 2021 is flexible and
diversified
EUR • Backlog of USD 89 million in prefunding
largely relate to the 2021 investment plan
15% • The current cash cost provides flexibility
to increase activity as COVID restrictions
Onshore & WDP are lifted, and still be below USD 25
million per quarter
15%
Investments by quarter:
NA
25%
40%
30%
20%
AMEAP
LA 10%
15% 0%
Q1 Q2 Q3 Q4
30%
See the energy at
TGS.com - 19 -Business Model with Counter-Cyclical Qualities
• Lean and adjustable cost base
800
• Asset-light – few capital
commitments
• Allows for continued dividend
500
payments even during down-cycles
Financial Guidance:
200 • Multi-client investments of between
USD 200 - 230 million
• Continued sector outperformance
-100
2015 2016 2017 2018 2019 2020 2021
on cash flow and ROACE
FCF Cash Inflow Cash Outflow • Industry-leading distribution to
shareholders
See the energy at
TGS.com - 20 -Dividends and Share Buyback
• The Board has resolved to increase the dividend to USD 0.14 per share in Q1 2021
• Ex date 18 February 2021 – payment date 4 March 2021
• In addition, the Board has authorized a USD 20 million share buyback program to be completed by May 2022 subject to
renewal of the authorization given by the annual general meeting May 2020
1. Quarterly dividends defined in USD from 2016. Annual dividends defined in NOK prior to 2016, converted to USD with the FX rate at ex-dividend dates
See the energy at
TGS.com - 21 -Summary
• Q4 2020 net revenues of USD 120.3 million
• Late sales USD 103.2 million
• Pre-funding USD 13.3 million
• Costs and capex re-set to reflect challenging market conditions
• Personnel and Other operational costs down 58% y/y
• Forward run-rate reduced ~40-45% compared to 2019 pro-forma
• Increasing return to shareholders
• Q4 2020 Free cash flow of USD 28.4 million
• Quarterly dividend increased to USD 0.14 per share
• Launching USD 20 million in share buy-back program
• 2021 financial guidance
• Multi-client investments of approximately USD 200-230 million
• Continued sector outperformance on cash flow and ROACE
• Industry-leading distribution to shareholders
See the energy at
TGS.com - 22 -Market Outlook Kristian Johansen, CEO
A Volatile Ride
                                                        Brent oil price and EBITDA
                               100

                                90

                                80

                                70

                                60
                     USD/bbl

                                50

                                40

                                30

                                20

                                10     2016      2017               2018             2019   2020

                                       363       409                517              646    354
                                 0                                                                 EBITDA in million USD
                                                                                                   according to segment
                                                                                                   reporting

                    Source: EIA, TGS

                                              Oil price back to pre-COVID levels
See the energy at

TGS.com                                                              - 24 -
Supply Shortage in the Making TGS Well Intel
13 790 rigs
U.S. Oil Production
12 790 rigs
[mmbpd]
380 rigs
11
1.5
12.8
10
11.1 380 rigs
9
10.0
8
Jan 2020 Jan 2021 Dec 2021 Sources: TGS Well
Performance Data,
Baker Hughes
No increase in rig count Rig count increase +42 rigs per month
• High decline rates on U.S. unconventional wells
• TGS research indicates that returning to Jan 2020 numbers is unlikely even
with aggressive ramp up of rig count and no parent/child interference
• Supply shortage in the making will drive up oil price and E&P capex
• Biden environmental agenda could exacerbate situation
See the energy at
TGS.com - 25 -US Pausing of New Oil and Gas Leases
• Oil and gas high importance for US economy and labor market
• GoM production compares well on emission intensity compared to
other basins
Source: Wood Mackenzie
Source: US Department of Energy
See the energy at
TGS.com - 26 -US Pausing of New Oil and Gas Leases
• GoM exploration trends “If conditions in the U.S. become so onerous that it
• Shift from frontier to infrastructure-led really disincentivizes investment, we've got other
exploration places where we can take those dollars.”
• Licensing rounds less important Mike Wirth, CEO, Chevron
• More focus on technology 4Q20 Earnings Conference Call
29 January 2020
• Potential consequences of permanent ban
NBV multi-client library
• More active asset transfer market
US federal
• Re-allocation of funds from US to other basins land and
waters
• Positive oil price implications
17%
• TGS exposure to US federal land and waters
• 17% of multi-client library
• Mostly Ocean Bottom Node data
• 19% of 2020 net revenues
See the energy at
TGS.com - 27 -Oil and Gas to Remain Important in the Long-term
Share of Primary Energy consumption
60%
• Oil and gas to remain an important part of the
energy mix in the foreseeable future
50%
40%
30%
• Declining consumption of oil to be partly offset
by relative stability of gas demand
20%
10%
0%
• Strong growth in renewables to replace coal in
the long-term
Oil and gas Renewables
Solid curves = Sustainable Development Scenario (SDS): Designed to meet the energy-related UN’s Sustainable Development Goals to achieve: universal access to affordable, reliable and modern energy services by 2030;
a substantial reduction in air pollution, and effective action to combat climate change. The SDS is fully aligned with the Paris Agreement to hold the rise in global average temperature to “well below 2 °C and pursuing efforts to
limit it to 1.5 °C”.
Stapled curves = Stated Policies Scenario (STEPS): It incorporates IEA’s assessment of stated policy ambitions, including the energy components of announced stimulus or recovery packages (as of mid-2020) and the
Nationally Determined Contributions under the Paris Agreement. This scenario assumes that the pandemic is brought under control over the course of 2021.
Source: IEA
See the energy at
TGS.com - 28 -How to Cover Gap Between Supply from Onstream Fields and Future Demand?
Oil and gas
200,000
Incremental supply needed to meet ETO scenario
150,000
Gap to be covered by:
1,000 boe/day
• Fields currently under development
100,000 Incremental supply needed to meet AET-2 scenario • Discoveries in the pre-FID stage
• Exploration
50,000
Production from onstream fields
0
2020 2021 2022 2023 2024 2025 2026 2027 2028 2029 2030 2031 2032 2033 2034 2035 2036 2037 2038 2039 2040
Wood Mackenzie scenario description:
• The energy transition outlook (ETO) represents Wood Mackenzie’s base case view of the energy world, broadly consistent with a 3°C global warming view.
• The accelerated energy transition 2-degree scenario (AET-2) represents how the world can augment efforts towards deep decarbonization with a credible pathway to
reach a 2°C global warming trajectory by 2050.
Source: Wood Mackenzie
See the energy at
TGS.com - 29 -Exploration a Competitive Alternative
Average point-forward cost of gas supply
• Significant share of proven undeveloped resources is
unlikely to be developed Pre-FID gas
• Best resources already developed
• Increasing cost Gas under development
• Environmentally challenging Onstream gas incremental
• High political and regulatory risk
• Remote areas Gas exploration
Proven developed gas
• Exploration in prolific basins is competitive with other 0 5 10
Average point-forward cost (USD/boe)
15
sources of incremental production
• Proven exploration plays
“[…]Exploration’s costs are competitive because
• Declining cycle time alternatives have higher development costs.
• More and better use of technology Explorers, on average, tend to find better resources
through exploration than the legacy assets that still
await development.”
• Strong outlook for a viable exploration market in the
long-term, even in the more optimistic energy Exploration’s future in a low-cost, low-carbon world
transition scenarios Wood Mackenzie, June 2020
See the energy at
Source: Wood Mackenzie
TGS.com - 30 -Strong Growth in Renewable Energy
Primary consumption renewables
3 000
2 500
SDS
CAGR 10.1%
2 000
Mtoe
1 500
1 000
STEPS
CAGR 7.4%
500
-
2019
2020
2021
2022
2023
2024
2025
2026
2027
2028
2029
2030
2031
2032
2033
2034
2035
2036
2037
2038
2039
2040
Source: IEA
• Strong growth in renewable energy needed to replace energy
sources with higher GHG emissions
• Average annual investments in renewables must be 20 times
higher in the coming 20-year period compared to the past 5-
year period to meet the SDS scenario
See the energy at
TGS.com - 31 -CCS Important Enabler for the Energy
Transition
Investments CCS
30,000
25,000
CAGR 6.5%
20,000
USD bn (2019)
15,000
10,000
5,000
0
2000-09 2010-19 2020-30*
*Projects at an advanced stage of planning for 2020-30
Source: IEA
• Strong growth in Carbon Capture and Storage (CCS) is a
pre-requisite for meeting the goals of the Paris Agreement
• Several projects in advanced planning stage – long pipeline
of potential additional projects around the world
See the energy at
TGS.com - 32 -Summary: Key Energy Market Trends
• International Oil Companies (IOCs) concentrating
exploration efforts on fewer basins
• National Oil Companies (NOCs) becoming more
important in international exploration
• Continued focus on Infrastructure-Led Exploration (ILX)
• Digitization driving efficiency improvements in
exploration and production
• Strong growth in energy transition enablers
See the energy at
TGS.com - 33 -Strategic Priorities Kristian Johansen, CEO
Strategic Priorities

                                                              New technologies in mature basins

                                        O&G data
                                                            Strengthening position in South Atlantic

                    As presented                                    Further growth onshore
                    at 2019 CMD

                                                         Expand value chain through Data & Analytics
                                        Technology

                                                                Imaging quality and reputation

                                                     Capitalize on data library to create exploration upside
                                      businesses
                                       New data

                    New initiatives
                                                     Data offering towards other energy related industries

See the energy at

TGS.com                                                                  - 35 -
Leveraging Library to Create Exploration Upside
• International oil companies focusing exploration Current ORRI positions in the Gulf of Mexico
efforts on fewer areas – leave gaps that may be filled
by smaller oil companies
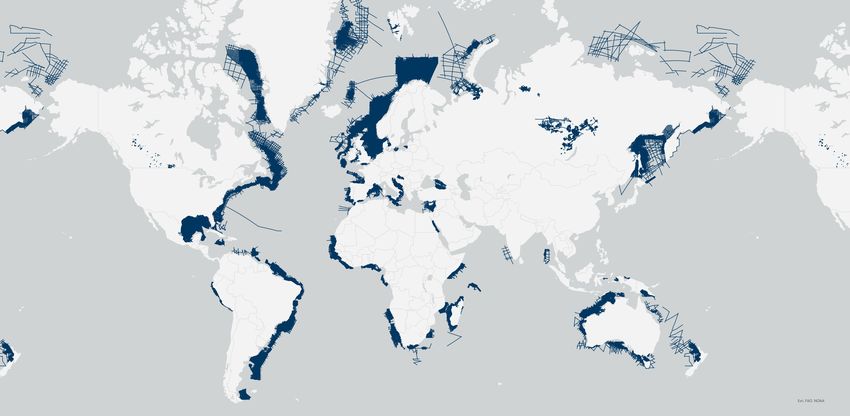
• The largest subsurface data library in the world
combined with leading geoscience competency puts
TGS in a unique position to support exploration
opportunities
• Capital light approach – using existing data and
competencies
• Data-for-equity swaps
• Overriding Royalty Interest deals (ORRIs)
• Direct ownership in exploration acreage – but only in
pre-drilling phase
• Limited use of cash
• No direct exposure towards drilling or production
See the energy at
TGS.com - 36 -Building on Core Skillsets to Support Energy Transition
• Establish business unit – New Energy
Solutions – to capitalize on energy transition
trends through data and insights
• Leveraging existing data and core
competencies to build broad offering to support
decision making processes
• Carbon Capture and Storage (CCS)
• Deep Sea Mineral exploration (DSM)
• Renewable energy
• Geothermal
• Wind
• Solar
See the energy at
TGS.com - 37 -Organizing to Deliver on Strategy
TGS ASA
Oil and Gas Insights (OGI) New Energy Solutions (NES)
New technologies in mature basins Data offering towards other energy related industries
Strengthening position in South Atlantic
Capitalize on data library to create exploration upside
Data Imaging
Imaging quality and reputation
Data Analytics
Expand value chain through Data & Analytics
Staff & Support
See the energy at
TGS.com - 38 -Leveraging core strengths to help shape the future of energy
New Energy Solutions
Jan Schoolmeesters, EVP Operations & NES
New Energy Solutions
 From Data to Insights

     • Energy transition requires massive investments in
       industries that contribute to removing GHG emissions

     • Capital intensity combined with long pay-back requires
       high precision in investment decisions

     • Providing a path from data to insights creates
       significant value

     • TGS leveraging core skillsets to help shape the future
       of energy by facilitating for more informed and better
       investment decisions

See the energy at

TGS.com                                                 - 41 -
Leveraging Core Strengths
• Data library
• World’s largest integrated subsurface data library
• Geoscience skills
• Leading geoscience environment
• Strong understanding of the subsurface
• Digitalization
• Data processing competency
• High-performance computing capacity
• Data analytics and software development skills
• Cloud-based solutions
• Data management
• Structuring and handling of large data volumes
• Data capturing
• Collecting unique and exclusive data using different
technologies
• Collecting and improving public data
• Global presence
• 40 years of experience working in international markets
• Data covering basins across the globe
See the energy at
TGS.com - 42 -The New Energy Solutions Offering
Products and Services development
Carbon Storage Geothermal Deep Sea Minerals Wind Solar
Imaging Technology Integrated Data
Well Intelligence Services
Imaging Technology Project
Site Screening Site Assessment Development
Heat Assessment
Integrated Seabed Remote Sensing
Subsurface Storage
Solutions Remote Sensing
Monitoring Energy Output
Monitoring Forecasting
NES ECOSYSTEM
News, Insights, Analysis
See the energy at
TGS.com - 43 -From Data to Insights - Geothermal Application Example
Assessing Geothermal Energy Potential with Analytics Ready Well Data
Unique Temperature
Data
Novel Modelling
Technology
TGS Data
Site Screening
Unmatched Amount and Investment
of Data Decision Support
Economic
Forecasting
Public
Infrastructure
• Volumetric estimates of geothermal energy resource
Intelligence
• Assessment of O&G wells for geothermal energy co-production
• Geothermal Energy Recovery Factor
• Converting thermal energy in place to electricity generation potential
See the energy at
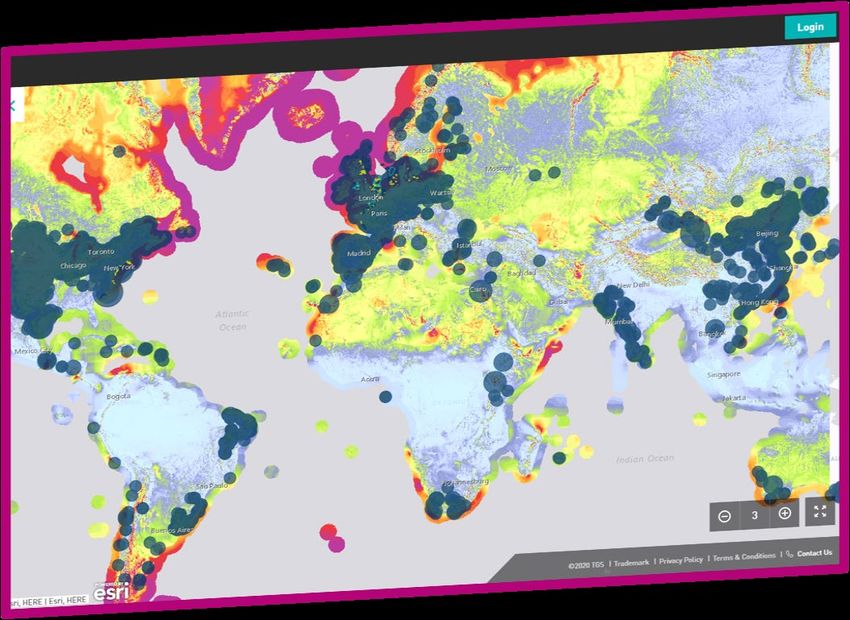
TGS.com - 44 -From Data to Insights – CCS Application Example
Explore relationships between GHG
emitters and potential CCS hubs in
the area, leading to an improved
understanding of storage
opportunities and economics.
Key Attributes:
• Worldwide Coverage
• Existing & planned CCS Hubs and main Emitters
• Regional mapping and subsurface intelligence
• Bespoke high resolution 3D data for CCS players
• Key well data and interpreted products
• Fully de risked CCS hubs for existing and future clients
See the energy at
TGS.com - 45 -From Data to Insights – Wind Application Example
Explore relationships between wind
resources and wind farm specifics,
leading to an improved understanding
of the energy output potential.
Key Attributes:
• Worldwide Coverage
• 12,000 windfarms
• 5,000 offshore wind turbines
• 200 active offshore windfarm areas, operator or
co-operator information
• 100 potential future windfarm areas
• Key metadata integrated from TGS NES news service
• Free access to basic information
See the energy at
TGS.com - 46 -The NES Ecosystem – Our Delivery Platform
Data input Data lake Apps Use cases
TGS data TGS apps Site screening
Public data Structured Partner apps Concept evaluation
Contextualized
Partner data Analytics ready Customer apps Investment decisions
Customer data 3rd party apps Financing
• An industry portal of comprehensive new energy data
• Supporting our client’s digital transformation and energy transition goals
• E-commerce enables subscription services
See the energy at
TGS.com - 47 -A Path to Growth
Organic Growth
• Solid base for expanding data and insights solutions
• Recruitment of subject matter experts in renewables
Partnerships
• Building momentum with companies in all segments, including platform
and application development
Inorganic Growth
• Identifying value add companies
• High potential to fast-track growth for Wind and Solar
See the energy at
TGS.com - 48 -Summary and Way Forward
Existing subsurface product offering has significant potential to
accelerate in growing new energy markets
Core strengths in combining data, AI and compute power enables
fast development and commercialization of products and services
On track for organic growth, to be supplemented by partnerships
and M&A
See the energy at
TGS.com - 49 -Sustainability Strategy Tanya Herwanger, EVP Staff & Support
Helping to Shape a Sustainable Future

               We believe it is our responsibility to help our
               customers, shareholders and communities in
               which we live and work to shape a sustainable
               energy future.

See the energy at

TGS.com                                                          - 51 -
What We have Accomplished
Set targeted goals Allocated resources Acted
• Carbon Emissions • Executive ownership & • Improved reporting &
• Gender Diversity oversight transparency
• Employee Engagement • New ESG function • Adopted carbon neutral
• Senior Leader assigned solutions in our data centers
• Human Rights
• Building a team • Strengthened our supplier
• Supplier Management management
• Integrating ESG in • Published our commitment
investment decisions to Human Rights
• Advocating for industry
standards to measure &
report emissions from field
operations
See the energy at
TGS.com - 52 -What We Plan To Do
Focus Build Lead
• Climate Change • Work toward carbon • Incorporate emissions
neutrality by 2030 analysis into project
• Diversity & Inclusion (scope 1 & 2) investment decisions
• Health & Safety • Expand our commitment • Drive the advancement of
ESG standards in the
• Reporting to public initiatives seismic sector
• Strengthen our policies • Track, report and promote
and practices to deliver on environmental efficiencies
commitments in marine and land
operations
See the energy at
TGS.com - 53 -Recognition & Momentum
2020 ESG STATE STREET GLOBAL
Report Card ADVISORS
58 R-FACTOR RATING
C
Top 10-
30% We remain above industry
average
BLOOMBERG
GENDER
A-
THE
CDP SCORE
EQUALITY INDEX
ISS CORP. SOLUTIONS We remain above 1 of 3 Norwegian
industry average companies; 1 of 18
GOVERNANCE 1,4,3 Governance: 1
Energy companies
GROUP Environment: 4
included in the
Social: 3
Index
The group rates the
top 100 companies
on the Oslo Bors
on their
sustainability filings S&P GLOBAL CSA
A MSCI ESG RATING 73% Top 5 within industry group for
second year in a row
See the energy at
TGS.com - 54 -Summary CEO, Kristian Johansen
Different Cycles – Different Priorities

1,000
                                                                 CAGR +1%
 900

 800

 700

 600

 500

 400

 300

 200

 100

   0
          2003         2004      2005    2006      2007   2008   2009   2010       2011     2012      2013   2014   2015   2016    2017   2018     2019     2020    2021E
                                                                          Net revenues    MC investments

                              Growth and returns                   Counter-          Growth and market share        Costs and cash flow       Capital          Costs,
                                                                   cyclical                                                               efficiency and   efficiency and
                                                                 investments                                                                profitable     diversification
                                                                                                                                              growth
   See the energy at

  TGS.com                                                                                        - 56 -
What TGS May Look Like After 2030
2020 energy mix 2040 energy mix
Other
Other Oil
Oil
TGS addressable TGS addressable
Coal market market
Coal
Gas
Gas
Renewables
Renewables Source: IEA (SDS scenario)
TGS today: TGS Long-term ambition
• World’s leading subsurface data company • World’s leading energy data company
• Asset light and multi-client business model • Asset light and multi-client business model
• >95% of revenues from oil & gas • Revenues reflecting overall energy mix
• Emissions (scope 1 & 2): 23.4 kilotons of CO2e • Carbon neutral
• New strategy launched February 2021 • High portion of recurring revenues
See the energy at
TGS.com - 57 -Questions & Answers
Thank you
Appendix
Income Statement
 IFRS

See the energy at

TGS.com             - 61 -
Balance Sheet
 IFRS

See the energy at

TGS.com             - 62 -
Reconciliation
 IFRS

See the energy at

TGS.com             - 63 -
Multi-Client Library
 TGS/SPU Consolidated (Q1 2018 – Q4 2019)

         1. Operational multi-client seismic investments
See the energy at

TGS.com                                                    - 64 -
You can also read