Cost-optimal nZEB HVAC configurations with onsite storage
←
→
Page content transcription
If your browser does not render page correctly, please read the page content below
E3S Web of Conferences , 07001 (2021)                                                                  https://doi.org/10.1051/e3sconf/202124607001
Cold Climate HVAC & Energy 2021

       Cost-optimal nZEB HVAC configurations with onsite storage
       Fabian Ochs1*, Mara Magni1, Elisa Venturi1, and Alice Tosatto1, Wolfgang Streicher1
       1Energy   Efficient Building, University of Innsbruck, 6020 Innsbruck, Austria

                      Abstract. By 2021, all new buildings in the European Union must be nearly zero-energy buildings in order
                      to contribute to the achievement of the EU-CO2 neutrality by 2050. As the technical options to achieve
                      highly-efficient building envelopes are available and well-known, there is no doubt that the most promising
                      Heating Ventilation and Air Conditioning systems will include heat pumps and photovoltaic panels.
                      However, there exist ongoing discussions on the optimal system layout and the integration of storage to
                      achieve nZEB. In particular, there are some good arguments in favour of very low demand, while
                      contrariwise also high flexibility is seen as an important feature to enable so-called grid-reactive operation
                      of the building stock. Integration of onsite storage and its influence on the energy demand of the buildings
                      and the corresponding electric load profile with focus on peak power is investigated.

       1 Introduction                                                                 According to the Energy performance of buildings
                                                                                  directive (EPBD), an nZEB is a nearly zero- energy
                                                                                  building, which has a very low energy demand due to
       1.1 nZEB and flexibility                                                   efficiency measures that include efficient HVAC
           By 2021, all new buildings in the European Union                       technology (e.g. HP) and utilization of RE to meet the
       (EU) must be nearly zero-energy buildings (nZEBs) in                       very low demand to a considerable extent. Yet, in the
       order to contribute to the achievement of the EU-CO2                       EU member states nZEBs are defined following the
       neutrality by 2050. As the technical options to achieve                    national standards. In this regard, each member state
       highly-efficient building envelopes are available and                      provided its own national definition with sometimes
       well-known, there is no doubt that the most promising                      significant differences in terms of energy consumption
       Heating Ventilation and Air Conditioning (HVAC)                            (heating, cooling, hot water, auxiliary consumers and
       systems will include heat pumps (HPs) and photovoltaic                     appliances), maximum limits, conversion factors, etc.
       (PV) panels. However, there exist ongoing discussions                      (see [1,2]).
       on the optimal system layout and the integration of                            The Net Zero Energy Building (NZEB) is better
       storage to achieve nZEB. In particular, there are some                     known internationally and outside Europe. A NZEB can
       good arguments in favour of very low demand, while                         be realized as a "grid-connected building that on annual
       contrariwise also high flexibility is seen as an important                 basis generates the same amount of energy from on-site
       feature to enable the so-called grid-reactive operation of                 RE energy sources as it consumes" (IEA SHC T40/ HPT
       the building stock.                                                        A40). It is worth mentioning that this definition lacks
           A techno-economic analysis of different                                clarity with regard to the interpretation of system
       technologies including passive components i.e.                             boundaries, energy flows, weighting factors (i.e.
       envelope, Mechanical Ventilation with Heat Recovery                        conversion factors), etc. Theoretically, an NZEB might
       (MVHR), Shower Drain Water Recovery (SDWR),                                be a building with relatively high overall heat transfer
       active components i.e. heat pump (HP), direct electric                     coefficient (U-value) and, thus, high heating demand
       heating (DE), renewables (RE) (e.g. PV) as well as                         and to compensate for that is equipped with a very large
       storage can be performed to identify cost-optimal                          PV system. In this regard, such an NZEB would
       solutions and combinations depending on the type of                        generate a large PV-surplus in summer, whereas in
       building (i.e. residential and non-residential buildings)                  winter the energy demand has to be covered from the
       as well as on the application i.e. heating, cooling,                       power grid (so-called winter gap). As a general rule, in
       Domestic Hot Water (DHW), lighting, appliances.                            multi storey buildings the available area for PV
       Herein, the investigation should include the HP                            compared to the treated area is not sufficient to achieve
       integration together with locally available RE energy                      the net zero balance even if the building is highly
       sources for application in nZEBs. In this context, a                       efficient [3,4,5,6].
       special focus is the optimization of the HP control and
       onsite storage integration and the interaction with the
       electricity grid (electricity purchase and sell).

       *   Corresponding author: fabian.ochs@uibk.ac.at

  © The Authors, published by EDP Sciences. This is an open access article distributed under the terms of the Creative Commons Attribution License 4.0
  (http://creativecommons.org/licenses/by/4.0/).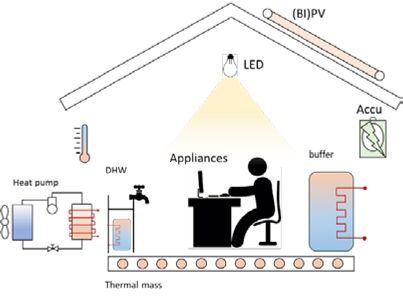
E3S Web of Conferences , 07001 (2021)                                                                       https://doi.org/10.1051/e3sconf/202124607001
Cold Climate HVAC & Energy 2021

       1.2 Energy Storage                                                               PV for HP) or when electricity prices are lower. The
                                                                                        main disadvantage compared to simultaneous
                                                                                        production and use is related to the efficiency of the
       1.2.1 Overview
                                                                                        storage system, which usually consists of steel water
           Energy storage can be beneficial in terms of                                 tanks with thermal insulation. The storage efficiency
       buffering mismatch between energy source and energy                              depends on the surface-to-volume ratio, the operating
       demand. In a future energy system with volatile RE                               temperature and the storage period. It is also possible to
       energy sources (wind, solar) energy storage is required                          use coupled storage systems for domestic hot water
       to bridge short-term mismatch (day-night), mid-term                              preparation and SH water ("tank in tank" or stratified
       mismatch (couple of days to few weeks) and seasonal                              tank).
       mismatch (summer-winter). The seasonal pattern can be                                Solid sensible storage is either a massive part of the
       seen on both, the energy source side (hydro, solar) and                          building (e.g. walls, floors, ceilings) known as thermal
       demand side, i.e. space heating (SH).                                            activation of building systems (TABS) or fillings made
           Fig. 1 gives an overview of the existing electric and                        of gravel or rocks. Such storage systems are therefore
       thermal energy storage. While long-term electric storage                         often integrated directly into the respective building and
       systems are typically large-scale central units, short term                      are short term storages (1 to max. 2 days). The thermal
       electric storage can be scaled for a wide range of                               building mass can be heated/cooled passively by the
       applications and can be applied in buildings. Sensible                           environment (e.g. solar gains) or actively. Such active
       long-term thermal energy storage is typically applied in                         solid storage can in principle be operated with liquid
       district heating (DH) systems [7], while sensible short                          (hydronic systems) or air as a heat transfer medium. Fig.
       term storage is integrated in smaller units into the                             2 gives an overview of building-integrated storage
       building. Latent and thermo-chemical storage play still                          systems.
       a minor role in practice, but extensive research is
       ongoing [8].
                                               Energy
                                               Storage

                             Electric                            Thermal

               long-term                short-term       long-term    short-term

                      (Electro)-                          sensible
         Mechanic                        Electric                      Sensible
                      Chemical                              TES
          pumped                        Stationary
                           PtHtP                         latent TES        Latent
           hydro                        Batteries
                                        Mobile           thermo-
                       BtGtP                                                TC
                                        Batteries        chemical                       Figure 2. Schematic presentation of (thermal and electric)
                                                                                        energy storage in buildings.
       Figure 1. Overview of electric and thermal energy storage                            Table 1 gives an overview of building-integrated
       (TES); PtHtP: Power to Heat to Power BtGtP: Biomass to                           storage and potential storage capacities. In combination
       Gas to Power [11].
                                                                                        with a heat pump, with an average Coefficient of
          For the design of energy storage, it is crucial to                            Performance (COP) of 3, the thermal storage capacity
       determine the storage capacity, the storage discharge                            can be approximately converted to electric storage
       and charge power as well as the storage efficiency.                              capacity. For DHW the daily electric storage potential is
       Storage can be integrated into the energy system in large                        2.3 kWh.
       central units or decentral in buildings.                                             For a typical Single Family House (SFH) the daily
                                                                                        electricity consumption (appliances, lighting, etc.) is
                                                                                        ranging between 6 kWh/d in summer and 8 kWh/d in
       1.2.2 Energy Storage in Buildings
                                                                                        winter.
           Concerning the storage of energy on-site (at the                             Table 1. Energy storage in buildings and storage capacity;
       building level), two types of energy storage are possible:                       example SFH, 140 m².
           - Electric: Buildings equipped with a PV system can
       largely benefit from the introduction of batteries that                             Energy         Type         Typical Size      Capacity
       allow direct consumption of the electricity generated.
       Careful dimensioning of the batteries, based on the                                Electric       Battery       1 kWh/kWp         6 kWhel
       analysis of the installed power and consumption, is
                                                                                          Thermal         DHW                            7 kWhth
       necessary to optimize costs. Self-discharge and energy                            (hydronic)       buffer
                                                                                                                       100 to 150 l
                                                                                                                                         50/10 °C
       consumption for battery management have to be                                      Thermal                                        23 kWhth
       considered.                                                                                      SH buffer         1000 l
                                                                                         (hydronic)                                      50/30 °C
           - Thermal: The storage of domestic hot water is                                Thermal                                       28 kWhth/d
       already widespread in residential buildings. It is possible                                        TABS        200 Wh/K/m²
                                                                                            mass                                         'T = 1 K
       to store hot water when more energy is available (e.g.

                                                                                    2
E3S Web of Conferences , 07001 (2021) https://doi.org/10.1051/e3sconf/202124607001
Cold Climate HVAC & Energy 2021
1.2.3 Energy Flexible Buildings active solar technology and the role of onsite storage. A
methodology was developed to analyse and compare
Through energy storage, energy flexibility in different solutions.
buildings could provide generating capacity for energy While previous studies on energy storage in
grids, and better accommodate RE sources in energy buildings, energy flexibility, demand-side management,
systems. There is also seen a potential to reduce costly and model predictive control focused on the micro-
upgrades of energy distribution grids. economic aspect, this work investigates the influence of
The main challenge is providing thermal comfort, onsite storage on a macro-economic scale. It is
reducing thermal losses while ensuring an economic important to determine the reduction of the grid
benefit for the building owner/operator and the utility, electricity demand and the PV excess electricity
see (IEA EBC, Annex 67). depending on the sizing of the (thermal and/or electric)
storage. The research question is, whether in a 100%
1.3 Future sustainable energy scenario RE-based scenario (which requires large storage
capacities), onsite storage will play a significant role.
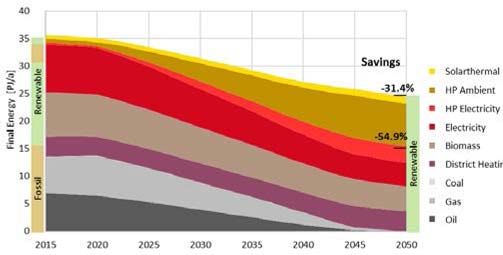
As shown in [9,10], for the example in Tyrol (Austria) a Furthermore, it is investigated how onsite storage
future sustainable energy system for the building sector capacity influences the required back-up power or
is possible, see Fig. 3, but, given the limited potential of central storage capacity.
RE, only under the following conditions:
x Significant reduction of the load (new buildings in
Passive House Standard, renovation quality of the 2 Methodology
building stock as close as possible to Passive
House standard) 2.1 Building Model
x Heat Recovery (mechanical ventilation, waste
water) A simple and fast dynamic simulation model is
x Phase-out of fossil energy systems and massive required to predict the load of different building types
application of HP (SFH, Multi Family House - MFH, office, etc.) with
different HVAC systems (e.g. HP), DHW and
x Improvement of efficiency in appliances and in HP
appliances profiles as well as storage options (thermal,
applications
electric) and PV integration. A simple dynamic 1-zone
x Decarbonisation of DH system (waste heat,
lumped capacity model (see Fig. 4) was developed in
biomass, solar thermal) Matlab (ode15s solver) with the following features:
x Massive increase of RE energies (hydro, wind, x Single zone, lumped capacity
Solar) in the electricity generation x Resistance model for wall / window
x Installation of storage capacity to bridge daily, x Solar Heat Gain Coefficient (SHGC) with angle
weekly and seasonal mismatch between load and dependence, constant shading
demand. x Constant effective air exchange (optionally with
x An important hypothesis is that the potential of heat recovery efficiency of 0.6)
biomass in the building sector is limited as it will x Constant internal gains
be required in industry and transport x Climatic data hourly resolution (Meteonorm,
based on OIB-6, B8110-5 (Innsbruck)
x Detailed calculation of solar radiation (Perez)
x Heating with hysteresis with HP or DE
x (cooling optional)
x HP (Carnot, Carnot performance factor)
x DHW with "daily storage tank" (charging 5 hours
during the day with heat pump or direct electric),
DHW priority
x Heating buffer optional (1-node lumped capacity
dynamic model)
Figure 3. Ambitious Scenario of reduction of final energy x Profile for electricity (appliances) according to
demand in the building sector by means of deep thermal APCS (2021, 15 min resolution) [19]
renovation and phase-out of coal, oil and gas in Tyrol [10]. x PV system with temperature-dependent efficiency
Remark: Tyrol’s electricity is certified as 100 % renewable, and inverter
mainly from hydro power plants, ca. 20 % are imported from
x Dynamic battery model (simple capacity model;
Norway, in Austria the ca. 75 % of the electricity is
renewable. charge rate (c-rate) = 0.5; minimum State of
Charge (SoCmin) = 0.2)
x Cross-validated against CarnotUIBK [20]
1.4 Aim of this work (Matlab/Simulink) and , TRNSYS
The aim of this work is to show for the investigated
virtual cases the potential of integrating passive and
3E3S Web of Conferences , 07001 (2021) https://doi.org/10.1051/e3sconf/202124607001
Cold Climate HVAC & Energy 2021
600
500
400
/ [W]
300
el
P
200
Figure 4. Simple dynamic 1-zone lumped mass building 100
model.
The following set of equations is solved with a 0
0 1000 2000 3000 4000 5000 6000 7000 8000
maximum time step of 1 hour using Matlab (ode15s) t / [h]
solver. Results are post-processed with 1 h resolution. (a)
Building 600
= ( + + ) (1)
500
Thermal storage
= ( ,
+
,
) (2)
400
Electric Balance
/ [W]
300
, = + !" + ## + $
el
(3)
P
,% =
,
,&',* ,* (4) 200
Battery
-. 100
= (5)
= charge discharge standby loss (6) 0
0 20 40 60 80 100 120 140 160
= /01( ; 2%
3 ) 4 (563 > 5637 )&(563 < 5637$ ) (7) t / [h]
PV (b)
,&',* = 9:
%
% 4
,&' :
%
%,? (8)
Figure 6. Appliances, APCS (2021, 15 min resolution) [19]
,&' = @AB%
B7
C 4 DE + 1G 9gen 4 Hsol 4 &',#
I (9)
(a) year (b) week in January.
Hsol = JK 4 (D% 4 H% + D
4 H
) (10)
2.3 Key performance indicators
2.2 DHW and Appliances profile
The supply cover factor (SCF) and load cover factor
For all residential buildings, simplified DHW and (LCF), depend on the PV own consumption (WPV, own)
appliances profiles are assumed. As an example, the and are typically used to evaluate the performance of PV
charging profile for SFH is reported in Fig. 5. The DHW and energy storage. as ratio with respect to the total by
tapping profile is based on EN 16147, profile M with PV produced electricity (WPV) or total electricity
5.8 kWh/d. A small DHW store of 120 l is assumed and demand of the building (WEl,tot), respectively, and are
three different simplified charging strategies are determined on simulation time step level.
investigated. Daytime charging between 09:00h and SCF = WPV,own / WPV (11)
15:00h, night-time charging between 18:00h and 23:00h LCF = WPV,own / WEl,tot (12)
and morning/evening charging between 6:00h and 9:00h The non-renewable primary energy demand (PEnon-RE) is
as well as 19:00h and 22:00h. For the results presented used to evaluate the environmental impact. The primary
here the evening profile was used. energy conversion factor fPE,non-RE depends on the
The appliances have a resolution of 15 min and scenario for the future development of the electricity
besides a seasonal variation, weekdays and weekends mix. Currently it is 2.3 on European average.
are distinguished, see Fig. 6. WEl,grid = WEL,tot – WPV,own (13)
Winter PEnon-RE = WEL,grid . fPE,non-RE (14)
1
evening From the macro-economic point of view, the
0.8
daytime primary energy savings are more relevant. To account
0.6 for different scenarios for the future electricity mix, i.e.
morning/
0.4 evening with different RE shares (hydro, wind, PV) and time of
0.2 electricity buy and sell, monthly conversion factors are
0 recommended to calculate the primary energy demand
0 5 10 15 20 (PE / [kWhPE/(m2 a)] or the CO2 emissions (CO2 / [kg/m²
a)]), see [12].
Figure 5. DHW charging profiles as well as an indication of For the case study of the SFH, the following
winter (dark yellow) and summer (light yellow) sunshine economic parameters (Annuity Method) were applied
duration in Innsbruck. x Period of Consideration 20 yrs.
x Interest Rate (nominal) i=3%
TAC = EAC + MC + OC (15)
EAC = IC . i / (1 - (1+i)-L) (16)
4E3S Web of Conferences , 07001 (2021) https://doi.org/10.1051/e3sconf/202124607001
Cold Climate HVAC & Energy 2021
with Investment Costs (IC) Table 2. Share of the different HVAC types in the analysed
x PV 1500 €/kWp L = 20 yrs. residential building categories (in % relative to the gross
x Battery 1000 €/kWh L = 10 yrs. floor area [m²GFA]); scenario Tyrol, 2050 [11].
and Operation (OC) and Maintenance (MC) costs
SFH s-MFH l-MFH
x Electricity buy costel,b = 0.25 €/kWh
x Electricity sell costel,s = 0.04 €/kWh HP 56 53 55
x Maintenance/Repair 5 % of TAC
DE 3 2 3
Electricity costs (buy) are assumed to be average
Biomass 3 27 9
over the consiration period of 20 years with an moderate
annual increase of 3 % based on the current electricity DH 38 18 33
costs of 0.185 €/kWh.
Table 3. Gross floor area, available roof surface, number of
2.4 Building Stock Model buildings and installed PV peak power per building type [11].
The aim of this work is to predict the electric load SFH s-MFH l-MFH
curve of the building stock with different options of
onsite PV and energy storage (thermal, electric). The Gross floor area
[m2GFA] 182.9 405.3 2090.1
building stock of Tyrol (Austria) is taken as an example.
It is represented by 6 types of prototypical buildings No. floors 2 3 10
(based on Scenario Energy Autonomy Tyrol). Each
building is equipped with either a heat pump, a direct Roof surface [m2] 91.5 135.1 209.0
electric heating system and represents different load
patterns for the electricity grid. Buildings heated with No of buildings 106579 67592 5063
biomass or connected to DH system represent an Installed PV
5 8 12
appliance- (and auxiliary-) based load only. The [kWpeak]
scenario assumes a total phase-out of fossil heating PV Yield
1200 (1047 kWh/kWp)
systems (i.e. no gas and oil boiler). The schematic [GWh/a]
representation of the building stock is shown in Fig 7.
All new buildings follow the Passive House
Tyrol standard, all existing buildings are refurbished with
Passive House components, which leads to average
SFH sMFH lMFH office Hotel Industry energy levels reported in Table 4.
HP DE Rest … … … … HP DE Rest
Table 4. Final energy for space heating (SH), domestic hot
water (DHW) and appliances of the average residential
buildings depending on the heating technology according to
Figure 7. Structure of the simplified building stock model; scenario Tyrol 2050 [11].
HP: Heat pump; DE: Direct electric heating; Rest: Biomass,
District Heating. SFH
Specific FE consumption
Each building is simulated with its individual Buildings SH DHW Appliances
energetic quality (i.e. heating demand), with different heated with: [kWh/(m2 a)]
heating technology (see table 2), with and without PV, Biomass 60.0
without as well as with small or large battery storage. DH 45.1
The energetic building quality represents the average 22.7 12.25
DE Heating 37.8
status of 2050, according to the above mentioned HP (heat) 37.8
scenario. s-MFH
The following results focus on the residential Specific FE consumption
buildings with 21 % SFH, 29 % s-MFH and 11 % l-MFH SH DHW Appliances
Buildings
in Tyrol. Remark: The share of the non-residential heated with: [kWh/(m2 a)]
buildings is approx. 14 % in terms of the number of Biomass 53.3
buildings, and 30 % in terms of gross floor area final DH 41.8
energy consumption, see [13]. Table 3 summarizes the 20.0 11.84
DE Heating 31.8
number of the residential buildings and the available PV HP (heat) 31.6
area per building (roof only). l-MFH
Remark: according to [11] approx. 3300 GWh of PV Specific FE consumption
(net balance) would be required for an energy- SH DHW Appliances
Buildings
autonomous building stock in Tyrol in 2050, i.e. heated with: [kWh/(m2 a)]
additional 2100 GWh would have to be installed on Biomass 51.5
roofs of offices and industry buildings and on open DH 34.3
space. Only the PV installed on the roofs of the 21.3 11.17
DE Heating 30.7
residential buildings are considered in the following
HP (heat) 35.9
sections (results and discussion).
5E3S Web of Conferences , 07001 (2021) https://doi.org/10.1051/e3sconf/202124607001
Cold Climate HVAC & Energy 2021
3 Results heating, which however represents only a small share of
the building stock. The corresponding electric load for
the grid (positive buy, negative sell) is also shown.
3.1 Energy Demand and Load 40
The daily electric energy for SH, DHW, auxiliary 35
(aux), appliances and the sum of all (total) is shown for 30
the SFH with heat pump in Fig. 9. 25
40
sh
/ [kWh/d]
20
dhw
35
aux
el
15
w
appliances
30 el,tot
10
25
5
/ [kWh/d]
20
0
0 50 100 150 200 250 300 350
el
15 t / [d]
w
10
(a)
40
5
30
0
0 50 100 150 200 250 300 350 20
t / [d]
10
Figure. 9. Daily electric energy for space heating (sh),
/ [kWh/d]
domestic hot water auxiliary (dhw), auxiliary (aux), 0
el
w
appliances and total for the SFH (140 m²) with heat pump. -10
-20 el,tot
For the planning of the required storage capacity in pv,ac
el,grid
a building, the total electricity demand, the peak load -30
0 50 100 150 200 250 300 350
and the PV yield are required. These are summarized in t / [d]
Table 5. (b)
Table 5. Total electricity demand of the SFH (5 kWP), the s-
40
MFH (8 kWP) and the l-MFH (12 kWP); PV Net Peak Power: 30
max([PEl,grid;PPV,excess]).
20
Total Load / PV PV Net
electr. [W] yield / Peak 10
demand [kWh] Power
/ [kWh/d]
/ [kWh] [W] 0
el
w
SFH DE 13376 4946 5235 4011 -10
HP 5157 1975
Rest 2247 603 -20 el,tot
pv,ac
s-MFH DE 93331 11308 8376 6250 el,grid
HP 38090 4066 -30
0 50 100 150 200 250 300 350
Rest 4798 1281 t / [d]
l-MFH DE 143928 53130 12564 7400 (c)
HP 55183 21044 40
Rest 23340 6231 30
20
3.2 Electric Energy Balance with onsite PV and
storage 10
/ [kWh/d]
The daily sum of the electric load is shown for the 0
el
w
SFH in Fig. 10 (a) for the case with heat pump without -10
PV, in (b) with 5 kWp PV, in (c) with PV and small
battery (6.67 kWh) and in (d) with PV and large battery -20 el,tot
pv,ac
(8 x 6.67 kWh). It is noteworthy that instead of a larger -30
el,grid
battery also thermal storage (i.e. buffer) could be used, 0 50 100 150
t / [d]
200 250 300 350
however, for sake of simplicity, only electric storage (in
(d)
addition to the DHW storage and thermal mass of the
building) is presented here. It is also important to Figure 10. Example of electric load (daily sum) of the SFH
mention that space heating buffer would only be with heat pump (a), with heat pump and PV (b), heat pump,
effective in winter and more effective in case of DE PV and small battery (c) as well as heat pump, PV and large
battery (d).
6E3S Web of Conferences , 07001 (2021) https://doi.org/10.1051/e3sconf/202124607001
Cold Climate HVAC & Energy 2021
With PV (independent of the presence of a battery) 2000
the daily sum of the excess PV is in the range of 1000
22 kWh/d (peak) while in winter the PV does hardly
influences the peak of the grid load because of too little 0
production in winter and long nights. Even with large -1000
battery, neither the peak load in summer nor the peak
P / [W]
load in winter is significantly reduced. The battery -2000
operation is effective mainly in the interim season -3000
(March, April as well as September, October). no PV
5 kW
It can be understood from the state of charge of the
p
-4000 5 kW 1 * 6.67 kWh
p
battery (see Fig. 11 (a) for small battery and (b) for large 5 kW
p
8 * 6.67 kWh
-5000
battery) that further increase of the capacity is of limited 0 1000 2000 3000 4000 5000 6000 7000 8000
t / [h]
use. The battery is fully charged most of the time in
summer and empty most of the time in winter. In (a)
5000
consequence, there is also no relevant capacity for
4000
electricity buffer from PV of other buildings in summer,
neither surplus of electricity for other buildings in
3000
winter, in case of a heating dominated climate like 2000
Innsbruck. 1000
In Fig. 12 the resulting load curves are shown for the 0
P / [W]
SFH with heat pump in (a), for direct electric heating in -1000
(b) and for the case of biomass or district heating (i.e. -2000
no PV
appliances and aux. only) in (c). In all three cases, a -3000 5 kW
p
significant reduction of the grid electricity consumption -4000
5 kW
5 kW
p
1 * 6.67 kWh
8 * 6.67 kWh
can be seen with the 5 kWp PV system. With a small -5000
p
battery, the excess electricity can be significantly 0 1000 2000 3000 4000
t / [h]
5000 6000 7000 8000
reduced and also further decrease of the electricity
(b)
required from the grid can be seen. A larger battery 1000
allows for a further decrease. However, in all cases the
battery does not influence the peak power. 0
1.2
-1000
1
-2000
P / [W]
0.8
-3000
0.6
no PV
soc / [-]
6 kW
p
-4000
6 kW 1 * 6.67 kWh
p
0.4
6 kW 8 * 6.67 kWh
p
-5000
0 1000 2000 3000 4000 5000 6000 7000 8000
0.2
t / [h]
0
(c)
0 1000 2000 3000 4000 5000 6000 7000 8000
t / [h] Figure 12. Example of electric load (hourly, sorted) of the
(a) SFH with heat pump (a), DE heating (b) and Biomass/DH (c)
1.2 without PV, with PV with small (1 x 6.67 kWh) and large (8
x 6.67 kWh) battery.
1
The load and supply cover factor is summarized in
0.8
Table 6 for all cases. Both, load and supply cover factors
can be increased significantly using a small battery;
0.6 while there is a limited effect of increasing the capacity.
soc / [-]
In case of the s-MFH and l-MFH the contribution to PV
0.4
remains below 50 % even with the large battery SCF and
LCF should not be used to evaluate and compare
0.2
different HVAC, RE and storage solutions.
0
0 1000 2000 3000 4000 5000 6000 7000 8000
t / [h]
(b)
Figure 11. State-of-charge (soc) of the battery for (a) small
battery (6.67 kWh) and (b) large battery (8 x 6.67 kWh).
7E3S Web of Conferences , 07001 (2021) https://doi.org/10.1051/e3sconf/202124607001
Cold Climate HVAC & Energy 2021
Table 6. Load cover factor and supply cover factor (in On micro-economic scale, in a SFH with HP, which
brackets) for the three building types, without, with small and represents a large share of the future building stock, a
with large battery; Rest: buildings heated with biomass and PV system with a maximum 4 kWp is economic, a small
district heating. battery leads to significant savings but is associated with
PV + PV + a significant increase of annual costs.
PV
small bat. large bat. On macro-economic scale and with regard to
SFH DE .12 (.30) .20 (.56) .35 (.89) achieving the climate goals, instead, the PV system
HP .26 (.26) .52 (.52) .64 (.64) should be obviously as large as possible.
Rest .48 (.21) .89 (.38) .97 (.42)
s-MFH DE .11 (.35) .16 (.51) .29 (.91)
HP .25 (.32) .39 (.50) .37 (.73) 3.4 Electric Energy Demand Building Stock
Rest .46 (.27) .77 (.44) .92 (.53)
l-MFH DE .06 (.68) .06 (.74) .08 (.93) With the share of building types (SFH, s-MFH, l-
HP .16 (.60) .17 (.77) .22 (.96) MFH) and the corresponding share of heating systems
Rest .35 (.65) .40 (.75) .51 (.95) (HP, DE and rest (biomass, DH)) the total electric load
of the residential building stock (acc. to the scenario
Tyrol 2050) can be calculated, see Fig. 14.
4
3.3 Techno-economic Analysis 6
10
SFH
DE
SFH
Using the SFH as an example, a techno-economic 5
SFH
HP
Rest
analysis (see above for the assumptions) is performed. 4
sMFH
DE
sMFH
The PE savings ('PE) are calculated with respect to the sMFH
HP
Rest
reference case (no PV) for varying sizes of PV system 3
lMFH
DE
/ [W]
(from 1 to 5 kWp) and for different battery capacities P
el
2
lMFH
lMFH
HP
Rest
(for 5 kWp from 1 to 8 times 6.67 kWh). The highest PE tot
savings are possible in case of DE heating, while only a 1
small PV system (i.e. 1 kWp) is economically feasible 0
(minimum of 'c). Only a small PV system (< 3 kWp) is
economic in case of biomass and DH (Rest) and savings -1
0 1000 2000 3000 4000 5000 6000 7000 8000
are relatively low. In all cases, it can be observed that t / [h]
PV combined with small battery allows for significant
PE savings, however, it is not economically feasible. Figure 14. Load curve (sorted hourly values of the electric
load) for the different building types and heating systems,
45 example of the case with PV (acc. to table 4).
40 HP
35 DE In Fig. 15 the load curves represent an average
30 Rest residential building, i.e. the total load curve divided by
'c / [€/(m² a)]
25
the total number of residential buildings for the case
20
with battery without PV, with PV, with PV plus small battery and
15
10 with PV plus large battery. The load curve is dominated
5 by the SFH with HP as it represents the majority of the
0 buildings acc. to the scenarios in [11].
-5 3000
0 5 10 15 20 25 30 35
'PE / [kWh/(m² a)] 2000
(a) 1000
3.0 0
HP
2.5
/ [W]
-1000
DE
el
'c/'PE / [€/kWhPE]
2.0
P
Rest -2000
1.5
-3000
1.0
noPV
PV
-4000
PV + small Bat
0.5 PV + large Bat
-5000
0.0 0 1000 2000 3000 4000 5000 6000 7000 8000
t / [h]
-0.5
0 5 10 15 20 25 30 35
Figure 15. Total (average residential building i.e. total
'PE / [kWh/(m² a)]
electricity consumption divided by total number of residential
(b) buildings) load duration curve (in hourly resolution, sorted)
without PV, with PV acc. to table 2 and 3,with PV and small
Figure 13. Cost difference 'c (a) and cost intensity ('c/'PE) battery (6.67 kWh) as well as with PV and large battery (8 x
vs. primary energy savings 'PE with respect to the reference 6.67 kWh).
(no PV); example of SFH with DE heating, with HP and rest
(biomass, DH); fPE = 1 kWhPE/kWhel. Solid filled points Again, extensive use of PV has a significant
include also a battery; empty marker without battery, filled influence on the bought and sold electricity, however,
marker with battey. the peak load is hardly reduced even with large storage
8E3S Web of Conferences , 07001 (2021) https://doi.org/10.1051/e3sconf/202124607001
Cold Climate HVAC & Energy 2021
capacity in the buildings. The peak power is ca. 2350 W used to further foster and optimize nZEB design and
without PV, 2250 W with PV and 2100 W with PV plus implementation and the role of storage.
large storage for electricity delivered from the grid. The Evaluation of integration of RE and onsite storage
excess PV electricity supplied to the grid is 4950 W with (grid flexibility) must include all energy consumers (i.e.
PV and 4550 W with PV and large battery. Overall with space heating (and cooling), domestic hot water
or without onsite storage for the average building the preparation, auxiliary energies and appliances/lighting).
grid has to be capable of a capacity of approx. 5000 W. In order to evaluate the time of consumption, either
monthly primary energy factors should be used and/or
time depending electricity prices for buy and sell.
4 Discussion and Conclusions
The work presented in this paper is based on the results of a
Future new as well as deep renovated buildings, so- collaboration within IEA HPT Annex 49 and Annex 55.
called nZEBs, will have a relatively low heating demand Financial support was provided by the Austrian Ministry for
(new down to ca. 15 kWh/(m² a); average around Transport, Innovation and Technology and the Austrian
45 kWh/(m² a), acc. to [11]) and a correspondingly short Research Promotion Agency (FFG) through the IEA Research
heating season (from October to April). The DHW Cooperation. Furthermore, the authors thank Land Tirol for
demand is of the same order of magnitude (typically funding the project “Energiespeicher Tirol 2050”, which
between 10 and 20 kWh/(m² a)). Assuming heat pumps also contributed to this work.
being the standard heating system in the future (the
assumption here is that the share of buildings that will
be heated with biomass or district heating systems
References
increases such that the final energy delivered by biomass [1] Kurnitski, J., Saari, A., Kalamees, T., Vuolle,
and district heating systems remains approx. constant), M., Niemelä, J., & Tark, T. (2011). Cost
the total electric demand for SH and DHW in case of HP optimal and nearly zero (nZEB) energy
is in the range of 10 kWhel/(m² a) and 25 kWhel/(m² a) performance calculations for residential
and of the same order of magnitude as the electricity buildings with REHVA definition for nZEB
demand for appliances (typically between national implementation. Energy and
15 kWhel/(m² a) and 20 kWhel/(m² a)). On a nZEB SFH Buildings, 43(11), 3279-3288.
with 5 kWp PV system, the net PV yield is of the same [2] Wemhoener C., Rominger L., Buesser S.,
order of magnitude as the annual total electricity Magni M., Ochs F., Betzold C., Dippel D.,
demand. Hence, only ca. 50 % of the final energy of the Simulation-based Methodology For
building is thermal energy and thus thermal storage Comparison Of nZEB Requirements In
could theoretically cover also only around 50 % of the Different Countries Including Results Of
total energy demand (SH + DHW), while electric Model Calibration Tests, IBPSA 2019, Rome.
storage (i.e. battery) could cover theoretically 100 % of [3] Dermentzis Georgios, Ochs Fabian, Passive
the total demand (SH + DHW + appliances). In MFH, House with PV façade and electric heating,
because of the relatively small roof area related to the Low costs and minimal installation effort vs.
GFA, the theoretical contribution of PV is significantly Performance, PV potential and evaluation of
less. PE consumption, ABS 2018, Bern, CH
Overall, onsite storage (thermal and electric) can be [4] Ochs, Fabian; Dermentzis, Georgios, Feist,
beneficial to reduce the grid electricity demand, Wolfgang, Minimization of the Residual
however, the grid load (i.e. peak power, both electricity Energy Demand of Multi-storey Passive
buy and electricity sell) is hardly reduced by onsite Houses – Energetic and Economic Analysis of
storage. From the micro-economic view, small PV Solar Thermal and PV in Combination with a
systems can be economic feasible, battery storage not. Heat Pump, Volume 48, 2014, Pages 1124-
Hence, if at all, extensive onsite storage should be 1133
considered only on short and mid-term to promote the [6] Ochs, Fabian ; Magni, Mara ; Hauer, Martin ;
extended use of PV in buildings (in particular when De Vries, Samuel; Bonato Paolo, Simulation
buyback tariffs are low). On macro-economic scale, in based evaluation of building integrated , solar
spite of energy savings, an additional application of envelope systems on building level, BS 2021,
storage in buildings or use of existing storage IBPSA, Bruges, 2021 (submitted)
(overheating of thermal building mass or buffer tanks) [7] Dahash, Abdulrahman; Ochs, Fabian; Bianchi
will lead to higher losses without reducing the peak Janetti, Michele; Streicher Wolfgang;, Applied
loads or the central storage capacity. Energy 239, 296-315
In a future step, the investigation will be extended to [8] Heier, Johan; Bales, Chris; Martin, Viktoria,
include non-residential buildings (offices, schools, Combining thermal energy storage with
hotels, industry, etc.) which account to approx. 30 % of buildings – a review, Renewable and
the final energy in Tyrol. Sustainable Energy Reviews, Volume 42,
Based on the presented results design guidelines can February 2015, Pages 1305-1325
be elaborated for building located in heating dominated [9] Ebenbichler, R. & Hertl, A. & Streicher, W. &
climates like Innsbruck. Furthermore, the results can be Fischer, D. & Richtfeld, C. & Mailer, M. &
Anton, I. & Hofmann, A. & Pöham, C. (2018):
9E3S Web of Conferences , 07001 (2021) https://doi.org/10.1051/e3sconf/202124607001
Cold Climate HVAC & Energy 2021
Ressourcen- und Technologieeinsatz-Szenarien HP Heat Pump
Tirol 2050. 220 S. HVAC Heating Ventilation Air Conditioning
[10] Ebenbichler, R. & Hertl, A. & Hofmann, A. &
Streicher, W. & Mailer, M. & Tosatto, A. & IC Initial Cost
Anton, I. & Reith, F. & Schaaf, N. & Rzehak, L Lifetime
S. & Ochs, F. (2021): Energie-Zielszenarien
MC Maintenance Cost
Tirol 2050 und 2040 mit Zwischenzielen 2030.
[11] Ebenbichler, R. & Blome, P. & Hofmann, A. & Mechanical Ventilation with Heat
MVHR
Streicher, W. & Mailer, M. & Hertl, A. & Recovery
Gschwentner, D. & Schaaf, N. & Rzehak, S. & MFH Multi Family House
Tosatto, A. & Ochs, F. & Anton, I. nZEB nearly Zero Energy Building
(2021): Energiespeicher Tirol 2050. Stufe I.
NZEB Net Zero Energy Building
Datengrundlagen und Vorbereitung
Modellberechnung. (in preparation) OC Operative Cost
[12] Ochs, Fabian; Dermentzis, Georgios (2018): PV Photovoltaic Panels
Evaluation of Efficiency and Renewable PtHtP Power to Heat to Power
Energy Measures Considering the Future
Energy Mix. In: 7th International Building PE Primary Energy
Physics Conference (IBPC 2018). Proceedings. RE Renewable
Syracuse, NY, USA, September 23 - 26. 2018.
RF Reduction Factor
Syracuse University, S. 1271 - 1276. (DOI)
[13] Statistik Austria, www.statistik.at/web_de SDWR Shower Drain Water Recovery
[14] IEA SHC Task 40/ IEA EBC Annex 52, Net SFH Single Family House
Zero Energy Solar Buildings
[15] IEA HPT Annex 40, Heat Pump Concepts for SHGC Solar Heat Gain Coefficient
Nearly Zero Energy Buildings SH Space Heating
[16] IEA HPT Annex 49, Design and Integration of SoC State of Charge
Heat pumps for nearly Zero Energy Buildings
[17] IEA EBC Annex 67, Energy Flexible Buildings TABS Thermal Activation of Building Systems
[18] EN 16147, Heat pumps with electrically driven TAC Total Annual Cost
compressors - Testing, performance rating and Symbols
requirements for marking of domestic hot
water units;:2017 Temperature [°C]
[19] APCS, Power Clearing and Settlement, C Capacity [Wh]
https://www.apcs.at/de I solar irradiation [W]
[20] D. Siegele, E. Leonardi, F. Ochs (2019), A new
i nominal interest rate
MATLAB Simulink Toolbox for Dynamic
Building Simulation with B.I.M. and Hardware K correction factor
in the Loop compatibility, Proc. Build. Simul. P Electric Power [W]
2019 16th Conf. IBPSA, https://doi.org Q Thermal Power [kWh]
/10.26868/25222708.2019.210641.
W electric energy [kWh]
efficiency [-]
Nomenclature Subscripts
AC Alternative current
Acronyms
app Appliances
Aux Auxiliary
b Buy
BtGtP Biomass to Gas to Power
bat Battery
c-rate Charge Rate buf Buffer
COP Coefficient of Performance dif Diffuse
DE Direct Electric dir Direct
DH District Heating el Electricity
DHW Domestic Hot Water gen generation
Energy performance of buildings ref Reference
EPBD
directive s Sell
EAC Equivalent Annual Cost
EU European Union
GFA Gross Floor Area
10You can also read