Forecast of the Demand for Electric Mobility for Rome-Fiumicino International Airport - Preprints.org
←
→
Page content transcription
If your browser does not render page correctly, please read the page content below
Preprints (www.preprints.org) | NOT PEER-REVIEWED | Posted: 1 July 2021 doi:10.20944/preprints202107.0037.v1

 Article

 Forecast of the Demand for Electric Mobility for
 Rome-Fiumicino International Airport
 Romano Alberto Acri 1, Silvia Barone 1, Paolo Cambula 2, Valter Cecchini 2, Maria Carmen Falvo 1, Jacopo Lepore 1,
 Matteo Manganelli 1,*, and Federico Santi 1
 1 Department of Astronautic, Electrical and Energy Engineering, Sapienza University of Rome, Rome, Italy;
 {romanoalberto.acri, mariacarmen.falvo, matteo.manganelli, federico.santi}@uniroma1.it
 2 ADR, Atlantia Group, Rome, Italy; paolo.cambula@adr.it, ing.cecchini@gmail.com

 * Correspondence: matteo.manganelli@uniroma1.com

 Abstract: Following electrification of automotive transport, studies on the penetration of Electric
 Vehicles (EVs) are widespread, especially in defined contexts, e.g. cities. As major transport hubs,
 airports fall within contexts worth of interest. In this work, a forecast of the demand for electric
 mobility in an Italian international airport (Rome, Fiumicino) is presented. First, a wide review of
 proposed scenarios on the penetration of EVs at international and national level and available data
 on local automotive transport are presented, as preliminary study for the definition of reference
 scenarios for the local context. Then the methodology proposed is presented and applied to the
 specific case study. Finally, a preliminary sizing of the required charging infrastructure is reported.
 The proposed approach can be considered as reference for similar studies on electrical mobility in
 other airport areas around the world.

 Keywords: electric mobility, electric vehicle, electrification, airport.

 1. Introduction
 Following energy and environmental concerns in road transports [1], the automotive
 industry is quickly evolving in the direction of Low-Emission Vehicles (LEVs) [2]. Electric
 Vehicles (EVs) are regarded as a suitable option. They can be classified as reported in Fig-
 ure 1 as: battery-powered electric drive alone, such as Battery Electric Vehicles (BEVs), or
 Full Electric Vehicles (FEVs), combined with thermal traction, such as Hybrid Electric Ve-
 hicles (HEVs), or BEV with range extender (Rex). Other low-emission technologies, like
 Fuel Cell Electric Vehicles (FCEV), are in the minority.

 HEV PHEV BEV + REx BEV FCEV
 •Thermal and •Thermal and •Electric traction •Electric traction •Electric traction
 electric traction electric traction •Battery and •Battery charged (by battery or
 •Battery and •Battery and small tank via plug fuel cell)
 tank tank •Battery charged •Battery and
 •Battery charged •Battery charged by heat engine hydrogen tank
 by heat engine via plug (charging only) •Battery charged
 (no plug) by fuel cell

 Figure 1. Taxonomy of Low-Emission Vehicles (LEVs)

 The international literature dealing with the topic of electrification of transport, and
 in particular the spread of EVs, is wide-ranging and approaching the subject from many
 different points of view. Just as examples, some references have been preliminary studied
 in details. Potential energy saving and emission avoidance via electrification of road trans-
 ports is investigated e.g. by Uherek et al. [1] and by Gonzalez-Palencia et al. [3,4]. Drivers
 and strategies for the expansion of EV are investigated e.g. by Wesseling et al. [5] and for

 © 2021 by the author(s). Distributed under a Creative Commons CC BY license.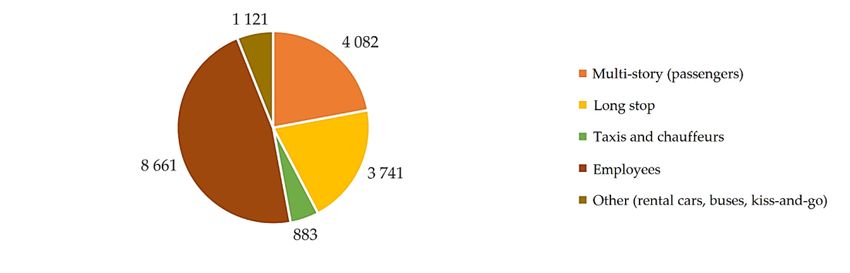
Preprints (www.preprints.org) | NOT PEER-REVIEWED | Posted: 1 July 2021 doi:10.20944/preprints202107.0037.v1

 Plug-In Vehicles (PEVs) by Gnamm et al. [6]. Examples of policies around the world are
 reported e.g. by Kong et al. [7] or by Trencher et al. [8]. Studies on the diffusion of EV in
 the world are e.g. by the Fraunhofer Institute [9] or the International Energy Agency [10].
 The diffusion of EVs is strongly conditioned by the development of charging infra-
 structure, mandatory for their expansion and deployment. The EVs charging system has
 an unavoidable impact on the electrical grids. Studies on the implementation of charging
 stations and on the issues related the power systems are widely present in international
 literature. [11-13]. The diffusion of electrical mobility in cities is an investigated topic in
 many papers, e.g. [14-16].
 The present work deals with a study made for forecasting of the demand for electric
 mobility for a specific area in Italy that is Rome-Fiumicino International Airport. Similar
 studies on the electrification of road transports to airports and the allocation of EVs charg-
 ing in airports are included in [17,18]. The work takes its cue from the necessity to upgrade
 airports, as major transport hubs, to accommodate electrical mobility. The objectives of
 the work are:
 • The forecast of EVs turnout at airport parking facilities at time horizon 2025-2030, for
 clusters of vehicles (chauffeurs, private cars, rental cars, and taxis);
 • The estimation of charging points potentially required accommodating the fore-
 casted EVs turnout.
 For the purpose of a forecast at local level (airport area), it is necessary to elaborate
 forecasts at wider levels to extrapolate local results. In addition, given the specific context,
 analysis of other specific data (e.g., stop duration and vehicle age) is also necessary. It
 means that a specific methodology of forecast has to be formulated. The present paper
 wants to show the methodology formulated and the results obtained. The paper is orga-
 nized as follows. Section 2 includes a description of the case study. Section 3 deals with
 the analysis of EVs development scenarios at the different levels and the definition of sce-
 narios of the forecast at local level. In Section 4, the forecast of EVs turnout for the case
 study is carried out. In section 5, the preliminary sizing of charging infrastructure for the
 case study is performed. Section 6 concludes the paper.

 2. The case study

 The case study is the Rome–Fiumicino International Airport "Leonardo da Vinci", the
 major airport in Italy and 15th airport in Europe by passenger traffic in 2020 (43 532 573
 passengers in 2019 and 9 486 161 Jan-Nov 2020) [19]-[20]. The landside mobility is orga-
 nized in:

 • Parking areas for passengers and operators;
 • Sub-concession parking areas for car rentals, chauffeurs, and buses;
 • Non-sub-concession parking areas for taxis, chauffeurs, buses, and shuttles.

 Transport to the airport is organized as follows [21]:

 • Public collective railway transport with the city of Rome: Ferrovia Laziale FL1 local
 train, Leonardo Express nonstop service;
 • Trenitalia Frecciargento high-
 Public collective railway transport major Italian cities:
 speed trains;
 • Public and private collective road transport: shuttle buses by private companies;
 • Public personal road transport: taxis;
 • Private personal road transport: chauffeurs and car rentals.

 The forecasting methodology is aimed to know the demand of electrical mobility in
 the airport area, split in the different categories of transport systems. For doing that the
 first steps are related to - the knowledge of the state of art of the EVs diffusion at national
 level and the analysis of EVs development scenarios at international and national level.
Preprints (www.preprints.org) | NOT PEER-REVIEWED | Posted: 1 July 2021 doi:10.20944/preprints202107.0037.v1

 In reference to data on EV fleet and market in Italy, the market is expanding, but it is
 still limited. In 2019, approximately 39 000 EV and 17 000 were sold (less than 1% of two
 million cars sold) (Figure 2).

 PHEV + Rex¹ BEV PHEV + Rex¹ BEV

 40,000 20,000

 16,000
 30,000

 12,000
 20,000
 8,000

 10,000
 4,000

 0 0
 2015 2016 2017 2018 2019 2015 2016 2017 2018 2019

 (a) (b)

 Figure 2. Share of EVs in car fleet (a) and car sales (b) in Italy 2015-2019. ¹Range extender.

 The analysis of EVs development scenarios at international and national level has
 been referred to different sources and the results of the wide analysis and comparison is
 reported in the next section. From these scenarios, two reference scenarios have been de-
 fined at national level, as starting point of the forecasting methodology proposed in Sec-
 tion 4.

 3. Analysis of EVs development scenarios at different levels
 3.1. Global level

 The development scenarios on global level are developed by international agencies
 operating in energy, mobility, and environmental sectors, such as:

 • Boston Consulting Group [22], where the analysis led to a single scenario, presented
 here as BCG;
 • Bloomberg NEF [23] under the assumption that in 2025 combustion engine cars and
 EVs will reach economic parity and presented here as BNEF;
 • IEA [10] which proposes two scenarios: IEA New Policy Scenario (NPS), this is the
 most conservative scenario and includes the impact of announced policy ambitions,
 and a more ambitious one, IEA 30@30, which accounts for the pledges of the EVs
 EV30@30 Campaign to reach 30% market share for electric vehicles by 2030.

 The mentioned reports are compared with reference to the penetration index of new
 EVs registrations, where this index is defined as the ratio between the number of EVs and
 the total number of vehicles expressed in percentage. In particular, the EVs considered are
 only BEV or PHEV, while the timeframe examined includes the years: 2020, 2025 and 2030.
 Figure 3 shows the results of the comparison among the scenarios before listed in terms
 of estimated average BEV and PHEV penetration index on car sales, for 2025 and 2030, at
 world level.
Preprints (www.preprints.org) | NOT PEER-REVIEWED | Posted: 1 July 2021 doi:10.20944/preprints202107.0037.v1

 40% BEV PHEV

 30%

 20%

 10%

 0%
 - 2025 2030 - - 2025 2030 - - 2025 2030 - - 2025 2030 -

 BCG BNEF IEA (NPS) IEA (30@30)

 Figure 3. Estimated average BEV and PHEV penetration index on car sales, for 2025 and 2030, at world level, based on different
 forecasting scenarios.

 With global sales of new electric cars reached 2.1 million units in 2019, the actual
 global penetration index remains slightly more than 2%. According to the results showed,
 this value could rapidly increase up to 2030. Indeed, whilst the sales shares for BEV mod-
 els vary between 10 to 24% by 2030, for PHEV ones the forecasts indicate a value between
 5% and 9%.
 3.2. European level
 The projected scenarios on European level were developed by some international
 agencies operating in energy, mobility, and environmental sectors, such as:

 • Boston Consulting Group [22] (BCG);
 • Cambridge Econometrics [24] that develops a set of three scenarios, each assuming a
 different decarbonization pathway taken by most major car manufacturers to meet
 EU CO2 emissions reduction targets. The scenarios are presented as: CAM, CAM
 (Tech PHEV) and CAM (Tech OEM);
 • Transport & Environment [25] that defined five scenarios, based on the incremental
 fuel efficiency upgrade of future ICE car fleet. The scenarios are presented as:
 TRA&ENV (b), TRA&ENV (lICE), TRA&ENV (hICE), TRA&ENV (BEV) and
 TRA&ENV (PHEV);
 • IEA [10] which proposes only NPS Scenario to forecast new electric vehicles sales in
 Europe.

 According to CAM (Tech) scenario ambitious deployment of fuel efficiency-technol-
 ogies allowed new cars sales mix to reach emissions target, with a predominance in BEV
 sales. A variant of this scenario, where PHEV emerges as dominant segment, is repre-
 sented by CAM (Tech PHEV); while in CAM (Tech OEM) was supposed a more ambitious
 deployment for advanced powertrain, in line with recent OEM announcements.
 Starting with the central scenario TRA&ENV (b), Transport & Environment supposes
 different strategies adopted by carmakers to improve the average fuel efficiency. In
 TRA&ENV (lICE) (low ICE Improvement) scenario carmakers choose not to invest in the
 incremental efficiency gains of ICE engine while in TRA&ENV (hICE) (High ICE Improve-
 ment) more hybrid vehicle sales is assumed to improve average fuel efficiency of cars fleet.
 Further scenarios are: TRA&ENV (BEV) where carmakers focus on selling BEVs and
 TRA&ENV (PHEV) with an equal distribution between BEV and PHEV up to 2030.
 Additional hypothesis, such as future declining of battery cost, growing incentive
 policy announcements and increasing of shared mobility are just some of the bases of BCG
 and IEA NPS scenario that led to following predictions.
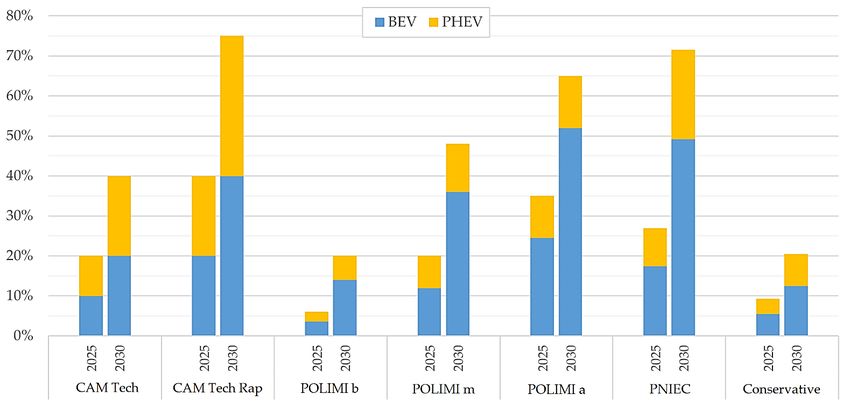
Preprints (www.preprints.org) | NOT PEER-REVIEWED | Posted: 1 July 2021 doi:10.20944/preprints202107.0037.v1

 Figure 4 shows the results of the comparison among the scenarios before listed in
 terms of estimated average BEV and PHEV penetration index on car sales, for 2025 and
 2030, at European level.

 80% BEV PHEV

 70%

 60%

 50%

 40%

 30%

 20%

 10%

 0%
 2025
 2030

 2025
 2030

 2025
 2030

 2025
 2030

 2025
 2030

 2025
 2030

 2025
 2030

 2025
 2030

 2025
 2030

 2025
 2030
 BCG CAM (tech) CAM (tech CAM (tech TRA&ENV TRA&ENV TRA&ENV TRA&ENV TRA&ENV IEA
 Phev) O&M) (b) (hICE) (lICE) (Phev) (Bev) (NPS)

 Figure 4. Estimated average BEV and PHEV penetration index on car sales, for 2025 and 2030, at European level, based on different
 forecasting scenarios.

 The results show an improvement on market sales at 2030 both for BEV and for PHEV
 segment, which account a total share between 6 to 36%.
 2.3. Italian level

 The forecasting scenarios on national level are developed by some national and in-
 ternational agencies operating in energy, mobility and environmental sectors, such as:

 • Cambridge Econometrics [24], from which are extracted two main scenarios, follow-
 ing presented as CAM (Tech) and CAM (Tech Rap);
 • Politecnico di Milano [26], with three scenarios classified as: POLIMI (b – base),
 POLIMI (m – moderate) and POLIMI (a – rapid);

 CAM (Tech) scenario allows to reach the average fuel emission target set by Euro-
 pean directive (DAFI) while, with a faster deployment of advanced powertrain achieved
 in CAM (Tech Rapid) scenario, new cars registration in 2030 meet 25 CO2/km emission.
 The report by Politecnico di Milano presented an analysis based on vehicle stock
 gained for each forecasting years. POLIMI (b) assumes a total volume of 2 million cars in
 circulation in 2030 whereas the future fleet for the other scenarios increase up to 5 million
 and 7.5 million, respectively for POLIMI (m) and POLIMI (a).
 Figure 5 shows the results of the comparison among the scenarios before listed in
 terms of estimated average BEV and PHEV penetration index on car sales, for 2025 and
 2030, at Italian level.
Preprints (www.preprints.org) | NOT PEER-REVIEWED | Posted: 1 July 2021 doi:10.20944/preprints202107.0037.v1

 80% BEV PHEV
 70%

 60%

 50%

 40%

 30%

 20%

 10%

 0%
 2025

 2030

 2025

 2030

 2025

 2030

 2025

 2030

 2025

 2030
 CAM (tech) CAM (tech rap) POLIMI (b) POLIMI (m) POLIMI (a)

 Figure 5. Estimated average BEV and PHEV penetration index on car sales, for 2025 and 2030, at Italian level, based on different
 forecasting scenarios.

 The sales shares for BEV models in Italy vary between 14 to 54% by 2030, for PHEV
 ones the forecasts indicate a value among 6 to 34%.

 3.4. Definition of reference forecasting scenarios for the case study
 Two scenarios have been identified as reference taking in consideration the studies
 listed above. Given the number and variability of studies, it is necessary to condensate
 forecasts into a range in which the demand of local electric mobility is presumed to vary.
 The range is delimited by two scenarios making up the envelope in which electric mobility
 is forecasted to vary in the 2030 horizon, so defined:

 • Conservative scenario: significant incentive policies are not considered, and it is in
 line with the basic one of the Politecnico di Milano study [26], which envisages the
 least expansion;
 • PNIEC scenario: it is in line with the objectives on electrical mobility included in Ital-
 ian Integrated National Plan for Energy and Climate (Piano Nazionale Integrato per l’Ener-
 gia e il Clima 2030, PNIEC) [27] (to have 6 000 000 EVs circulating in 2030), conse-
 quently, it is the upper limit for the demand for Italian electric mobility in 2030.

 The conservative scenario considers a total of 2 000 000 EVs circulating in 2030, of
 which 1 200 000 BEVs and 800 000 PHEVs. Figure 6 shows the estimated average BEV and
 PHEV penetration index on car sales from 2020 to 2030 at Italian level. Therefore, the con-
 servative scenario envisages a market share on sales of approximately 15% for BEVs and
 10% for PHEVs by 2030, having assumed constant annual sales equal to 1.95 million vehi-
 cles per year. Figure 7 shows the estimated average BEV and PHEV penetration index on
 car fleet from 2020 to 2030 at Italian level, with values equal to approximately 2.7% of BEV
 and 1.7% of PHEV.
Preprints (www.preprints.org) | NOT PEER-REVIEWED | Posted: 1 July 2021 doi:10.20944/preprints202107.0037.v1

 25% BEV - Conservative PHEV - Conservative

 20%

 15%

 10%

 5%

 0%
 2020 2021 2022 2023 2024 2025 2026 2027 2028 2029 2030

 Figure 6. Estimated average BEV and PHEV penetration index on car sales from 2020 to 2030 at Italian level (conservative scenario)

 BEV - Conservative PHEV - Conservative

 5%
 4%
 3%
 2%
 1%
 0%
 2020 2021 2022 2023 2024 2025 2026 2027 2028 2029 2030

 Figure 7. Estimated average BEV and PHEV penetration index on car stocks from 2020 to 2030 at Italian level (conservative
 scenario)

 The PNIEC foresees the effectiveness of investments in electric vehicles in 5-7 years,
 hence an overall diffusion of roughly 6 million of EVs, of which 4 million of pure EVs
 (BEV) and 2 million of hybrid EVs, by 2030. Assuming this target is achieved, there will
 be 44 million vehicles circulating with 14% made up of EVs (BEV or PHEV) in 2030. The
 trend for the intervening years has been calculated by interpolating data with a logistic
 curve (sigmoidal), whose equation is:

 ( ) = −
 1 + −

 The assumptions assumed to uniquely determine the equation are as follows: the
 choice of the horizontal asymptote, represented by the constant Y, is carried out imposing
 for every typology a saturation level in the new registration in line with the values pre-
 sented in the analyzed reports, for which the phase-out year in the sale of conventional
 technology is set at 2040 with a ratio of BEV to PHEV equal to 2:1.

 • the cars sold in 2019, for every typology, is obtained from the historical analysis;
 • the cars sold in the horizon year 2030 is such as to make the fleet in circulation reach
 the corresponding value for the scenario considered.

 As shown in Figure 8, the PNIEC scenario envisages a penetration index of sales of
 about 50% of BEV and 25% of PHEV, having assumed the total annual sales as constant
Preprints (www.preprints.org) | NOT PEER-REVIEWED | Posted: 1 July 2021 doi:10.20944/preprints202107.0037.v1

 and approximately equal to 1,95 million of vehicles/year. The penetration index on the car
 fleet is shown in Figure 9 and it is about 9% of BEV and 4.5% of PHEV.

 Figure 8. Estimated average BEV and PHEV penetration index on car sales from 2020 to 2030 at Italian level (PNIEC scenario).

 Figure 9. Estimated average BEV and PHEV penetration index on car stocks from 2020 to 2030 at Italian level (PNIEC scenario).

 The market share of BEVs and PHEVs in the two developed scenarios is, for the years
 between 2020 and 2030, in Figure 10, where a comparison with the various literature sce-
 narios is also reported.
Preprints (www.preprints.org) | NOT PEER-REVIEWED | Posted: 1 July 2021 doi:10.20944/preprints202107.0037.v1

 Figure 10. Comparison of estimated average penetration index on Italian car sales in 2025 and 2030, for the different scenarios,

 4. Forecasting of Rome-Fiumicino airport EVs development scenarios
 4.1. Data and methodology
 From the scenarios defined for the international and national level, a methodology is
 defined to deduce the evolution of landside mobility for the Rome-Fiumicino airport. The
 context is peculiar due to the different distribution of vehicle clusters (private vehicles,
 taxis, chauffeurs, buses) compared to national data.
 Supplemental data are used to support the analysis, which are as follows:
 • Characterization of parking areas (via satellite imaging of public domain);
 • Identification of internal collective transport lines (shuttles);
 • Identification of public transport line;
 • Data on stops in 2019 (duration, number of vehicles, and registration plates);
 • Hourly detection of private traffic flows.

 The main steps of the methodology are as follows:

 • Analysis of the consistency of parking areas (via identification of areas from satellite
 imaging and allocation to cluster of users) to allocate charging points;
 • Analysis of the duration of stops (from data provided by ADR) to allocate type of
 charging points (slow/fast charging);
 • Analysis of vehicle age distribution (from license plate data provided by ADR) to
 estimate the renewal rate by cluster and the consequent EV penetration;
 • Estimation of EV access number by cluster; obtained by combining the age distribu-
 tion profiles with the sales forecasts derived from the analysis of the scenarios.

 A block diagram summarizing the main steps of the methodology is in Figure 11.
Preprints (www.preprints.org) | NOT PEER-REVIEWED | Posted: 1 July 2021 doi:10.20944/preprints202107.0037.v1

 Figure 11. Summary of forecast methodology

 Access data on license plates and duration of stops are provided by AdR Mobility
 [28] for multi-story and long stop car parks, while data on car parks for employees are not
 available. Data include license plate, duration of stop, and date and time of entry and exit.
 Only the first two letters of license plates (in the Italian format AA 000 AA) were ac-
 quired for the sake of privacy. Registration date was then estimated via linear interpola-
 tion on registration of license plates. Results show a concentration of stops shorter than 30
 minutes for cars newer than one year, which is ascribed to rental cars crossing the multi-
 story parking: To filter data, only stops longer than 30 minutes are considered.
 Combining the age distribution profiles and EV sales forecast for the two reference
 scenarios, the percent of EV accessing airport car parks in the time horizon can be esti-
 mated, as follows:

 = ∑
 =1
 where: pi is the number of EV registered in the year I, qi is the number of vehicles, regis-
 tered in the year i, in the car parks; and n is the time horizon, chosen as 10 years. A similar
 forecast is performed for other clusters (chauffeurs, taxis, and rental cars), assuming:

 • An expected life of 5 years for taxi cars;
 • An expected life of 2.5 years for a rental car;
 • The same age profile for airport operators’ vehicles as those of passengers;
 • Saturation of the logistic curve 5 years forward for taxis and chauffeurs compared to
 private cars.
 4.2. Results
 Parking areas can be divided by type of users (employees or passengers) or by dura-
 tion (long or shortstop). Passenger parking areas are the multi-story car parks (A to D),
 the long stay car park, and the kiss-and-go car park. Other parking areas are the chauffeur
 buffer, the taxi buffer, the bus buffer, the car park for employees, and the car park for
 rental cars. The distribution of parking areas by type is reported in Figure 12.

 Figure 12. Allocation of car park spaces
Preprints (www.preprints.org) | NOT PEER-REVIEWED | Posted: 1 July 2021 doi:10.20944/preprints202107.0037.v1

 Figure 13 reports the distribution of stop durations. The data show about 2.2 million
 stops in 2019, resulting in a total duration of about 23 million hours. The number of very
 short stops is due to rental cars and kiss-and-go stops.

 1,200,000

 1,000,000
 Total accesses in 2019

 800,000

 600,000

 400,000

 200,000

 0
 0 to 0.3 h

 0.5 to 1 h

 1 to 2 h

 2 to 3 h

 3 to 4 h
 0.3 to 0.5 h

 50 to 100 h
 4 to 25 h

 25 to 50 h

 100 to 500 h

 More than 500 h
 Duration

 Figure 13. Stop duration distribution

 Vehicle age distributions for the airport and the province of Rome are compared in
 Figure 14. The difference is due to two causes:

 • Vehicles accessing airport car parks (particularly the multi-story car park) are often
 company cars which are usually replaced more frequently than private cars;
 • Old cars travel less kilometers per year, while users travelling much are forced to
 replace car frequently due to wear, thus newer cars are likely to be a significant part
 of airport car park use.

 The comparison shows that the age profile of car stock differs from that of vehicles
 accessing the airport. Thus, a preliminary sizing of charging infrastructure cannot be car-
 ried out simply based on car fleet data, but the specific context must be considered.

 Figure 15 reports the distribution of stop durations by vehicle age.
Preprints (www.preprints.org) | NOT PEER-REVIEWED | Posted: 1 July 2021 doi:10.20944/preprints202107.0037.v1

 Province of Rome Registration Parking > 0,5 hours

 0.16

 0.14

 0.12

 0.10

 0.08

 0.06

 0.04

 0.02

 0.00
 1994
 1995
 1996
 1997
 1998
 1999
 2000
 2001
 2002
 2003
 2004
 2005
 2006
 2007
 2008
 2009
 2010
 2011
 2012
 2013
 2014
 2015
 2016
 2017
 2018
 2019
 ante 1993

 Figure 14. Comparison of vehicle registration distribution (Rome-Fiumicino airport vs province of Rome)

 Duration < 0.5 h 0.5 < Duration < 4 h Duration > 4 h Duration > 0.5 h

 40%

 30%

 20%

 10%

 0%
 < 1 year 1 year 2 years 3 years 4 years 5 years 5 < years < 10 > 10 years

 Figure 15. Distribution of stop duration by vehicle age.

 The EV penetration forecast is reported for private cars (Figure 16), taxis and chauf-
 feurs (Figure 17), and rental cars (Figure 18).
Preprints (www.preprints.org) | NOT PEER-REVIEWED | Posted: 1 July 2021 doi:10.20944/preprints202107.0037.v1

 BEV PNIEC PHEV PNIEC BEV CONS PHEV CONS

 50%

 40%

 30%

 20%

 10%

 0%
 2020
 2020

 2021
 2021

 2022
 2022

 2023
 2023

 2024
 2024

 2025
 2025

 2026
 2026

 2027
 2027

 2028
 2028

 2029
 2029

 2030
 2030
 Figure 16. EVs penetration index forecast for Rome-Fiumicino airport for private cars.

 BEV PNIEC PHEV PNIEC BEV CONS PHEV CONS

 60%

 50%

 40%

 30%

 20%

 10%

 0%
 2020
 2020

 2021
 2021

 2022
 2022

 2023
 2023

 2024
 2024

 2025
 2025

 2026
 2026

 2027
 2027

 2028
 2028

 2029
 2029

 2030
 2030

 Figure 17. EVs penetration index forecast for Rome-Fiumicino airport for taxis and chauffeurs.
Preprints (www.preprints.org) | NOT PEER-REVIEWED | Posted: 1 July 2021 doi:10.20944/preprints202107.0037.v1

 BEV PNIEC BEV CONS

 90%

 80%

 70%

 60%

 50%

 40%
 2020
 2020

 2021
 2021

 2022
 2022

 2023
 2023

 2024
 2024

 2025
 2025

 2026
 2026

 2027
 2027

 2028
 2028

 2029
 2029

 2030
 2030
 Figure 1813. EV penetration index forecast for Rome-Fiumicino airport for rental cars.

 5. Preliminary sizing of charging infrastructure
 The total number of charging stations can be calculated according to the following
 formula:
 = ∙ ∙ ∙ ℎ
 Where is the total vehicle capacity of the parking area, is the percentage
 of BEV and PHEV vehicles on the total number of vehicles, is the ratio between
 the recorded or estimated maximum occupancy of the parking and its total vehicle capac-
 ity (in a preliminary analysis this can be considered 1), ℎ is the share of EVs that
 actually uses the charging infrastructure. Evaluating the last is more complex, since there
 are no data on typical EVs owner charging behavior in airport parking yet. The best ap-
 proach, in this case, is to start with a conservative value of 1 and perform periodic evalu-
 ations of the parameter once the infrastructure deployment starts and real data become
 available. Given the predicted steep rise in the number of EVs, even a significant oversiz-
 ing of the initial deployment can be easily compensated by slightly delaying the following
 phases of infrastructure deployment.
 For passenger vehicles, it is also possible to differentiate between fast and slow charg-
 ing station. The proposed method is to use the data of parking area usage by class of park
 duration, for this purpose, only two clusters are relevant, that of parking lasting less than
 two hours and that of parking lasting more. The analysis of data allows getting the share
 of share of total parking spot usage by duration reported in Table 1.

 Table 1. Share of total parking spot usage by duration

 Parking duration Share of total parking spot usage*
 2h 97,2%
 *Parking spot usage is the product of the number of parking spots and their duration of usage

 Combining this data with the prospected share of BEVs and PHEVs, the total share
 of fast charging stations can be calculated as:
 ℎ = % ∙ %
Preprints (www.preprints.org) | NOT PEER-REVIEWED | Posted: 1 July 2021 doi:10.20944/preprints202107.0037.v1

 where % is the share of BEVs, % is the share of total parking spot usage by
 vehicles parking less than 2 hours. The main assumptions are that no PHEV uses fast
 charging stations and that only BEVs parking for less than 2 hours are potential users of
 fast charging stations (P>22kW). It is also assumed that parking spaces reserved for long
 stays will only have slow charging stations. The results in terms of EVs charging stations
 number forecasting are summarized in Table 2.

 Table 2. EVs charging stations number forecasting

 Horizon Parking category Slow charging stations Fast charging stations
 Conservative Scenario 2025 Multi storey park 354 14
 Long stay park 270 0
 2030 Multi storey park 1.494 56
 Long stay park 1.137 0
 PNIEC Scenario 2025 Multi storey park 645 26
 Long stay park 492 0
 2030 Multi storey park 2.939 108
 Long stay park 2.235 0
 Evaluating the impact on the airport power systems and the need of upgrading the
 present electrical infrastructure is the subject of ongoing research.
 Concerning free shuttles for passengers and employees, the present electrification
 plan already envisages the implementation of 10 charging stations, 88 kW each, with total
 power 880 kW, assuming unitary simultaneity factor.

 6. Conclusions
 The electrification of the automotive industry is ongoing, as a mean to reduce envi-
 ronmental impact of transports. Being airports major transportation hubs, operators are
 interested in forecasting the demand for electrical mobility associated with airport opera-
 tion, to be prepared for the adaptation of the infrastructure. In this work, the authors pro-
 poses a methodology for estimating the evolution of the demand for electric mobility in
 an international airport (Rome-Fiumicino, Italy) in the near future and the consequent
 demand for charging infrastructure. First, a wide review of proposed scenarios on the
 penetration of EVs at international and national level and available data on local automo-
 tive transport are presented, as preliminary study for the definition of reference scenarios
 for the local context. Then the methodology proposed is presented and applied to the spe-
 cific case study. Finally, a preliminary sizing of the required charging infrastructure is
 reported. The proposed approach can be considered as reference for similar studies on
 electrical mobility in other airport areas around the world.

 Author Contributions: Conceptualization, P.C., V.C., M.C.F. and F.S.; methodology, R.A. and M.M.;
 validation, P.C., V.C.,, M.C.F. and F.S.; formal analysis, R.A., M.C.F., M.M. and F.S.; investigation,
 R.A., S.B., J.L, and M.M.; resources, R.A., M.M., P.C. and V.C.,; data curation, R.A., S.B., J.L., and
 M.M.; writing—original draft preparation, R.A., S.B., J.L., and M.M.; writing—review and editing,
 M.C.F. and F.S.; visualization, J.L.; supervision, ,P.C., V.C., M.C.F. and F.S.; project administration,
 P.C., V.C., M.C.F. and F.S. All authors have read and agreed to the published version of the manu-
 script.
 Funding: This research received no external funding.
 Conflicts of Interest: The authors declare no conflict of interest.

 References
Preprints (www.preprints.org) | NOT PEER-REVIEWED | Posted: 1 July 2021 doi:10.20944/preprints202107.0037.v1

 1. Uherek, E.; Halenka, T.; Borken-Kleefeld, J.; Balkanski, Y.; Berntsen, T.; Borrego, C.; Gauss, M.; Hoor, P.; Juda-Rezler, K.;
 Lelieveld, J., et al. Transport impacts on atmosphere and climate: Land transport. Atmospheric Environment 2010, 44, 4772-
 4816, doi:https://doi.org/10.1016/j.atmosenv.2010.01.002.
 2. Yuan, X.; Li, X. Mapping the technology diffusion of battery electric vehicle based on patent analysis: A perspective of global
 innovation systems. Energy 2021, 222, 119897, doi:https://doi.org/10.1016/j.energy.2021.119897.
 3. González Palencia, J.C.; Nguyen, V.T.; Araki, M.; Shiga, S. The Role of Powertrain Electrification in Achieving Deep
 Decarbonization in Road Freight Transport. Energies 2020, 13, doi:10.3390/en13102459.
 4. González Palencia, J.C.; Araki, M.; Shiga, S. Energy consumption and CO2 emissions reduction potential of electric-drive
 vehicle diffusion in a road freight vehicle fleet. Energy Procedia 2017, 142, 2936-2941,
 doi:https://doi.org/10.1016/j.egypro.2017.12.420.
 5. Wesseling, J.H.; Faber, J.; Hekkert, M.P. How competitive forces sustain electric vehicle development. Technological
 Forecasting and Social Change 2014, 81, 154-164, doi:https://doi.org/10.1016/j.techfore.2013.02.005.
 6. Gnann, T.; Stephens, T.S.; Lin, Z.; Plötz, P.; Liu, C.; Brokate, J. What drives the market for plug-in electric vehicles? - A review
 of international PEV market diffusion models. Renewable and Sustainable Energy Reviews 2018, 93, 158-164,
 doi:https://doi.org/10.1016/j.rser.2018.03.055.
 7. Kong, D.; Xia, Q.; Xue, Y.; Zhao, X. Effects of multi policies on electric vehicle diffusion under subsidy policy abolishment
 in China: A multi-actor perspective. Applied Energy 2020, 266, 114887, doi:https://doi.org/10.1016/j.apenergy.2020.114887.
 8. Trencher, G. Strategies to accelerate the production and diffusion of fuel cell electric vehicles: Experiences from California.
 Energy Reports 2020, 6, 2503-2519, doi:https://doi.org/10.1016/j.egyr.2020.09.008.
 9. Plötz, P.; Gnann, T.; Wietschel, M. Modelling market diffusion of electric vehicles with real world driving data—Part I:
 Model structure and validation. Ecological Economics 2014, 107, 411-421.
 10. IEA. Global EV Outlook 2019; IEA: 2021.
 11. Liu, X.; Bie, Z. Optimal Allocation Planning for Public EV Charging Station Considering AC and DC Integrated Chargers.
 Energy Procedia 2019, 159, 382-387, doi:https://doi.org/10.1016/j.egypro.2018.12.072.
 12. Liu, J.-p.; Zhang, T.-x.; Zhu, J.; Ma, T.-n. Allocation optimization of electric vehicle charging station (EVCS) considering with
 charging satisfaction and distributed renewables integration. Energy 2018, 164, 560-574,
 doi:https://doi.org/10.1016/j.energy.2018.09.028.
 13. Pal, A.; Bhattacharya, A.; Chakraborty, A.K. Allocation of electric vehicle charging station considering uncertainties.
 Sustainable Energy, Grids and Networks 2021, 25, 100422, doi:https://doi.org/10.1016/j.segan.2020.100422.
 14. Ajanovic, A.; Siebenhofer, M.; Haas, R. Electric Mobility in Cities: The Case of Vienna. Energies 2021, 14, 217.
 15. Ruggieri, R.; Ruggeri, M.; Vinci, G.; Poponi, S. Electric Mobility in a Smart City: European Overview. Energies 2021, 14,
 doi:10.3390/en14020315.
 16. Sanguesa, J.A.; Torres-Sanz, V.; Garrido, P.; Martinez, F.J.; Marquez-Barja, J.M. A Review on Electric Vehicles: Technologies
 and Challenges. Smart Cities 2021, 4, 372-404, doi:10.3390/smartcities4010022.
 17. Xiang, Y.; Cai, H.; Liu, J.; Zhang, X. Techno-economic design of energy systems for airport electrification: A hydrogen-solar-
 storage integrated microgrid solution. Applied Energy 2021, 283, 116374, doi:https://doi.org/10.1016/j.apenergy.2020.116374.
 18. Silvester, S.; Beella, S.K.; van Timmeren, A.; Bauer, P.; Quist, J.; van Dijk, S. Exploring design scenarios for large-scale
 implementation of electric vehicles; the Amsterdam Airport Schiphol case. Journal of Cleaner Production 2013, 48, 211-219,
 doi:https://doi.org/10.1016/j.jclepro.2012.07.053.
 19. Wikipedia - List of the busiest airports in Europe. Availabe online:
 https://en.wikipedia.org/wiki/List_of_the_busiest_airports_in_Europe (accessed on Jan 2021).
 20. Assaeroporti. Statistiche Dati di Traffico Aeroportuale Italiano. Availabe online: https://assaeroporti.com/statistiche/
 (accessed on Jan 2021).
Preprints (www.preprints.org) | NOT PEER-REVIEWED | Posted: 1 July 2021 doi:10.20944/preprints202107.0037.v1

 21. Italian Civil Aviation Authority. Rome-Fiumicino Master Plan. 2016.
 22. Mosquet, X.; Dinger, A.; Xu, G.; Andersen, M.; Tominaga, K.; Zablit, H. The Electric Car Tipping Point; 11 Jan 2018, 2021.
 23. BloombergNef. BNEF EVO Report 2020; @BloombergNEF: 2021.
 24. Cambridge Econometrics. Low-carbon cars in Europe: A socio-economic assessment; Feb 2018.
 25. Bannon, E. Electric surge: Carmakers' electric car plans across Europe 2019-2025; Transport & Environment: 2021.
 26. Politecnico di Milano. E-MOBILITY REPORT 2018 - Le opportunità e le sfide per lo sviluppo della mobilità elettrica in Italia;
 Politecnico di Milano,: Sep 2018.
 27. Italian Ministry of Economic Development; Italian Ministry of the Environment and Protection of Natural Resources and
 the Sea; Italian Ministry of Infrastructure and Transport. Piano Nazionale Integrato per l’Energia e il Clima 2030. Italy, 2019.
 28. AdR Mobility. 2020.
You can also read