Fast High-Resolution Mass Spectrometry and Chemometrics for Evaluation of Sensory Parameters of Commercial Coffee Blends
←
→
Page content transcription
If your browser does not render page correctly, please read the page content below
Brazilian Journal of Analytical Chemistry
2021, Volume 8, Issue 32, pp 91–106
doi: 10.30744/brjac.2179-3425.AR-11-2021

ARTI CLE

 Fast High–Resolution Mass Spectrometry
 and Chemometrics for Evaluation of Sensory
 Parameters of Commercial Coffee Blends
 Victor Gustavo Kelis Cardoso1            , Guilherme Post Sabin1,2         , Leandro Wang Hantao1*
 1
   Instituto de Química, Universidade Estadual de Campinas, Rua Monteiro Lobato, 270, 13083-862, Campinas,
 SP, Brazil
 2
   OpenScience, Rua Conceição, 233, Sala 916, Centro, Campinas, SP, Brazil

                                                                 This study presents a fast method to
                                                                 estimate sensory parameters of commercial
                                                                 capsules of roasted coffee using flow
                                                                 injection analysis coupled to high–resolution
                                                                 mass spectrometry (FIA–HRMS) as an
                                                                 alternative to traditional sensory analysis,
                                                                 which is a laborious and subjective method.
                                                                 Over 25 types of coffee capsules were
                                                                 studied. The samples were partitioned into
                                                                 an aqueous and organic extract, which were
                                                                 analyzed by FIA–HRMS in the positive and
                                                                 negative ionization modes. Data fusion of
                                                                 such mass spectra was performed to explore
                                                                 the complementary information of sample
preparation and ionization conditions. Orthogonalized partial least square discriminant analysis (OPLS–
DA) models were built and trained to determine the type of capsule and to estimate important coffee
parameters (e.g., acidity, bitterness, body, intensity, and roasting level), achieving accuracy values higher
than 91.1%. In addition, variable importance in projection (VIP) scores enabled assignment of the elemental
composition and, in some cases, putative identification of compounds in coffee (e.g., caffeine, caffearine,
and quinides) that exhibited an important role in class discrimination.

Keywords: chemical fingerprint, chemometrics, food and beverage analysis, high throughput, sensory
assessment.

INTRODUCTION
    Coffee is one of the most consumed beverages worldwide, attracting a large number of consumers due
to its enjoyable flavor [1-3]. Coffee has played an important role in the global economy with a total trade
of US$30 bi in 2019 [4]. In the same year, Brazil was the top exporter of coffee responsible for almost half

Cite: Cardoso, V. G. K.; Sabin, G. P.; Hantao, L. W. Fast High–Resolution Mass Spectrometry and Chemometrics for Evaluation
of Sensory Parameters of Commercial Coffee Blends. Braz. J. Anal. Chem., 2021, 8 (32), pp 91–106. doi: http://dx.doi.
org/10.30744/brjac.2179-3425.AR-11-2021

Submitted 20 January 2021, Resubmitted 12 April 2021, Accepted 20 April 2021, Available online 03 May 2021.

                                                            91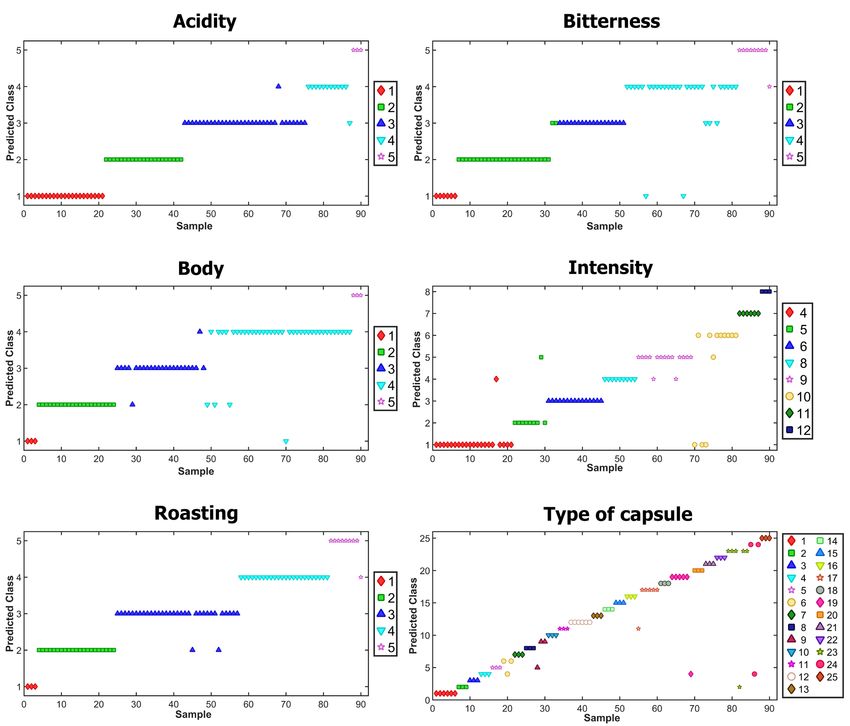
Cardoso, V. G. K.; Sabin, G. P.; Hantao, L. W.

of the global trade together with Vietnam, Colombia, Germany, and Switzerland, in this order of export
volume [4]. In this context, the coffee industry requires extensive and oriented product development to
meet current consumer demands in an ever increasing and diversified coffee market. Numerous types
of coffee can be prepared by blending different types of coffee and/or modifying process parameters to
increase the quality and improve the sensory coverage of the product.
    The evaluation of coffee relies on sensory analysis by estimating their acidity, bitterness, and body, for
instance. Sensory assessment is the characterization of products based on their organoleptic properties
using the five human senses [5]. This process is based on a range of methods to obtain responses about
taste, smell, texture, appearance, and other properties [5]. However, sensory analysis is a complex and
time-consuming task that depends on professional tasters [6]. Despite the rigorous training of the sensory
panel, sensory analysis remains a very subjective process and it is affected by physiological and physical
factors, which may result in low accuracy and poor repeatability [6,7]. In the coffee industry, sensory
analysis is even more challenging due to the overwhelming quantity of samples [7].
    Alternatives to sensory analysis are instrumental techniques that have been applied to estimate the
sensory parameters of coffee, like vibrational spectroscopy [8,9] and chromatography coupled to mass
spectrometry (MS) [10-12]. The former approach may be limited by the low selectivity of the analytical
signal, while chromatographic methods may struggle to provide compatible sample throughput required
for large studies, such as over 200 samples per day. An interesting alternative to contemporary techniques
is direct analysis using high-resolution mass spectrometry (HRMS) for fingerprinting purposes. After
suitable sample preparation, HRMS analyses can provide molecular-level information in just a few
seconds [13-16], which is an important feature for coffee analysis. Liquid samples may be introduced
into the HRMS by flow injection analysis (FIA–HRMS), providing fast and reliable results [15,17]. FIA–
HRMS–based methods have been successfully applied in the analysis of glyphosate in fruits, berries,
and cereals [18], milk adulteration [19], discrimination of peppermints [20], and aerosols assessment in
tobacco products [21].
    Despite the obvious advantages of HRMS, the direct analysis may be unsuitable for the identification
of sensory active compounds, providing instead only putative identification. In order to fully explore the
potential of HRMS for fingerprinting, multivariate data analysis is mandatory to establish meaningful and
statistically valid correlations between mass spectra and sensory properties, especially if very large data
comprising hundreds of mass spectra are available for chemometric modeling [15-17].
    In this study, we report an analytical method for coffee classification using FIA–HRMS and chemometric
modelling. The FIA–HRMS provided the ideal platform for high sample throughput analyses compatible
with the logistics of a typical coffee cooperative. OPLS–DA [22] was used to train the statistical model and
predict the sensory properties of coffee samples using the MS–based coffee fingerprinting [23]. Important
properties were successfully assigned using the OPLS–DA model, like the type of capsule and many
sensory parameters (e.g., acidity, bitterness, body, intensity, and roasting level). We believe that this
solution represents an important development in the coffee industry, providing rigorous quality control and
intelligence for coffee production, moving towards the industry 4.0 [24].

MATERIALS AND METHODS
Reagents
   Water, methanol, chloroform, formic acid, and acetonitrile (Chromasolv – MS grade) were purchased
from Honeywell Riedel–de–Haën™ (Germany). Ultrapure water (resistivity below 18.2 MΩ.cm and TOC
below 5 ppb) was obtained from a Milli–Q® purifier (Millipore®, USA). All the materials used in the analytical
procedures were carefully washed using MS grade solvents and/or ultrapure water.

Coffee samples
   The study used 25 capsules of espresso coffee produced by the same manufacturer, containing different
blends and sensory properties. The samples were purchased in the local market. The manufacturer

                                                     92
Braz. J. Anal. Chem., 2021, 8 (32), pp 91–106.

provided coffee blend information about acidity, bitterness, body, intensity, and roasting on its website,
which is also available in Table S1 (Supplementary Material). The samples were analyzed in triplicates on
the same day over three different days, totalizing 9 analyses per sample. For 25 samples, 225 analyses
were performed.

Sample preparation
   Approximately 100 mg of coffee from the capsule was weighed in analytical balance ATX–224
(Shimadzu Corporation, Japan) and placed in 2 mL Eppendorf Tubes. The compounds were extracted
using a modified Folch method through a ultrasound assisted dispersive liquid-liquid microextraction (UA-
DLLME) [25,26], which was performed by adding a mixture of 400 µL of water and 400 µL of methanol, and
then 800 µL of chloroform. The extractions were assisted by ultrasound for 15 min in an Q5.9L ultrasound
bath (Eco–Sonics, Brazil), followed by vortexing at 3200 rpm during 15 min in a Vortex–Genie 2 (Scientific
Industries, United States), and centrifuged at 13400 rpm for 15 min in a MiniSpin® (Eppendorf, Germany).
After phase separation, the organic extract was composed of chloroform and the aqueous extract was
a mixture of water and methanol. Each extract was filtered through Millex® syringe filters (Merck, United
States) with a diameter of 13 mm and 0.22 µm pore size membranes, being polyvinylidene fluoride (PVDF)
and polytetrafluoroethylene (PTFE) membranes to filtrate aqueous (hydrophilic) and organic (hydrophobic)
extracts, respectively. Aliquots containing 80 µm of extract were transferred to 2 mL vials and diluted 1–20
with acetonitrile for the organic extract, and 1:1 (v/v) acetonitrile:water solution for the aqueous extract.
After those steps of sample preparation, the samples were analyzed by FIA–HRMS. Blank samples were
prepared using the extraction procedure without powdered coffee.

Instrumentation
   The analyses were performed using a Xevo G2–XS hybrid quadrupole time–of–flight sequential mass
spectrometer (QTOFMS) (Waters Corporation, United States). The FIA system employed an ultra–
high performance liquid chromatography (UHPLC) to introduce the sample into the QTOF. The UHPLC
autosampler was directly connected to the electrospray ionization (ESI) source, bypassing the use of a
chromatographic column. An injection volume of 0.3 µL and a constant volumetric flow rate of 100 µL
min– 1 were used for the analyses. The mobile phase was water acidified with 0.1% (v/v) formic acid.
Each sample extract (organic and aqueous) was analyzed separately using ESI in the positive (ESI+) and
negative (ESI–) modes. The mass spectra were recorded from 100 Da to 1000 Da in the high–resolution
mode. The mass resolving power was approximately 30,000 at m/z 400. The interested reader is directed
elsewhere for a complete description of the MS conditions [25,26]. A total of four mass spectra per sample
were available for modelling. Before the analysis, a system suitability check was performed, i.e., detector
check and mass calibration. A solution of leucine enkephalin (1 µg mL–1) was used for mass correction.

Data analysis
    By combinatorics, two extraction phases and two ionization modes provided four blocks of mass spectra,
which were imported to MATLAB R2016b (MathWorks, United States). These blocks were normalized
by the length and concatenated into a unique data matrix by data fusion of the individual MS analyses,
containing 5253 m/z signals for each one of 225 fused mass spectra. The m/z peaks were filtered by
removing signals with relative intensity lower than 0.001%. Next, the signals were scaled by Pareto scaling
to reduce signal magnitude (mask effect) without amplifying deviations and spectral noise. The 225 mass
spectra were randomly organized and divided into training (60%) and validation (40%) data, being 135 and
90 spectra, respectively. Also, we have kept the same-day replicates together.
    PLS_Toolbox 8.6 (Eigenvector, United States) was used to train the OPLS–DA [22] models for each
property modelled (i.e., acidity, bitterness, body, intensity, and roasting level, and type of capsule). To train
discriminant analysis models through OPLS, we have used OPLS2–DA, which models the classes through
a single model instead of the OPLS1–DA, which models the classes singly. The selection of the number

                                                       93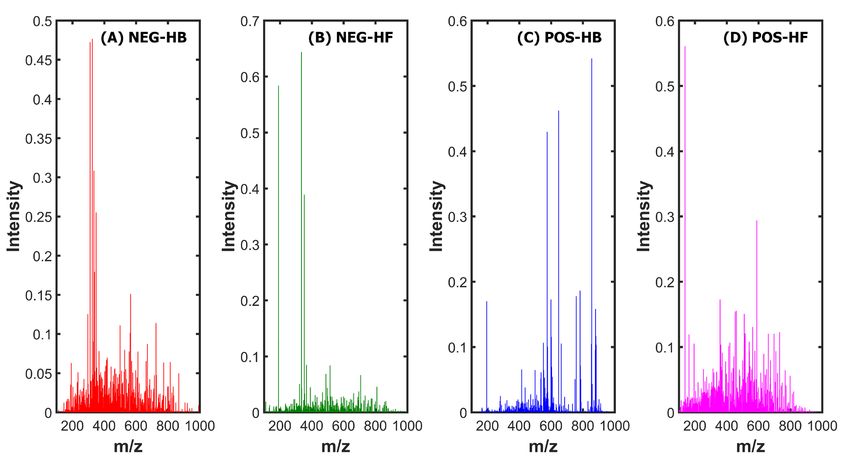
Fast High–Resolution Mass Spectrometry and Chemometrics for Evaluation of
Sensory Parameters of Commercial Coffee Blends

of latent variables (LV) was according to the lowest average error of cross–validation (CV), which was
performed by 10–fold venetian blinds. To ensure no overfitting in the trained models, the permutation test
was performed by random permutation of sample labels for 50 times, aiming to find significant differences
between permuted and unpermuted models [15,27]. The VIP score algorithm was applied to identify the
most important variables for class discrimination, providing a suitable variable selection [28,29]. Thus, the
m/z peaks that presented VIP scores below 1 were excluded from the data of each model, since they were
not relevant for class discrimination [28,29]. Finally, the models were trained again, following the same
criterion to select the number of LV.
    The results were evaluated using the accuracy values (Equation 1), instead of the sensitivity and
specificity values, due to the high number of classes. The accuracy takes into account the true positive
(TP), true negative (TN), false positive (FP), and false negative (FN) by predicting the test sets [30].
Sensitivity (Equation 2) and specificity (Equation 3) were also used to evaluate the trained models [30].

                                                                            Equation 1

                                                                            Equation 2

                                                                            Equation 3

RESULTS AND DISCUSSION
FIA-HRMS analysis
   An important concern about sample preparation was the quality of the extraction to obtain a reliable
measurement by preserving the original characteristics of the sample matrix [31,32]. Hence, mild extraction
conditions were employed to avoid sample deterioration and/or contamination. A modified Folch method
[25,26] was used to obtain the hydrophilic and hydrophobic extracts from coffee to increase the molecular
coverage of the mass spectra (i.e., a broad range of polarity and molecular weights). Hydrophilic extraction
promoted the extraction of polar compounds, such as sugars, alkaloids, acids, quinides, and polyphenols
[11]. Conversely, hydrophobic extraction promoted the extraction of nonpolar compounds, such as fatty
acids, terpenes, and carotenoids [11]. Figure 1 shows the mass spectra of a COL sample highlighting the
diversity of m/z peaks according to the ionization mode and extraction steps. Each block of mass spectra
contained important and complementary information for class discrimination. Therefore, the individual
blocks were normalized and concatenated for chemometric modelling using data fusion.

                                                          94
Braz. J. Anal. Chem., 2021, 8 (32), pp 91–106.
Figure 1. Mass spectra of a COL coffee obtained by the FIA–HRMS analysis and (a) hydrophobic extraction and
negative ionization (NEG–HB), (b) hydrophilic extraction and negative ionization (NEG–HF), (c) hydrophobic
extraction and positive ionization (POS–HB), and (d) hydrophilic extraction and positive ionization (POS–HF).
OPLS–DA models for sensory parameter evaluation
OPLS–DA models were trained for each sensory property evaluated, namely, acidity, bitterness, body,
intensity, and roasting level, and type of capsule. The number of LV was estimated using CV, as shown
in Figure 2. The high number of LV was explained due to the challenging heterogeneity of the sample
composition and the extremely broad set of sensory properties. For example, the data input consisted of
over 25 types of coffee blends with different species and origins, in addition to the four blocks of mass
spectra (both extraction methods and ionization modes). The permutation test alongside the training sets
ascertained the lack of model overfitting. Noteworthy, the number of LV depended on the sensory property,
ranging from 33 to 57 LVs, which is related to many non-correlated m/z values (Table I), to the variability
of samples (25 types of capsules), and to the number of classes (from 5 to 25 modelled classes). Thus, a
good analytical system must capture various variation sources as cited above, increasing the number of
LV as in these OPLS–DA models. The blocks X and y presented at least 95% and 98% of the cumulative
explained variance, respectively, as shown in Table I.
95Cardoso, V. G. K.; Sabin, G. P.; Hantao, L. W.
Figure 2. The average error of training and CV of OPLS–DA models according to the number of latent variables for
each sensory assessment modelled.
Overall, the models presented an excellent performance to discriminate samples of the validation set,
providing high accuracy values (Table I). The worst models evaluated the bitterness and intensity of coffees,
achieving 91.1% of accuracy due to the misclassification of 8 amongst 90 samples (Figure 3). Conversely,
evaluation of acidity provided the best results with an accuracy of 97.8% with only 2 mismatched from 90
samples (Figure 3). Also, Tables S2–S7 (Supplementary Material) provide the sensitivity and specificity
values for each class and sensory property. Overall, the minimum values were 66.7% for sensitivity
and 93.1% for specificity, but more than 75% of the sensitivity values were higher than 90%, indicating
excellent performance. Such results indicate that the predictive models are well–fitted, i.e., without under–
or overfitting.
96Braz. J. Anal. Chem., 2021, 8 (32), pp 91–106.
Table I. Information about OPLS–DA models and the sensory properties
Cumulative Cumulative
Number of Number of Accuracy of
Parameter variance on variance on
Variables LV validation set (%)
X-block (%) y-block (%)
Acidity 95.22 99.02 1638 33 97.8
Bitterness 95.49 99.03 1500 33 91.1
Body 95.85 99.11 1534 33 93.3
Intensity 97.17 99.15 1778 42 91.1
Roasting Level 95.76 99.23 1625 34 96.7
Type of Capsule 97.83 98.43 2164 57 93.3
The results provided by the models are very promising in the field of coffee analysis due to the high
accuracy in the prediction of non-modelled and external samples (validation sets). This is an advantage
over sensory analysis, which even performed by well–trained tasters are prone to large deviations
between tasters [33,34]. Similarly, mid– [35,36] and near-infrared [8,37] spectroscopy have been used to
estimate parameters of coffee, but achieving high accuracy is still a limitation due to the low selectivity of
the spectral bands. This fact ascertains a benefit of using rich–information MS–based methods to obtain
reliable models. For instance, our acidity model exhibited 97.8% of accuracy, whereas a previous model
featured results with sensibility as low as 75% [35]. In addition, the body model presented in this study
provided 93.3% of accuracy, compared to a previous model with a correlation coefficient lower than 0.8 [8].
The high accuracies provided by FIA–HRMS indicate that this method has high scalability, i.e., it can be
easily automatized, being ideal for industrial applications to analyze coffee. Furthermore, the high sample
throughput is important to significantly expand the number of samples analyzed per day when compared
to conventional sensory analysis [15,21]. Although FIA–HRMS might exhibit a higher capital expenditure
(CAPEX) is substantially higher due to the instrument price, compared to spectroscopy instruments, its
operational expenditure (OPEX) is much more attractive, costing less than US$2 per analysis.
97Fast High–Resolution Mass Spectrometry and Chemometrics for Evaluation of
Sensory Parameters of Commercial Coffee Blends
Figure 3. Predicted classes of validation sets of OPLS–DA models for each sensory assessment.
Evaluation of important variables
VIP scores algorithm was used to evaluate the most important variables to discriminate classes in all
trained models. Table II presents the m/z peaks of the signals with the highest VIP score values alongside
the respective elemental composition. A putative identification was supplied for common analytes found in
coffee. The VIP scores threshold chosen was 4 for acidity, bitterness, body, roasting, and type of capsule,
and 5 for the intensity model due to a larger number of important compounds in the latter.
98Braz. J. Anal. Chem., 2021, 8 (32), pp 91–106.
Table II. VIP assignment of the OPLS-DA models and the sensory properties
Adduct Measured Accurate Empirical Error Putative Property
DBE
type m/z mass formula (ppm) identification modelled
[M-H]- 265.1465 266.1538 C16H18N4 10 4.5 - 4,6
[M-H]- 293.1768 294.1841 C18H22N4 10 0.7 - 4,6
Caffeoyl-quinides
[M-H]- 335.0769 336.0842 C16H16O8 9 0.7 [38,39] and caffeoyl- 1,2,3,4,5,6
shikimic acids [39,40]
Feruloyl-quinides
[M-H]- 349.0926 350.0999 C17H18O8 9 0.8 2,3,4,6
NEG – HB
[38-40]
[M-H]- 353.0912 354.0985 - - - - 1,2,3,5,6
[M-H]- 502.1079 503.1152 - - - - 1,2,4,5
Unknown
[M-H]- 565.3018 566.3091 C25H43O5N8P 9 0.4 monophosphate 1
metabolite
[M-H]- 569.2942 570.3015 - - - - 4
[M-H]- 725.4456 726.4529 - - - - 6
Caffeoyl-quinides
[38,39] and
[M-H]- 335.0766 336.0839 C16H16O8 9 0.2 1,2,3,4,5,6
NEG – HF
caffeoylshikimic acids
[39,40]
[M-H]- 341.8730 342.8803 - - - - 1,2,3,4,5,6
Caffeoylquinic acids
[M-H]- 353.0876 354.0949 C17H18O8 9 0.2 1,2,3,4,5,6
[38-41]
[M+H]+ 195.0883 194.0810 C8H10O2N4 6 6 Caffeine [41] 1,2,3,4,5,6
POS – HB
[M+H]+ 647.4593 646.4520 - - - - 1,2,4,5,6
[M+H]+ 758.5700 757.5627 - - - - 3
[M+H]+ 782.5699 781.5626 - - - - 3
[M+H]+ 138.0557 137.0484 C7H7O2N 5 9.2 Caffearine [41] 1,2,4,5,6
[M+H]+ 138.0767 137.0694 C 5H 7N 5 5 1.4 - 4,6
[M+H]+ 195.0882 194.0809 C8H12O2N4 1 5.5 Caffeine [41] 1,2,4,5,6
POS – HF
[M+H]+ 229.1416 228.1343 C12H20O4 3 5.7 - 6
[M+H]+ 453.1675 452.1602 - - - - 6
[M+H]+ 589.2253 588.2180 - - - - 1,2,4,5,6
[M+H]+ 732.2697 731.2624 - - - - 3,5,6
Properties: 1 – acidity, 2 – bitterness, 3 – body, 4 – intensity, 5 – roasting, 6 – type of capsule. DBE – double bond equivalent.
99Cardoso, V. G. K.; Sabin, G. P.; Hantao, L. W.
Some important peaks assigned by the VIP algorithm (Table II) were tentatively identified using previous
reports of coffee analysis [38-41]. The positive blocks provided information based on nitrogen-containing
compounds in coffee. Caffeine [41], the most famous compound in coffee, presented important relevance
to discriminate classes in the hydrophobic and hydrophilic positive blocks. In turn, caffearine [41], an
alkaloid, also known as trigonelline, presented relevance only in the latter block. The negative block
provided information based on oxygen–containing compounds. Caffeoyl–quinides [38,39] and caffeoyl
shikimic acid [39,40] information presented relevance in both negative blocks, feruloyl–quinides [38-40]
only in the hydrophobic negative block, and caffeoylquinic acids [38-41] only in the hydrophilic negative
block.
CONCLUSIONS
This proof–of–concept study showed that FIA–HRMS combined with OPLS–DA can successfully
estimate parameters of coffee blends, providing high values of accuracy. The models could estimate the
acidity, bitterness, body, intensity, roasting level, and type of capsule with accuracy values higher than
91.1%, indicating excellent performance. The acidity estimation was the best model, achieving 97.8% of
accuracy. VIP scores from OPLS–DA models indicated that various compounds in coffee already described
in the literature, e.g., caffeine, quinides, and caffearine, were responsible for the class discrimination. We
believe that this method has great potential for routine analysis in the coffee industry due to its high–
throughput, scalability, and low OPEX, meeting the requirements of smart production and industry 4.0.
Conflicts of interest
The authors declare there are no conflicts of interest.
Acknowledgements
The São Paulo Research Foundation (FAPESP) [Grant N. 2020/01064-6], National Council for Scientific
and Technological Development (CNPq) [Grant N. 302748/2018-0], Coordination for the Improvement of
Higher Education Personnel (CAPES) (Finance code 001), Waters Corporation are acknowledged for
supporting our research.
REFERENCES
1. Bona, E.; Marquetti, I.; Link, J. V.; Makimori, G. Y. F.; Arca, V. C.; Lemes, A. L.; Ferreira, J. M. G.;
Scholz, M. B. S.; Valderrama, P.; Poppi, R. J. LWT - Food Sci. Technol., 2017, 76, pp 330–336 (https://
doi.org/10.1016/j.lwt.2016.04.048).
2. Forchetti, D. A. P.; Poppi, R. J. Food Anal. Methods, 2020, 13, pp 44–49 (https://doi.org/10.1007/
s12161-019-01502-x).
3. Ayseli, M. T.; Kelebek, H.; Selli, S. Food Chem., 2021, 338, 127821 (https://doi.org/10.1016/j.
foodchem.2020.127821).
4. https://oec.world/en/profile/hs92/coffee?growthSelector=value2&yearSelector2=tradeYear24
[Accessed March 17, 2021].
5. Yu, P.; Low, M. Y.; Zhou, W. Trends Food Sci. Technol., 2018, 71, pp 202–215 (https://doi.org/10.1016/j.
tifs.2017.11.013).
6. Hernández-Ramos, P.; Vivar-Quintana, A. M.; Revilla, I.; González-Martín, M. I.; Hernández-Jiménez,
M.; Martínez-Martín, I. Sensors (Switzerland), 2020, 20, 5624 (https://doi.org/10.3390/s20195624).
7. Liu, P.; Zhu, X.; Hu, X.; Xiong, A.; Wen, J.; Li, H.; Ai, S.; Wu, R. Vib. Spectrosc., 2019, 103, 102923
(https://doi.org/10.1016/j.vibspec.2019.05.005).
8. Baqueta, M. R.; Coqueiro, A.; Valderrama, P. J. Food Sci., 2019, 84, 1247 (https://doi.org/10.1111/1750-
3841.14617).
9. Ribeiro, J. S.; Ferreira, M. M. C.; Salva, T. J. G. Talanta, 2011, 83, 1352 (https://doi.org/10.1016/j.
talanta.2010.11.001).
100Braz. J. Anal. Chem., 2021, 8 (32), pp 91–106.
10. Bressanello, D.; Liberto, E.; Cordero, C.; Rubiolo, P.; Pellegrino, G.; Ruosi, M. R.; Bicchi, C. Food
Chem., 2017, 214, pp 218–226 (https://doi.org/10.1016/j.foodchem.2016.07.088).
11. Rocchetti, G.; Braceschi, P. G.; Odello, L.; Bertuzzi, T.; Trevisan, M.; Lucini, L. Metabolomics, 2020, 16,
127 (https://doi.org/10.1007/s11306-020-01751-6).
12. Pua, A.; Lau, H.; Liu, S. Q.; Tan, L. P.; Goh, R. M. V.; Lassabliere, B.; Leong, K. C.; Sun, J.; Cornuz, M.;
Yu, B. Food Chem., 2020, 302, 125370 (https://doi.org/10.1016/j.foodchem.2019.125370).
13. Quintanilla-Casas, B.; Dulsat-Serra, N.; Cortés-Francisco, N.; Caixach, J.; Vichi, S. LWT - Food Sci.
Technol., 2015, 64, 1085 (https://doi.org/10.1016/j.lwt.2015.07.010).
14. Sittipod, S.; Schwartz, E.; Paravisini, L.; Tello, E.; Peterson, D. G. J. Agric. Food Chem., 2020, 68,
10424 (https://doi.org/10.1021/acs.jafc.0c01479).
15. Kaiser, S.; Dias, J. C.; Ardila, J. A.; Soares, F. L. F.; Marcelo, M. C. A.; Porte, L. M. F.; Gonçalves,
C.; Canova, L. dos S.; Pontes, O. F. S.; Sabin, G. P. Talanta, 2018, 190, pp 363–374 (https://doi.
org/10.1016/j.talanta.2018.08.007).
16. Schwanz, T. G.; Bokowski, L. V. V.; Marcelo, M. C. A.; Jandrey, A. C.; Dias, J. C.; Maximiano, D. H.;
Canova, L. S.; Pontes, O. F. S.; Sabin, G. P.; Kaiser, S. Talanta, 2019, 202, pp 74–89 (https://doi.
org/10.1016/j.talanta.2019.04.060).
17. Kaiser, S.; Soares, F. L. F.; Ardila, J. A.; Marcelo, M. C. A.; Dias, J. C.; Porte, L. M. F.; Gonçalves, C.;
Pontes, O. F. S.; Sabin, G. P. Chem. Res. Toxicol., 2018, 31, pp 964–973 (https://doi.org/10.1021/acs.
chemrestox.8b00154).
18. Ciasca, B.; Pecorelli, I.; Lepore, L.; Paoloni, A.; Catucci, L.; Pascale, M.; Lattanzio, V. M. T. Food
Chem., 2020, 310, 125813 (https://doi.org/10.1016/j.foodchem.2019.125813).
19. Du, L.; Lu, W.; Cai, Z.; Bao, L.; Hartmann, C.; Gao, B.; Yu, L. Food Chem., 2018, 240, pp 573–578
(https://doi.org/10.1016/j.foodchem.2017.07.107).
20. Gao, B.; Lu, Y.; Qin, F.; Chen, P.; Shi, H.; Charles, D.; Yu, L. J. Agric. Food Chem., 2012, 60, pp 11987–
11994 (https://doi.org/10.1021/jf303415d).
21. Soares, F. L. F.; Marcelo, M. C. A.; Dias, J. C.; Juliano, L. C.; Porte, L. M. F.; Canova, L. dos S.; Ardila,
J. A.; Pontes, O. F. S.; Sabin, G. P.; Kaiser, S. J. Chemom., 2020, 34, e3297 (https://doi.org/10.1002/
cem.3297).
22. Ergon, R. J. Chemom., 2005, 19, pp 1–4 (https://doi.org/10.1002/cem.899).
23. Burgués, J.; Marco, S. Anal. Chim. Acta, 2018, 1019, pp 49–64 (https://doi.org/10.1016/j.
aca.2018.03.005).
24. Lee, J.; Bagheri, B.; Kao, H. A. Manuf. Lett., 2015, 3, pp 18–23 (https://doi.org/10.1016/j.
mfglet.2014.12.001).
25. Draper, J.; Lloyd, A. J.; Goodacre, R.; Beckmann, M. Metabolomics, 2013, 9, pp 4–29 (https://doi.
org/10.1007/s11306-012-0449-x).
26. Fuhrer, T.; Zamboni, N. Curr. Opin. Biotechnol., 2015, 31, pp 73–78 (https://doi.org/10.1016/j.
copbio.2014.08.006).
27. Szymańska, E.; Saccenti, E.; Smilde, A. K.; Westerhuis, J. A. Metabolomics, 2012, 8, pp 3–16 (https://
doi.org/10.1007/s11306-011-0330-3).
28. Mehmood, T.; Liland, K. H.; Snipen, L.; Sæbø, S. Chemom. Intell. Lab. Syst., 2012, 118, pp 62–69
(https://doi.org/10.1016/j.chemolab.2012.07.010).
29. Cardoso, V. G. K.; Poppi, R. J. Microchem. J., 2021, 164, 106052 (https://doi.org/10.1016/j.
microc.2021.106052).
30. Cardoso, V. G. K.; Poppi, R. J. Food Control, 2021, 125, 107917 (https://doi.org/10.1016/j.
foodcont.2021.107917).
31. Kim, H. K.; Verpoorte, R. Phytochem. Anal., 2010, 21, pp 4–13 (https://doi.org/10.1002/pca.1188).
32. De Vos, R. C. H.; Moco, S.; Lommen, A.; Keurentjes, J. J. B.; Bino, R. J.; Hall, R. D. Nat. Protoc., 2007,
2, pp 778–791 (https://doi.org/10.1038/nprot.2007.95).
101Fast High–Resolution Mass Spectrometry and Chemometrics for Evaluation of
Sensory Parameters of Commercial Coffee Blends
33. Pereira, L. L.; Cardoso, W. S.; Guarçoni, R. C.; da Fonseca, A. F. A.; Moreira, T. R.; Caten, C. S. Eur.
Food Res. Technol., 2017, 243, pp 1545–1554 (https://doi.org/10.1007/s00217-017-2863-9).
34. Nebesny, E.; Budryn, G. Eur. Food Res. Technol., 2006, 224, pp 159–165 (https://doi.org/10.1007/
s00217-006-0308-y).
35. Belchior, V.; Botelho, B. G.; Oliveira, L. S.; Franca, A. S. Food Chem., 2019, 273, pp 178–185 (https://
doi.org/10.1016/j.foodchem.2017.12.026).
36. Craig, A. P.; Botelho, B. G.; Oliveira, L. S.; Franca, A. S. Food Chem., 2018, 245, pp 1052–1061
(https://doi.org/10.1016/j.foodchem.2017.11.066).
37. Baqueta, M. R.; Coqueiro, A.; Março, P. H.; Valderrama, P. Food Anal. Methods, 2020, 13, pp 50–60
(https://doi.org/10.1007/s12161-019-01503-w).
38. Frank, O.; Zehentbauer, G.; Hofmann, T. Dev. Food Sci., 2006, 43, pp 165–168 (https://doi.org/10.1016/
S0167-4501(06)80039-7).
39. Jaiswal, R.; Matei, M. F.; Golon, A.; Witt, M.; Kuhnert, N. Food Funct., 2012, 3, pp 976–984 (https://doi.
org/10.1039/c2fo10260a).
40. Correia, R. M.; Loureiro, L. B.; Rodrigues, R. R. T.; Costa, H. B.; Oliveira, B. G.; Filgueiras, P. R.;
Thompson, C. J.; Lacerda Jr, V.; Romão, W. Anal. Methods, 2016, 8, pp 7678–7688 (https://doi.
org/10.1039/c6ay02501c).
41. Jeszka-Skowron, M.; Zgoła-Grześkowiak, A.; Grześkowiak, T. Eur. Food Res. Technol., 2015, 240, pp
19–31 (https://doi.org/10.1007/s00217-014-2356-z).
102Braz. J. Anal. Chem., 2021, 8 (32), pp 91–106.
SUPPLEMENTARY MATERIAL
Table S1. Codes and sensory assessment of each class used in to train the models
Roasting Type of
Code Acidity Bitterness Body Intensity
level capsule
ARP 2 4 4 9 4 1
ARP_DEC* 2 4 4 9 4 2
CAP 3 3 2 5 2 3
CAR 3 3 3 6 3 4
CIO 3 3 3 6 3 5
COL 4 3 3 5 3 6
COS 5 1 1 4 1 7
DHA 1 5 4 11 5 8
ENV 1 4 4 9 4 9
ETH 4 2 2 4 2 10
FOR 2 3 3 8 4 11
IND 1 5 4 11 5 12
INN 2 3 4 8 4 13
KAZ 1 5 5 12 5 14
LIN 1 1 2 4 2 15
LIV 3 3 3 6 3 16
NIC 2 2 2 5 2 17
RIS 3 4 4 10 4 18
RIS_DEC* 3 4 4 10 4 19
ROM 4 4 3 8 3 20
VAN 3 3 3 6 3 21
VIV 2 2 2 4 3 22
VIV_DEC* 2 2 2 4 3 23
VOL 3 2 2 4 2 24
VOL_DEC* 3 2 2 4 2 25
*Decaffeinated capsules
103Cardoso, V. G. K.; Sabin, G. P.; Hantao, L. W.
Table S2. Sensitivity and specificity of validation set of acidity model according to each class
Acidity
Class Sensitivity Specificity
1 100% 100%
2 100% 100%
3 97.0% 98.2%
4 91.7% 98.7%
5 100% 100%
Table S3. Sensitivity and specificity of validation set of bitterness model according to each class
Bitterness
Class Sensitivity Specificity
1 100% 97.6%
2 92.6% 100%
3 100% 93.1%
4 83.3% 98.3%
5 88.9% 100%
Table S4. Sensitivity and specificity of validation set of body model according to each class
Body
Class Sensitivity Specificity
1 100% 99.0%
2 100% 94.2%
3 91.7% 100%
4 89.7% 98.0%
5 100% 100%
104Braz. J. Anal. Chem., 2021, 8 (32), pp 91–106.
Table S5. Sensitivity and specificity of validation set of intensity model according to each class
Intensity
Class Sensitivity Specificity
4 95.2% 95.7%
5 88.9% 100%
6 100% 100%
8 100% 96.3%
9 86.7% 97.3%
10 66.7% 100%
11 100% 100%
12 100% 100%
Table S6. Sensitivity and specificity of validation set of roasting-level model according to each class
Roasting level
Class Sensitivity Specificity
1 100% 100%
2 100% 97.1%
3 93.9% 100%
4 100% 98.5%
5 88.9% 100%
Table S7. Sensitivity and specificity of validation set of type-of-capsule model according to each class
Type of Capsule
Class Sensitivity Specificity
1 100% 100%
2 100% 98.9%
3 100% 100%
4 100% 96.6%
5 100% 98.9%
105Fast High–Resolution Mass Spectrometry and Chemometrics for Evaluation of
Sensory Parameters of Commercial Coffee Blends
Table S7. Sensitivity and specificity of validation set of type-of-capsule model according to each
class (Continuation)
Type of Capsule
Class Sensitivity Specificity
6 66.7% 100%
7 100% 100%
8 100% 100%
9 66.7% 100%
10 100% 100%
11 100% 98.9%
12 100% 100%
13 100% 100%
14 100% 100%
15 100% 100%
16 100% 100%
17 83.3% 100%
18 100% 100%
19 83.3% 100%
20 100% 100%
21 100% 100%
22 100% 100%
23 83.3% 100%
24 66.7% 100%
25 100% 100%
106You can also read