Wavefront shaping assisted design of spectral splitters and solar concentrators - Nature
←
→
Page content transcription
If your browser does not render page correctly, please read the page content below
www.nature.com/scientificreports
OPEN Wavefront shaping assisted design
of spectral splitters and solar
concentrators
Berk N. Gün1,2 & Emre Yüce1,2*
Spectral splitters, as well as solar concentrators, are commonly designed and optimized using
numerical methods. Here, we present an experimental method to spectrally split and concentrate
broadband light (420–875 nm) via wavefront shaping. We manage to spatially control white light using
a phase-only spatial light modulator. As a result, we are able to split and concentrate three frequency
bands, namely red (560–875 nm), green (425–620 nm), and blue (420–535 nm), to two target
spots with a total enhancement factor of 715%. Despite the significant overlap between the color
channels, we obtain spectral splitting ratios as 52%, 57%, and 66% for red, green, and blue channels,
respectively. We show that a higher number of adjustable superpixels ensures higher spectral splitting
and concentration. We provide the methods to convert an optimized phase pattern into a diffractive
optical element that can be fabricated at large scale and low cost. The experimental method that we
introduce, for the first time, enables the optimization and design of SpliCons, which is ∼ 300 times
faster compared to the computational methods.
Ever since the invention of PhotoVoltaic (PV) c ells1, the demand for making more efficient solar cells has been the
foremost drive for researchers as well as the industry. Scientists constantly seek for effective methods to increase
the efficiency of the solar cells by researching more into material science as well as developing methods that
involve spatial control of light using solar concentrators2 and trackers3. Control over the frequency of incident
light opens an additional dimension to benefit from, which provides the means to push the limits beyond a single
material can provide. Spectral splitting of incident frequencies provides high PV cell efficiency and cost-effective
optical systems4. Some of the classic spectral beam splitting methods include holographic concentrators5, thin-
film filters6, prism assisted systems7 and diffractive optical elements (DOEs)8.
DOEs steer the incoming beam by diffracting it as its name signifies. The impact of DOEs is increasing,
specifically in microscopy9 and solar energy research10. The DOEs that are employed in solar energy research
can spectrally split, concentrate light, or perform these two tasks simultaneously. We think that it is important
to distinguish a DOE that can simultaneously perform spectral splitting and concentration and, therefore, we
name these special DOEs as SpliCons. DOEs are generally calculated via computational methods such as Ger-
chberg–Saxton11, Yang-Gu12, direct binary search13, iterative Fourier transform14, genetic optimization15 and
simulated annealing16. Optimization of DOEs is a rather challenging task if increased level of splitting and
concentration efficiencies are targeted. Optimization of a DOE for white light ranging between 400 and 1100 nm
would require coarsely 700 wavelengths if this range is divided at every 1 nm. A DOE with a lateral pixel number
of only 40 × 40 and with nine steps in pixel height would require 107 parameters to be processed. For this reason,
it is computationally expensive to compute a real-life physical system, even with today’s improved computational
power. The pioneering experimental research by Kim et al.17 has demonstrated spectral splitting of light using
a DOE that has 1000 pixels in one dimension. In that study, the heights of the pixels are optimized to spectrally
split incident light. The DOEs that are not optimized in 3D cannot fulfill both spectral splitting and concentra-
tion of the incident light, which are essential for smart solar cells.
Here, we develop an experimental method to design and optimize SpliCons that can achieve simultaneous
concentration and spectral splitting of white light. We use a spatial light modulator (SLM), an electro-optic
device that enables programming of holographic phase plates that can emulate a DOE. SLMs that enable dynamic
control over the spatial phase of light has significantly contributed to research fields such as optical t weezers18,
linear/nonlinear microscopy19, micro-processing of materials20, adaptive optics21, pulse s haping22 and computer-
generated holograms23. Here, we employ an SLM for solar energy research and demonstrate spectral splitting
1
Programmable Photonics Group, Department of Physics, Middle East Technical University, 06800 Ankara,
Turkey. 2The Center for Solar Energy Research and Applications (GÜNAM), Middle East Technical University,
06800 Ankara, Turkey. *email: eyuce@metu.edu.tr
Scientific Reports | (2021) 11:2825 | https://doi.org/10.1038/s41598-021-82110-w 1
Vol.:(0123456789)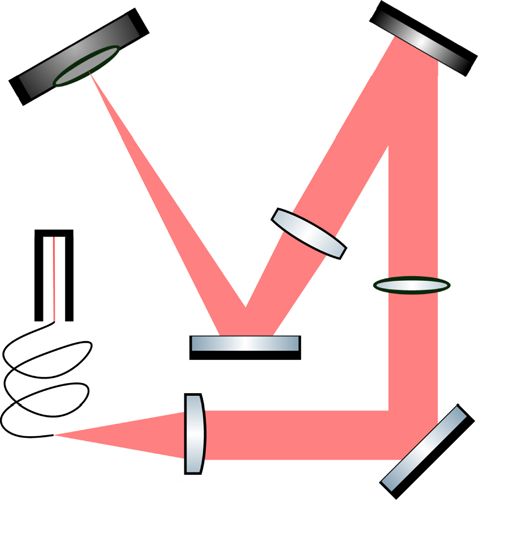
www.nature.com/scientificreports/
Figure 1. (a) The experimental setup that is used to emulate spectral splitters and concentrators: SpliCons
using an SLM. Broadband light coming from the source coupled to the fiber (F) passes through condenser
lens (C) (f = 160 mm) and linear polarizer (P) positioned on the way before SLM. A plano-convex lens
(L) (f = 300 mm) is placed to transfer the image from the SLM surface onto the camera. (b) Image before
optimization of the wavefront. (c) Spectrally split and concentrated light. (d) Phase pattern on the SLM that
concentrates and spectrally splits light. The images (b) and (c) are raw images obtained from the CCD camera.
and concentration of white light at a record pixel number. The number of pixels we control is ∼ 2 × 10⁶, which
is three orders greater than the previous experimental s tudy17. In our measurement, we use an SLM in order to
control the spatial phase of each frequency band. The splitting ratio and the concentration efficiency of a SpliCon
increase with the number of controlled pixels. The calculation of a SpliCon that we experimentally optimize here
can take up to 89 days using numerical methods, which also lack real-life c ircumstances24. The method that we
introduce here for solar energy research provides the means to design SpliCons experimentally, enabling ∼ 300
times faster optimization compared to the numerical methods.
Experimental setup
A high degree of temporally incoherent fiber-coupled white light source that emits between 360 and 2600 nm
was used in our experiment, see Fig. 1a. A linear polarizer was positioned after the concentrator lens on the
beam path in order to filter out the polarization axes that SLM cannot modulate. We used a phase-only SLM
with a nominal resolution of 1920 × 1080 pixels to steer the impinging beam. SLM, whose pixel size is 8 µm ,
makes an angle of 9.5◦ with the incoming beam. The SLM that we operated in our experiment can efficiently
modulate light between 420 and 1064 nm (Holoeye Pluto-2). A converging lens was positioned after the SLM
to image the surface of the SLM right before the CCD camera. The multi-channel camera used in our experi-
ment has 1292 × 964 pixels with a pixel size of 3.75 µm. The chip of the color camera (Sony ICX445) has three
color channels separated through color filters with the peak quantum efficiencies located at blue: 450 nm, green:
535 nm, and red: 610 nm.
Figure 1b shows the intensity distribution of light before wavefront shaping. The spectrally split and con-
centrated light intensity is shown in Fig. 1c. The target spots are centered at (1.07 mm, 1.03 mm) and (3.32 mm,
1.03 mm). The intensity increase at the target spots clearly indicates the concentration of the broadband light. In
Fig. 1c, it can already be seen that the red portion of the incident light is directed to the left target spot, whereas
the green and the blue portions are directed to the right one. Processed separate color channel data will be pre-
sented shortly to illustrate the spectral splitting. Figure 1d shows the measured phase pattern on the SLM that
eventually represents the SpliCon that we optimized.
We measured the optical power of fiber-coupled stabilized tungsten-halogen broadband l ight25 by a thermal
power sensor (response between 190 nm up to 20,000 nm) placed immediately after the condenser, and the
average power is 8.49 mW. To detect the manipulated beam, we used a multi-channel camera with an effective
chip size of 4.8 mm × 3.6 mm. The active area of phase-only Holoeye Pluto-2 SLM is 15.36 mm × 8.64 mm. Since
the SLM surface is larger than the CCD chip, we set the demagnification ratio ∼ 3.2 such that the SLM surface
is correctly fit on the CCD chip.
Transformation of SpliCons into physical SpliCons. The use of SLMs for solar panels is, in fact, not
realistic due to the cost of SLMs. However, the method that we develop here provide the means to optimize Spli-
Cons in real-life conditions. The measured and optimized phase patterns can easily be converted into a physical
SpliCon using the simple conversion of the optical path. The phase that light accumulates through a medium is
given by:
2π
φxy ( ) = hxy [n( ) − 1], (1)
where φxy ( ) is the phase difference for incoming light on the diffraction plane positioned at (x,y), hxy the thick-
ness of the diffractive material, the wavelength of the incident light, n( ) the refractive index of the diffractive
Scientific Reports | (2021) 11:2825 | https://doi.org/10.1038/s41598-021-82110-w 2
Vol:.(1234567890)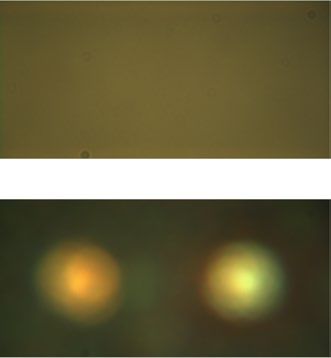
www.nature.com/scientificreports/
Figure 2. (a) An example of physical DOE having seven-step height levels. (b) An example of programmable
DOE having seven refractive indices.
material. The DOEs are designed and fabricated to control each frequency phase using the variations in hxy in
Eq. (1), see Fig. 2a. On the other hand, the pixels on an SLM have fixed height, and the spatial phase of light
is controlled by modifying n( ) in Eq. (1), Fig. 2b. Each gray index value written on an SLM corresponds to a
different refractive index. Using Eq. (1) a phase pattern optimized using SLM can be easily transformed into a
SpliCon structure that can be fabricated on cost-effective materials at large scales.
Continuous sequential optimization algorithm. Every pixel on the SLM contributes directly to the
image on the camera. However, controlling individual pixels of the SLM does not yield a measurable change on
the camera since the change that is introduced by one pixel falls below the noise l evel26. For this reason, we group
the pixels on the SLM and control these linked groups called superpixels. We operate SLM with five particular
configurations that increase linearly from 15 × 15 grouped pixels up to 55 × 55 grouped pixels. As a result of the
grouping stated, the number of pixels we control on the SLM range from 685 to 9216 in total. Superpixels are
fed by using 8-bit gray values from snow white to jet-black. The grayscale on the SLM is divided into 16 steps.
Thereby the number of parameters that we can process here reaches up to 9216 × 16 ∼ = 1.5 × 10⁵. We have man-
aged to set sub-iteration time within 250 ms. Here, we define a sub-iteration as the scanning of 16 steps in gray
indices on a superpixel and measuring the output intensity patterns at the target.
The algorithm’s working principle is as follows: after setting the superpixels’ size, we encode an entirely white
pattern on the SLM, meaning the SLM does not modulate the wavefront since all pixels have the same refractive
index. Phase steps for the first group of pixels are encoded on the SLM surface consecutively. Then, we dictate
specific target spots on the camera for the concentration of particular frequency bands. The phase step of the
specified pixel group that provides the total maximum intensity on the target spots is selected and encoded on
the SLM surface. This process is repeated for all superpixels, and a phase pattern is obtained at the end of this
major iteration27. We repeat the major iteration three times in order to obtain an optimal phase pattern for the
SpliCon. The optimization of the SpliCons takes up to a maximum of 30 h (for 15 × 15 superpixels with three
major iterations) by processing ∼ 4.7 × 10⁵ parameters. The experimental optimization scheme that we introduce
here can be decreased to two hours if the integration time on the camera is decreased from 250 to 16.7 ms (set
by the refresh rate of the SLM). This would require a source and a camera with lower noise levels26.
The calculation of a SpliCon would take as much as 89 days if the SpliCon is optimized for every 1 nm wave-
length between 400 and 1100 nm24. 10 min is required to optimize a single pixel of the SpliCon that involves
scanning 8 phase levels and 700 individual wavelengths. The SLM, on the other hand, can provide scanning of a
phase level within 1/60 Hz = 16.7 ms. However, since we average over a few SLM cycles, we use 250 ms exposure
time on the camera and thereby spend only 2 seconds scanning 8 phase levels using the SLM. Combining the fact
that measurements that are performed for broadband light (providing parallel response) and the fast refresh rate
of the SLM compared to a calculation, we achieve ∼ 300 times faster optimization of SpliCons.
Results and discussion
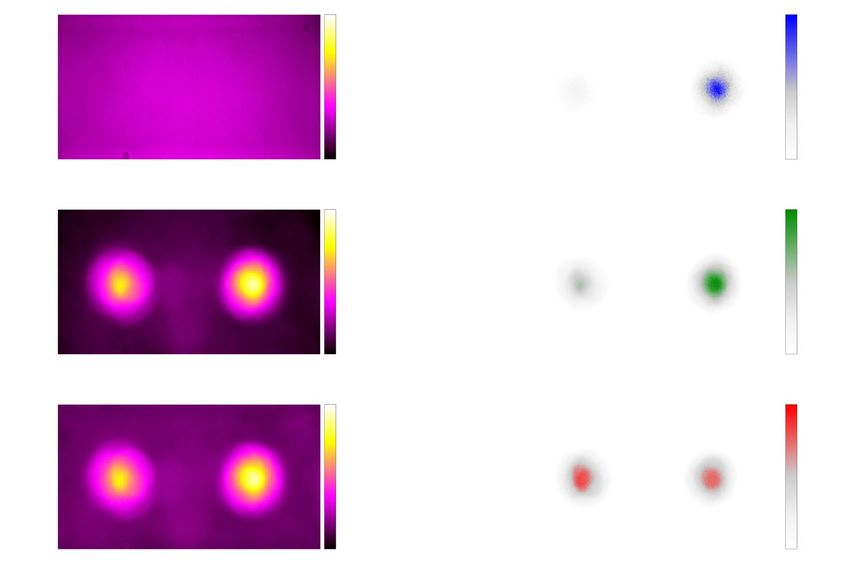
In Fig. 3 we replot the raw images that are shown in Fig. 1b,c to quantitatively express the change in intensity
for different frequency bands. Fig. 3a,b show the intensity profile on camera before and after wavefront shaping,
respectively. To illustrate the intensity change, we convert 24-bit multi-channel data provided from CCD camera
to 8-bit single-channel data and normalize it to the maximum intensity seen in Fig. 3b. In Fig. 3c we provide the
differential change in intensity that indicates a quantitative measure of the intensity increase due to the optimized
SpliCon. The differential change in intensity �I k ( z ) is defined by:
Ifk ( z ) − Iik ( z )
�I k ( z ) = , (2)
Iik ( z )
where k is the pixel number and range between k = {1, 2, . . . , n}. z stands for the frequency bands that the color
channels of the camera sense, and z = {red,green,blue}. In this way, the enhancement factors are given for each
channel. We also provide a total enhancement factor to provide a quantitative measure for the total increase in
the enhancement factor. Ik ( z ) is the scalar-valued function showing spectral intensity values. The subscript i
and f stand for the initial and final intensities, respectively.
In Fig. 3d–f, we provide the differential intensity change for the three particular frequency bands that are
between (420–535 nm), (425–620 nm), and (560–875 nm). In our optimization algorithm, we have targeted the
Scientific Reports | (2021) 11:2825 | https://doi.org/10.1038/s41598-021-82110-w 3
Vol.:(0123456789)www.nature.com/scientificreports/
Figure 3. The all-in-one single-channel intensity profile (a) before, (b) after wavefront shaping. Differential
intensity changes for all-in-one single-channel, blue, green, and red channels are shown separately in panels (c),
(d), (e), and (f), respectively.
beam of light between 420 and 620 nm (blue and green bands) to the right spot and the light between 560 and
875 nm (red band) to the left spot at the diffraction plane. It can be seen in Fig. 3d–f that the intensities at the
targets increase individually for each band, indicating the spectral splitting and concentration of the white light.
However, spectral splitting ratios of the blue and the green bands seen in Fig. 3d,e have higher values than that
of the red band (Fig. 3f). Although we target the red light to the left target position, we observe an increase of red
light on the right target position as well. This effect is a natural consequence of CCD’s sensing mechanism and
stems from the frequency overlap between the bands. At 5% quantum efficiency, the red and the green bands of
the CCD chip have 29.3% overlap, whereas the green and the blue bands have approximately 66.7% o verlap28.
Nevertheless, we still observe a splitting ratio of S > 0.5 for longer wavelengths.
If (Am , z ) dAm
η( z ) = T , (3)
T Ii (Am , z ) dAm
T If (Am ,
z ) dAm
S( z ) = , (4)
I
T f (A ,
m z ) dA m + T If (An , z ) dAn
We quantify the enhancement factor η( z ) of the intensity
for each channel using Eq. (3) in which Am is the
area of the mth target spot and m = {1, 2}. In Eq. (3), T Ii (Am , z ) dAm and T If (Am , z ) dAm are the spectral
intensities on a target spot before and after wavefront shaping, respectively. The enhancement factor is the spec-
tral intensity after the optimization on the corresponding target spot over the incident spectral intensity on the
same target spot. We also define the spectral splitting ratio S( z ) in Eq. (4), where m, n = {1, 2} and m = n. It is
defined as spectral intensity on the corresponding target spot over total spectral intensity. The letters m and n
are assigned to each target spot.
In Fig. 4 we provide data on the effect of the number of superpixels as well as the number of iterations.
Through three iterations with 16 distinct gray values, we have obtained the mean of three data sets, which are
presented in the panels (a) and (c) in Fig. 4. The enhancement factor in the red channel is the highest for the lower
number of superpixels (Fig. 4a). The reason behind that is that the CCD chip has a higher spectral response for
the red channel. Less number of adjustable superpixels simply means less control on the light. As the number of
superpixels increases, we gain more control over the enhancement factor. The spectral responses provided by the
manufacturer28 of the camera are 19.5 × 10⁻² A/W, 18.0 × 10⁻² A/W and 13.5 × 10⁻² A/W with the peak wave-
lengths at 610 nm, 535 nm, 450 nm for the red, green and blue channels, respectively. Utilizing more superpixels
favors more intensity increase at the green-blue target position as a consequence of the algorithm seeking for
Scientific Reports | (2021) 11:2825 | https://doi.org/10.1038/s41598-021-82110-w 4
Vol:.(1234567890)www.nature.com/scientificreports/
Figure 4. The enhancement factor of intensity for each channel as a function of (a) number of superpixels
and (b) number of major iterations. The spectral splitting ratio for each channel as a function of (c) number of
superpixels (d) number of major iterations. The error bars are smaller than the symbol size in all panels.
total maximum intensity without using any weight functions for manipulating the spectral responses of the color
channels. The enhancement factors of the blue and the green channel intensities surpass that of the red channel
intensity since the addition of two channels provide greater value than a single channel. The green channel has a
higher enhancement factor than that of the blue channel because the green channel spectral response is greater
than the blue channel spectral response. In Fig. 4b, we investigate the change in the enhancement factor with
respect to the iteration number. We clearly observe that each channel intensity has an increasing trend as the
number of iteration increases. The intensity values are saturated at ∼ fifth iteration. We have collected the data
(Fig. 4b,d) by encoding 16 different phase steps to 1024 different superpixels.
The overlaps between the channels have an increasing effect on each other’s response. Unfortunately, these
overlaps are disadvantageous for the spectral splitting ratios (Fig. 4c,d). By concentrating the green and the blue
channel intensities at the same target position rather than defining weights for each channel, we compensate
for the higher spectral response of the red channel for the lower number of iterations. Hence, at the green–blue
target position, the red channel intensity increases with the increasing number of adjustable superpixels more
than the increase in the green and the blue channel intensities at the red target position (Fig. 4c). The decreasing
trend of the splitting ratio for the red channel at 3318 superpixels is likely since the major iteration number is
not sufficient, and our algorithm favors maximum intensity. If we change the algorithm to get the maximum
splitting ratio, we can perhaps observe an increasing splitting ratio with the increasing number of superpixels.
Both enhancement factor and spectral splitting ratio values rise with the number of superpixels used for the
SpliCon that is programmed on the S LM29. In Fig. 4d, we use the data for monitoring the spectral splitting ratio
as a function of iteration for 1024 adjustable superpixels. After the fourth iteration, the spectral splitting ratio
of the red channel becomes dominant due to having the highest spectral response that results in a simultaneous
decrease of the splitting ratios of the blue and the green channels. Despite the variations in the spectral splitting
ratio, the intensity at each channel increases with the number of superpixels as expected. Defining weights for
color channels in the algorithm by considering spectral responses may alleviate the sharp decrease in the blue
and the green channel splitting ratios seen at the fifth iteration. However, we predict that even in that case, a
smaller overlap between each channel is required, which is not provided by the CCD cameras.
Conclusion
By wavefront shaping, we achieved spectral splitting and concentration of broadband light. As an alternative to
the conventional computational methods, we employed an experimental approach using an SLM in the design
of a SpliCon. By optimizing the gray level values, we optimize refractive indices and achieve simultaneous spec-
tral splitting and concentration of broadband light. The experimentally optimized SpliCon can be transformed
into a physical structure on a cost-effective material such as g lass30 or polymer31 and could be used in front of
the multi-junction solar cells to provide increased e fficiency32. The spatial coherence of our source differs from
the sunlight to some extend. However, the method that we develop here can be applied to sunlight given the
spectral degree of coherence agreement with broadband sources33–37. We utilized a particular polarization axis
for modulation. Our approach can also be generalized to modulate both p olarizations38, which will further
increase the enhancement factor and the spectral splitting ratio. In fact, a further increase in the enhancement
factor and the spectral splitting ratio can be obtained using an increased number of pixels on the SLM. However,
increasing pixel density beyond the large scale fabrication precision limits would not be realistic. For this reason,
we keep the pixel size and density achievable with direct laser writing that can provide large scale production
Scientific Reports | (2021) 11:2825 | https://doi.org/10.1038/s41598-021-82110-w 5
Vol.:(0123456789)www.nature.com/scientificreports/
of SpliCons39. We think that the increased speed in optimization time (∼ 300x ), as well as the ability to design
SpliCons in real-life conditions, will result in transformative effects in solar cells as they will pave the way for
faster optimization of tandem cells with different geometries and material combinations.
Received: 25 July 2020; Accepted: 5 January 2021
References
1. Chapin, D. M., Fuller, C. S. & Pearson, G. L. A new silicon p-n junction photocell for converting solar radiation into electrical
power. J. Appl. Phys. 25, 676–677. https://doi.org/10.1063/1.1721711 (1954).
2. James, L. W. & Moon, R. L. GaAs concentrator solar cell. Appl. Phys. Lett. 26, 467–470. https://doi.org/10.1063/1.88213 (1975).
3. Moore, R. A. Solar tracker (1987). US Patent 4,649,899.
4. Mitchell, B. et al. Four-junction spectral beam-splitting photovoltaic receiver with high optical efficiency. Prog. Photovoltaics Res.
Appl. 19, 61–72. https://doi.org/10.1002/pip.988 (2011).
5. Bloss, W. H., Griesinger, M. & Reinhardt, E. R. Dispersive concentrating systems based on transmission phase holograms for solar
applications. Appl. Opt. 21, 3739–3742. https://doi.org/10.1364/AO.21.003739 (1982).
6. Mojiri, A., Taylor, R., Thomsen, E. & Rosengarten, G. Spectral beam splitting for efficient conversion of solar energy - a review.
Renew. Sustain. Energy Rev. 28, 654–663. https://doi.org/10.1016/j.rser.2013.08.026 (2013).
7. Stefancich, M. et al. Single element spectral splitting solar concentrator for multiple cells CPV system. Opt. Express 20, 9004–9018,
2012, DOI: 10.1364/OE.20.009004.
8. Dong, B. Z. et al. Design and fabrication of a diffractive phase element for wavelength demultiplexing and spatial focusing simul-
taneously. Appl. Opt. 35, 6859–6864, 1996, DOI: 10.1364/AO.35.006859.
9. Fabrizio, E. D. et al. Diffractive optical elements for differential interference contrast x-ray microscopy. Opt. Express 11, 2278–2288.
https://doi.org/10.1364/OE.11.002278 (2003).
10. Mingareev, I. et al. Diffractive optical elements utilized for efficiency enhancement of photovoltaic modules. Opt. Express 19,
11397–11404. https://doi.org/10.1364/OE.19.011397 (2011).
11. Gerchberg, R. & Saxton, W. A practical algorithm for the determination of phase from image and diffraction plane pictures. Optik
35, 237–250 (1972).
12. Yang, G. Z., Dong, B. Z., Gu, B. Y., Zhuang, J. Y. & Ersoy, O. K. Gerchberg-Saxton and Yang-Gu algorithms for phase retrieval in
a nonunitary transform system: a comparison. Appl. Opt. 33, 209–218, 1994, DOI: 10.1364/AO.33.000209.
13. Seldowitz, M. A., Allebach, J. P. & Sweeney, D. W. Synthesis of digital holograms by direct binary search. Appl. Opt. 26, 2788–2798,
1987, DOI: 10.1364/AO.26.002788.
14. Skeren, M., Richter, I. & Fiala, P. Iterative Fourier transform algorithm: different approaches to diffractive optical element design.
In Laser Beam Shaping III. International Society for Optics and Photonics (eds Dickey, F. M. et al.) 75–88 (SPIE, 2002). https://doi.
org/10.1117/12.451643.
15. Zhou, G., Chen, Y., Wang, Z. & Song, H. Genetic local search algorithm for optimization design of diffractive optical elements.
Appl. Opt. 38, 4281–4290, 1999, DOI: 10.1364/AO.38.004281.
16. Lin, Y., Kessler, T. J. & Lawrence, G. N. Design of continuous surface-relief phase plates by surface-based simulated annealing to
achieve control of focal-plane irradiance. Opt. Lett. 21, 1703–1705, 1996, DOI: 10.1364/OL.21.001703.
17. Kim, G., Dominguez-Caballero, J. A., Lee, H., Friedman, D. J. & Menon, R. Increased photovoltaic power output via diffractive
spectrum separation. Phys. Rev. Lett. 110, 123901, 2013, DOI: 10.1103/PhysRevLett.110.123901.
18. Leach, J. et al. 3d manipulation of particles into crystal structures using holographic optical tweezers. Opt. Express 12, 220–226.
https://doi.org/10.1364/OPEX.12.000220 (2004).
19. Maurer, C., Jesacher, A., Bernet, S. & Ritsch-Marte, M. What spatial light modulators can do for optical microscopy. Laser &
Photonics Reviews 5, 81–101. https://doi.org/10.1002/lpor.200900047 (2011).
20. Kuang, Z. et al. High throughput diffractive multi-beam femtosecond laser processing using a spatial light modulator. Applied
Surface Science 255, 2284–2289, 2008, DOI: 10.1016/j.apsusc.2008.07.091.
21. Krulevitch, P. A. et al. MOEMS spatial light modulator development at the Center for Adaptive Optics. In MOEMS and Minia-
turized Systems III. International Society for Optics and Photonics Vol. 4983 (ed. Smith, J. H.) 172–179 (SPIE, 2003). https://doi.
org/10.1117/12.478562.
22. Weiner, A. M. Femtosecond pulse shaping using spatial light modulators. Review of Scientific Instruments 71, 1929–1960, 2000,
DOI: 10.1063/1.1150614.
23. Mok, F., Diep, J., Liu, H.-K. & Psaltis, D. Real-time computer-generated hologram by means of liquid-crystal television spatial
light modulator. Opt. Lett. 11, 748–750, 1986, DOI: https://doi.org/10.1364/OL.11.000748.
24. Yolalmaz, A. & Yüce, E. Effective bandwidth approach for the spectral splitting of solar spectrum using diffractive optical elements.
Opt. Express 28, 12911–12921, 2020, DOI: 10.1364/OE.381822.
25. Thorlabs, 56 Sparta Avenue Newton, New Jersey 07860 United States. Thorlabs SLS201L(/M), SLS202L(/M) Stabilized Tungsten
Light Sources User Guide, Rev d edn. (2020).
26. Yilmaz, H., Vos, W. L. & Mosk, A. P. Optimal control of light propagation through multiple-scattering media in the presence of
noise. Biomed. Opt. Express 4, 1759–1768. https://doi.org/10.1364/BOE.4.001759 (2013).
27. Vellekoop, I. M. & Mosk, A. P. Focusing coherent light through opaque strongly scattering media. Opt. Lett. 32, 2309–2311, 2007,
DOI: 10.1364/OL.32.002309.
28. Allied Vision, Allied Vision Technologies GmbH Taschenweg 2a, 07646 Stadtroda/Germany. Guppy PRO Technical Manual, 4.1.5
edn. (2019).
29. Vellekoop, I. M. Controlling the propagation of light in disordered scattering media. Ph.D. thesis, University of Twente, P.O. Box 217,
7500 AE Enschede, The Netherlands. (2008).
30. Smuk, A. Y. & Lawandy, N. M. Direct laser writing of diffractive optics in glass. Opt. Lett. 22, 1030–1032, 1997, DOI: 10.1364/
OL.22.001030.
31. Rahlves, M. et al. Flexible, fast, and low-cost production process for polymer based diffractive optics. Opt. Express 23, 3614–3622,
2015, DOI: 10.1364/OE.23.003614.
32. Huang, Q. et al. Design and fabrication of a diffractive optical element as a spectrum-splitting solar concentrator for lateral mul-
tijunction solar cells. Appl. Opt. 52, 2312–2319, 2013, DOI: 10.1364/AO.52.002312.
33. Divitt, S. & Novotny, L. Spatial coherence of sunlight and its implications for light management in photovoltaics. Optica 2, 95–103,
2015, DOI: 10.1364/OPTICA.2.000095.
34. Deng, Y. & Chu, D. Coherence properties of different light sources and their effect on the image sharpness and speckle of holo-
graphic displays. Scientific Reports 7, 5893. https://doi.org/10.1038/s41598-017-06215-x (2017).
35. Friberg, A. T. & Wolf, E. Relationships between the complex degrees of coherence in the space-time and in the space-frequency
domains. Opt. Lett. 20, 623–625, 1995, DOI: 10.1364/OL.20.000623.
Scientific Reports | (2021) 11:2825 | https://doi.org/10.1038/s41598-021-82110-w 6
Vol:.(1234567890)www.nature.com/scientificreports/
36. Mashaal, H. & Gordon, J. M. Fundamental bounds for antenna harvesting of sunlight. Opt. Lett. 36, 900–902, 2011, DOI: 10.1364/
OL.36.000900.
37. Mashaal, H., Goldstein, A., Feuermann, D. & Gordon, J. M. First direct measurement of the spatial coherence of sunlight. Opt.
Lett. 37, 3516–3518, 2012, DOI: 10.1364/OL.37.003516.
38. Liu, J. & Wang, J. Demonstration of polarization-insensitive spatial light modulation using a single polarization-sensitive spatial
light modulator. Scientific Reports 5, 9959. https://doi.org/10.1038/srep09959 (2015).
39. Tokel, O. et al. In-chip microstructures and photonic devices fabricated by nonlinear laser lithography deep inside silicon. Nat.
Photonics 11, 639–645. https://doi.org/10.1038/s41566-017-0004-4 (2017).
Acknowledgements
This study is financially supported by The Scientific and Technological Research Council of Turkey (TÜBİTAK),
Grant No. 118F075. We would like to thank Alpan Bek and Allard P. Mosk for providing us the essential equip-
ment. We also would like to thank Raşit Turan and Ahmet Oral for their support during the establishment of
our laboratory.
Author contributions
B.N.G. and E.Y. performed the measurements and analysis, B.N.G. wrote the manuscript. E.Y. supervised the
work and the writing process.
Competing interests
The authors declare no competing interests.
Additional information
Correspondence and requests for materials should be addressed to E.Y.
Reprints and permissions information is available at www.nature.com/reprints.
Publisher’s note Springer Nature remains neutral with regard to jurisdictional claims in published maps and
institutional affiliations.
Open Access This article is licensed under a Creative Commons Attribution 4.0 International
License, which permits use, sharing, adaptation, distribution and reproduction in any medium or
format, as long as you give appropriate credit to the original author(s) and the source, provide a link to the
Creative Commons licence, and indicate if changes were made. The images or other third party material in this
article are included in the article’s Creative Commons licence, unless indicated otherwise in a credit line to the
material. If material is not included in the article’s Creative Commons licence and your intended use is not
permitted by statutory regulation or exceeds the permitted use, you will need to obtain permission directly from
the copyright holder. To view a copy of this licence, visit http://creativecommons.org/licenses/by/4.0/.
© The Author(s) 2021
Scientific Reports | (2021) 11:2825 | https://doi.org/10.1038/s41598-021-82110-w 7
Vol.:(0123456789)You can also read