Deep learning-based imaging classification identified cingulate island sign in dementia with Lewy bodies - bioRxiv
←
→
Page content transcription
If your browser does not render page correctly, please read the page content below
bioRxiv preprint first posted online Mar. 30, 2019; doi: http://dx.doi.org/10.1101/592865. The copyright holder for this preprint
 (which was not peer-reviewed) is the author/funder, who has granted bioRxiv a license to display the preprint in perpetuity.
                                  It is made available under a CC-BY 4.0 International license.

 Deep learning-based imaging classification identified cingulate island sign in
 dementia with Lewy bodies
 Tomomichi Iizuka1 , Makoto Fukasawa2 , Masashi Kameyama3,4,*

 1 Center for Dementia, Fukujuji Hospital, Japan Anti-Tuberculosis Association, Kiyose, 204-8522, Japan
 2 Department of Nuclear Medicine, Fukujuji Hospital, Japan Anti-Tuberculosis Association, Kiyose, 204-8522,
 Japan
 3 Department of Diagnostic Radiology, Tokyo Metropolitan Geriatric Hospital, Tokyo, 173-0015, Japan
 4 Division of Nuclear Medicine, Department of Radiology, School of Medicine, Keio University, Tokyo
 160-8582, Japan

 * kame-tky@umin.ac.jp

 abstract
 The differentiation of dementia with Lewy bodies (DLB) from Alzheimer’s disease (AD) using brain perfusion
 single photon emission tomography is important but has been a challenge because these conditions have common
 features. The cingulate island sign (CIS) is the most recently identified specific feature of DLB for a differential
 diagnosis. The present study aimed to examine the usefulness of deep learning-based imaging classification for
 the diagnoses of DLB and AD. We also investigated whether CIS was focused by the deep convolutional neural
 network (CNN) during differentiation.
     Brain perfusion single photon emission tomography images were acquired from 80 patients each with DLB
 and with AD and 80 individuals with normal cognition (NL). The CNN was trained on brain surface perfusion
 images. Gradient-weighted class activation mapping (Grad-CAM) was applied to the CNN for visualization of
 the features that the trained CNN focused on.
     Binary classifications between DLB and NL, DLB and AD and AD and NL were 94.69%, 87.81% and 94.38%
 accurate, respectively. The CIS ratios closely correlated with softmax output scores for DLB-AD discrimination
 (DLB/AD scores). The Grad-CAM highlighted CIS in the DLB discrimination. Visualization of learning process
 by guided Grad-CAM revealed that CIS became more focused by the CNN as the training progressed. DLB/AD
 score was significantly associated with three core-features of DLB.
     Deep learning-based imaging classification was useful not only for objective and accurate differentiation of
 DLB from AD but also for predicting clinical features of DLB. The CIS was identified as a specific feature during
 DLB classification. The visualization of specific features and learning process could have important implications
 for the potential of deep learning to discover new imaging features.

 Introduction                                                            produce difference between DLB and AD is perfusion in
                                                                         the posterior cingulate cortex (PCC). Hypoperfusion in
                                                                         PCC is observed in the early stage of AD, whereas the
 Neuroimaging has contributed to the classification of                   PCC is relatively preserved in DLB. The phenomenon
 neurodegenerative dementias such as dementia with                       of sparing of the PCC relative to the precuneus plus
 Lewy bodies (DLB) and Alzheimers disease (AD).                          cuneus, which was termed the cingulate island sign
 Early diagnoses of DLB and AD are important from                        (CIS) [8] has recently received focus, because it reflects
 prognostic and therapeutic perspectives and to distin-                  concomitant AD pathology that impacts the clinical
 guish between them is clinically vital. Disease-specific                symptoms of DLB[9, 10]. We found that the CIS peaks
 features have been extracted from brain perfusion                       at the stage of mild dementia and gradually disappears
 single photon emission tomography (SPECT) images                        as DLB progress [11]. Thus, the CIS can help to
 to assist with differential diagnoses of DLB and AD.                    differentiate DLB from AD especially at the early stage
 Brain surface perfusion images produced by three-                       [8, 12] with some exceptions including posterior cortical
 dimensional stereotactic surface projection (3D-SSP)                    atrophy[13].
 [1] have been widely applied to statistical analysis
 that supported diagnoses of DLB and AD. A perfusion                         Recent advances in deep learning, a main branch
 decrease in the parietal association cortex (PAC) and                   of artificial intelligence that has a deep convolutional
 perfusion preservation in primary motor and primary                     neural network (CNN) capable of automatic feature
 somatosensory cortex are common in patients with                        extraction from data, have remarkably improved the
 DLB and AD [2, 3], which has interfered with distin-                    performance of image classification and detection [14,
 guishing DLB from AD on perfusion SPECT images.                         15]. Some algorithms based on deep learning have been
 An imaging feature for DLB discrimination is occipital                  proposed to recognize or differentiate AD and mild
 hypoperfusion [4, 5, 6, 7]. Another finding that can                    cognitive impairment (MCI) [16, 17]. In contrast, the
bioRxiv preprint first posted online Mar. 30, 2019; doi: http://dx.doi.org/10.1101/592865. The copyright holder for this preprint
(which was not peer-reviewed) is the author/funder, who has granted bioRxiv a license to display the preprint in perpetuity.
It is made available under a CC-BY 4.0 International license.
ability of a CNN to discriminate DLB has not been Results
investigated in detail. Furthermore, a deep learning-
based SPECT interpretation system that could differ- Deep CNN could accurately classify
entiate DLB and AD has not been described. The
brain surface perfusion images
biggest disadvantage of deep learning is that the imag-
ing features used by the CNN for classification have Table 1 summarizes the demographic and cognitive
remained unknown. However, gradient-weighted class findings of 80 persons each with AD, DLB and NL. The
activation mapping (Grad-CAM) can produce “visual deep CNN was applied to images (n = 160) including
explanations” from a CNN, which allows visualization right-left flipped images from each group of 80 patients
of areas where a CNN focuses[18, 19]. for binary classification (Figure 4). The accuracy of the
The present study aimed to objectively and auto- classification was calculated by 10-fold cross validation.
matically classify brain surface perfusion images via The binary differentiations between DLB and NL
3D-SSP of DLB, AD and individuals with normal (DLB-NL) and DLB and AD (DLB-AD) and AD and
cognition (NL) using deep 2D-CNN. We also investi- NL (AD-NL) were 94.69±4.90%, 87.81±7.85% and
gated whether a trained CNN can identify the CIS, 94.38±5.47% accurate (mean ± standard deviation),
which is the most recently recognized imaging feature respectively. The AUCs of the ROC for differentiating
of DLB. Furthermore, visualization of learning process DLB-NL, DLB-AD and AD-NL were 98.5%, 93.9% and
was performed during training of the CNN. 97.6% accurate, respectively.
Table 1: Demographic features of study participants
DLB NL AD
Participants (n) 80 80 80
Age (y) 77.7±6.3 77.1±6.8 78.0±4.9
Sex (M/F) 44/36 40/40 36/44
MMSE score 22.8±1.3∗ 29.5±0.6 22.4±1.9∗
SPECT images (n) 160 160 160
Data are shown as numbers or means ± standard deviation. ∗ p < 0.05: Tukey-Kramer test compared with NL
(two-sided). DLB, dementia with Lewy bodies; NL, normal cognition; AD, Alzheimer’s disease; MMSE,
mini-mental state examination; SPECT, single photon emission computed tomography.
The CIS ratios significantly correlated p < 0.001; Figure 1a) and DLB/NL (r = 0.267,
with DLB/AD and DLB/NL scores p < 0.05; Figure 1b) in patients with DLB. Thus,
the CIS ratio contributed more to the differentiation
Close and weakly significant correlations were found of DLB-AD than of DLB-NL.
between CIS ratios and scores for DLB/AD (r = 0.546,
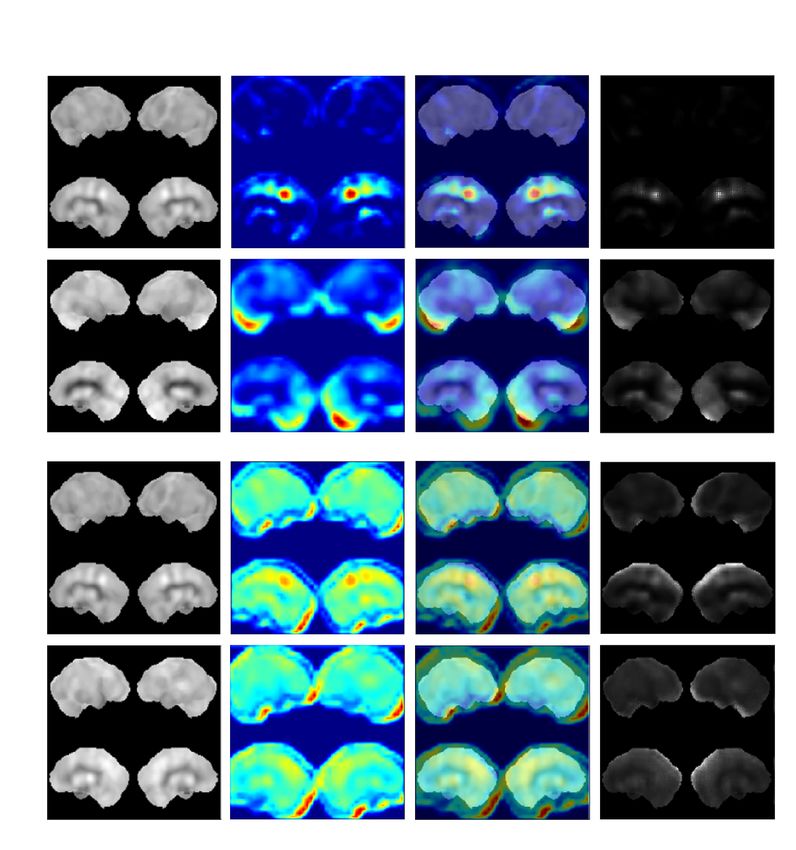
Trained CNN identified CIS for DLB CIS were also correctly labeled as DLB. In such
detection images, Grad-CAM mostly highlighted cerebellum but
not cortex. Heatmap and guided Grad-CAM for
Grad-CAM was applied to the trained CNN to produce AD highlighted occipital lobe and cerebellum, but
heatmaps and guided Grad-CAM images for DLB-AD not PCC (Figure 2b). The CIS was highlighted less
and DLB-NL discrimination. Heatmap clearly high- intensely in DLB-NL, than in DLB-AD discrimination
lighted CIS in DLB to discriminate DLB and AD (Figure 2c). Heatmap and guided Grad-CAM for NL
(Figure 2a). Guided Grad-CAM also had a limited diffusely highlighted occipital lobe, middle cingulate
range on image that focused on CIS. Brain perfusion cortex, PCC and cerebellum (Figure 2d).
images with obvious occipital hypoperfusion without
Visualization of feature extraction in the discrimination with 20 epochs, guided Grad-CAM and
learning process of CNN original images remained similar, indicating that CNN
could not yet detect specific features. After 60 training
Grad-CAM visualized learning process to extract fea- epochs, guided Grad-CAM images became narrower
tures that were useful for differentiation by showing al- and contrast became more obvious. After training
tered images (Figure 3). In CNN trained for DLB-AD with 100 epochs, CNN focused more tightly on CIS in
2bioRxiv preprint first posted online Mar. 30, 2019; doi: http://dx.doi.org/10.1101/592865. The copyright holder for this preprint
(which was not peer-reviewed) is the author/funder, who has granted bioRxiv a license to display the preprint in perpetuity.
It is made available under a CC-BY 4.0 International license.
a 1.4 b 1.4
1.3 1.3
1.2 1.2
CIS ratio
1.1
CIS ratio
1.1
1 1
0.9 0.9
0.8 0.8
0 0.2 0.4 0.6 0.8 1 0 0.2 0.4 0.6 0.8 1
DLB/AD score DLB/NL score
Figure 1: Association of CIS ratios with (a) DLB/AD and (b) DLB/NL scores. CIS ratio, DLB/AD score and
DLB/NL score in patients with DLB were 1.11 ± 0.14, 0.809 ± 0.223 and 0.859 ± 0.160, respectively (mean ±
standard deviation). CIS ratios correlated closely with (a) DLB/AD scores (r = 0.546, p < 0.001) and weakly
with (b) DLB/NL scores (r = 0.267, p < 0.05). CIS, cingulate island sign; DLB, dementia with Lewy bodies;
AD, Alzheimer’s disease; NL, normal congition.
DLB (Figure 3ab) and occipital lobe, cerebellum and toms (i.e., four core-features and verbal memory) were
sensorimotor area in AD (Figure 3cd). analyzed. DLB/AD score was significantly correlated
with hallucination, parkinsonism and RBD, but not
DLB/AD score was associated with core- with fluctuation (Table 2). In contrast, DLB/NL score
was not correlated with any of them. The CIS ratio
features of DLB
was correlated with hallucination and RBD. DLB/AD
Association between neuroimaging indices (i.e., CIS score and CIS ratio were also significantly correlated
ratio, DLB/AD and DLB/NL score) and clinical symp- with verbal memory.
Table 2: Association between neuroimaging indices and clinical symptoms of DLB
Correlation coefficient
CIS ratio DLB/AD score DLB/NL score
Hallucination 0.307∗ 0.235∗ 0.203
Fluctuation 0.148 0.117 0.078
Parkinsonism 0.104 0.319∗ 0.212
RBD 0.450∗∗ 0.268∗ 0.091
∗∗
Verbal memory 0.611 0.487∗∗ 0.201
∗
p < 0.05; ∗∗ p < 0.01: Spearman rank correlation coefficients (two-tailed). CIS, cingulate island sign; DLB,
dementia with Lewy bodies; AD, Alzheimer’s disease; NL, normal cognition; RBD, REM sleep behavioral
disorder.
Discussion learning process progressed. The indirect evidence
of the correlation coefficients might show that typical
DLB has a higher CIS ratio. However, the trained
Our CNN identified the CIS as an imaging feature
CNN automatically and objectively identified the CIS
during DLB-AD discrimination. The CIS ratios
as an important feature of DLB prediction, considering
closely correlated with DLB/AD scores. Furthermore,
that the Grad-CAM could visualize the target of CNN
heatmaps generated by the Grad-CAM highlighted the
for the classification. The present findings defined the
CIS in DLB. The guided Grad-CAM also focused on
potential of deep learning to discover new features in
the CIS and became restricted to the CIS as the
3bioRxiv preprint first posted online Mar. 30, 2019; doi: http://dx.doi.org/10.1101/592865. The copyright holder for this preprint
(which was not peer-reviewed) is the author/funder, who has granted bioRxiv a license to display the preprint in perpetuity.
It is made available under a CC-BY 4.0 International license.
Or
igi
nalI
mage Heat
map Heat
mapOv
erl
ay Gui
dedGr
ad-
CAM
a
b
c
d
Figure 2: Visualization of features that the trained CNN recognized. Grad-CAM was applied to CNN trained
with 100 epochs and produced heatmap, heatmap overlay and guided Grad-CAM. Original and Grad-CAM
images from one patient with DLB in the DLB-AD (a) and DLB-NL (c) discrimination, respectively. Original
and Grad-CAM images from a patient with AD in the DLB-AD discrimination (b). Original and Grad-CAM
images from an individual with NL in the DLB-NL discrimination (d). Original images of (a), (b), (c) and
(d) were correctly predicted. CNN, convolutional neural network; DLB, dementia with Lewy bodies; AD,
Alzheimer’s disease; NL, normal congition; Grad-CAM, gradient-weighted class activation mapping.
the field of image diagnosis. racy. The distribution on brain perfusion and glucose
metabolism images was similar [20]. Brain surface
Deep CNN could accurately classify brain surface perfusion images represent extracted features that are
perfusion images. The classification accuracies of useful for discriminating neurodegenerative dementia.
DLB-NL, DLB-AD and AD-NL were 94.69%, 87.81% It provides us a bird’s-eye view. Furthermore, 3D-
and 94.38%, respectively. Most previous studies using CNN needs much more calculation to converge more
deep learning-based classification aimed to diagnose parameters than 2D-CNN. Thus, 2D-CNN with brain
AD and MCI but not DLB using 3D-CNN, and the surface perfusion images classified more efficiently than
CNN diagnosis of DLB using FDG PET or perfusion 3D-CNN with whole brain images; our method, which
SPECT has never been reported. Suk et al.[17] can be operated in a standard computer has potential
showed that the mean accuracies of MRI, FDG PET to prevail in clinical settings.
and MRI+PET with 3D-CNN were 92.38%, 92.20%
and 95.35%, respectively. Liu et al.[16] generated The CIS was more involved in the discrimination
accuracies of 90.18% (MRI), 89.13% (PET) and 90.27% of DLB-AD rather than of DLB-NL, considering the
(MRI+PET). Our 2D-CNN with brain surface per- higher correlation coefficients of the CIS ratios and
fusion images extracted from whole brain perfusion DLB/AD scores than the CIS ratios and DLB/NL
SPECT data reached comparable discriminative accu- scores. The Grad-CAM supported this notion by
4bioRxiv preprint first posted online Mar. 30, 2019; doi: http://dx.doi.org/10.1101/592865. The copyright holder for this preprint
(which was not peer-reviewed) is the author/funder, who has granted bioRxiv a license to display the preprint in perpetuity.
It is made available under a CC-BY 4.0 International license.
Or
igi
nali
mage Gui
dedGr
ad-
CAM
Epoch: 20 60 100
a
b
c
d
Figure 3: Alteration of guided Grad-CAM images in the learning process. Original and guided Grad-CAM
images are from two patients each with DLB and AD. Two patients each with DLB (a) and (b), and AD (c)
and (d). Training accuracies at 20, 60 and 100 epochs were 0.7682, 0.8922 and 0.9850, respectively. Validation
accuracies at 20, 60 and 100 epochs were 0.6250, 0.7500 and 0.8750, respectively. Thus, 100 epochs was regarded
as appropriate for training. The guided Grad-CAM images of both DLB and AD became reduced with increasing
number of epochs. Original images of (a), (b), (c) and (d) were correctly predicted. CIS, cingulate island sign;
DLB, dementia with Lewy bodies; AD, Alzheimer’s disease; Grad-CAM, gradient-weighted class activation
mapping.
focusing on the CIS as an imaging feature of DLB in the produced by concomitant AD pathology. Therefore,
DLB-AD and DLB-NL discrimination. Heatmap and low CIS ratios and DLB/AD scores represent a high
guided Grad-CAM highlighted the CIS in the DLB- degree of concomitant AD pathology. Conversely, high
AD discrimination, while CIS was less highlighted in CIS ratios and DLB/AD scores represent “pure” DLB.
the DLB-NL discrimination. As DLB and AD have This explains why the CIS ratios had a good correlation
common features such as rCBF decreases in the PAC, with DLB/AD scores.
classification is usually more difficult for DLB-AD than
DLB-NL. Most patients with DLB have concomitant The Grad-CAM revealed that the CNN classified
AD pathology[21], which reportedly affects the CIS of SPECT images in a manner unlike that of humans.
patients with DLB. Specifically, the CIS is not obvious Nuclear medicine physicians simultaneously evaluate
in DLB with abundant AD pathology. Similar to the these hypoperfused areas and preserved regions to
CIS ratios, DLB/AD scores in DLB also reflect the differentiate DLB from AD and often consider con-
degree of imaging features of AD that are presumably trast of preserved and decreased areas. In contrast,
heatmaps generated by the Grad-CAM were placed
5bioRxiv preprint first posted online Mar. 30, 2019; doi: http://dx.doi.org/10.1101/592865. The copyright holder for this preprint
(which was not peer-reviewed) is the author/funder, who has granted bioRxiv a license to display the preprint in perpetuity.
It is made available under a CC-BY 4.0 International license.
only on regions with preserved rCBF in both AD [16, 17]. Although the ability of a 2D-CNN with brain
and DLB in the appropriately trained CNN. Guided surface perfusion images was comparable to previous
Grad-CAM images became narrower and restricted findings with such combinations, future studies should
to more preserved regions as learning progresses. In examine combinations of perfusion SPECT with other
line with these findings, the CNN focused only on imaging modalities to enhance accuracy.
preserved regions to classify brain surface perfusion
images of both DLB and AD. Regardless of the manner
of classification, the CNN still identified the CIS as an Conclusions
important imaging feature of DLB.
DLB/AD score was significantly correlated with Deep learning-based imaging classification was useful
scores of three core-features, namely hallucination, not only for objective and accurate differentiation of
parkinsonism and RBD. In contrast, DLB/NL score DLB from AD but also for predicting clinical features
was not correlated with any of them. The finding of DLB. The CIS was identified as a specific feature
suggested that DLB/AD scores closely represented during DLB classification. The visualization of specific
various symptoms of DLB. Similar to DLB/AD score, features and learning process could have important
CIS ratio was also correlated with hallucination and implications for the potential of deep learning to
RBD. As CIS is reportedly reflects AD pathology, close discover new imaging features.
correlation of CIS ratio with DLB/AD score indicated
that DLB/AD score also reflects comorbid AD pathol-
ogy. Hallucination was frequently observed in DLB Methods
without AD pathology [22]. Manifestation of RBD
was reportedly associated with less severe concomitant Participants
AD pathology[23]. Our finding was consistent with the Brain perfusion SPECT images of 80 persons each
previous reports showing the association between core- with DLB, AD and NL were included for diagnostic
features and AD pathology. Furthermore, DLB/AD classification and CNN learning. Cognitive function
score was also correlated with verbal memory score, was evaluated using the Clinical Dementia Rating and
which reflects the fact that memory impairment is the Mini-Metal Status Examination (MMSE). Proba-
prominent in patients with AD rather than those with ble DLB and probable AD were diagnosed according
DLB. Thus, DLB/AD score was useful not only for the to the McKeith criteria[26] and the criteria of the
discrimination but also for predicting clinical features National Institute for Neurological and Communicative
of DLB. Diseases Alzheimer’s Disease and Related Disorders
Our deep learning system would be beneficial to Association [29], respectively. Hallucination, fluctu-
health care finance. Dopamine transporter (DaT) ation of consciousness, parkinsonism and REM sleep
imaging[24] and [123 I] MIBG cardiac sympathetic nerve behavioral disorder (RBD) were assessed by Neu-
scintigraphy[25] are authentic in clinically discriminat- ropsychiatric Inventory (NPI), Clinician Assessment
ing DLB from AD and the DLB guidelines treat DaT of Fluctuation[30], United Parkinson’s Disease Rating
imaging and [123 I] MIBG scintigraphy as indicative Scale-Motor Score (UPDRS-MS) and Japanese version
biomarkers[26]. However, to assess all amnestic pa- of the REM sleep behavior disorder screening ques-
tients using two more nuclear medicine examinations tionnaire (RBDSQ-J)[31], respectively. Verbal memory
might be too costly. Brain perfusion SPECT is was evaluated using sum of the five recall trials (1-5)
more commonly used to detect AD, especially when of Ray Auditory Verbal Learning Test (RAVLT).
a diagnosis is uncertain. Consequently, we suggest All procedures were approved by the Ethical Re-
that our diagnostic system and perfusion SPECT could view Board at Fukujuji Hospital. We followed the
be initially applied to investigate DLB in patients clinical study guidelines of Fukujuji Hospital, which
with suspected AD before using DaT and cardiac conformed to the Declaration of Helsinki (2013). We
sympathetic nerve imaging. provided the healthy volunteers, patients and their
This study has several limitations. Each group families with detailed information about the study, and
comprised only 160 augmented images from 80 in- all provided written informed consent to participate.
dividuals because this study proceeded at a single
institution. However, our brain surface perfusion Brain perfusion SPECT imaging
images were normalized by 3D-SSP and applied only to
binary classification. Therefore, we considered that the Persons resting with their eyes closed and ears un-
accuracy was sufficient regardless of the limited number plugged were assessed by SPECT using a Symbia
of patients. The accuracy of FDG PET might be Evo Excel with [123 I] IMP, a gamma camera (Siemens
better, but perfusion SPECT is more accessible, and it Medical Solutions, Malvern, PA, USA) and fan beam
has been proven as a valid alternative in the absence of collimators. Fifteen minutes after an intravenous
FDG PET [27] and images with [123 I] IMP shows good infusion of [123 I] IMP (167 MBq), SPECT images were
contrast due to its high first-pass extraction[11, 28]. acquired in a 128 × 128 matrix with a slice thickness
Recent CNN studies have attempted to enhance accu- of 1.95 mm (1 pixel) over a period of 30-40 min. The
racy using various combinations of imaging modalities images were reconstructed by filtered back projection
6bioRxiv preprint first posted online Mar. 30, 2019; doi: http://dx.doi.org/10.1101/592865. The copyright holder for this preprint
(which was not peer-reviewed) is the author/funder, who has granted bioRxiv a license to display the preprint in perpetuity.
It is made available under a CC-BY 4.0 International license.
using a Butterworth filter, attenuation was corrected Thereafter, ReLU activation and max pooling of a 2 ×
using the Chang method (attenuation coefficient = 0.1 2 pool proceeded. The second convolutional layer with
cm−1 ) and scatter was corrected using a triple energy a 5 × 5 × 32 filter and 92 × 92 × 32 output was followed
window. Brain surface perfusion images produced by the ReLU activation and max-pooling layers. The
using 3D-SSP[1] were augmented by flipping from left third convolutional layer with a 3 × 3 × 64 filter and 44
to right. The regional cerebral blood flow (rCBF) in × 44 × 64 output was followed by the ReLU activation
regions of interest (ROI) on the PCC, precuneus and and max-pooling layers. The last convolutional layer
cuneus was measured as described[11]. The mean value with a 5 × 5 × 32 filter and 18 × 18 × 32 output
in the bilateral PCC ROI was divided by the mean was followed by the ReLU activation and max pooling
value in the bilateral precuneus plus cuneus ROI to layers that produced a 9 × 9 × 32 output. Thereafter, a
derive CIS ratios from [123 I] IMP SPECT images. fully connected layer generated output, then a softmax
function was applied to discriminate two labels. The
Preparation for deep convolutional neu- softmax produces two numerical values of which the
sum becomes 1.0. The output values for the binary
ral network
differentiation of DLB-NL, DLB-AD and AD-NL are
Figure 4 summarizes the architecture of our deep expressed as DLB/NL, DLB/AD and AD/NL scores,
CNN. The network was built with TensorFlow (Google, respectively. We employed binary discrimination to
Mountain View, CA, USA), a deep learning framework. know if CNN recognizes CIS differently in discriminat-
We did not use transfer learning to visualize the process ing DLB-AD and DLB-NL. The network was trained
of learning. After the convolution operation, rectified to minimize cross entropy losses between the predicted
linear unit (ReLU) and max-pooling operations pro- and true diagnoses based on the images. The CNN was
ceeded on the output of convolution. The ReLU kept trained for 100 epochs. The momentum parameter was
positive input values whereas negative input values 0.9 and the learning rate was 0.0001. To visualize the
were changed to zeros. The max-pooling operation decision made by the CNN, Grad-CAM was applied
selected the maximum value and input this value into to the CNN. The Grad-CAM uses the gradients of
a smaller feature map. Input data were extracted from any target flowing into the final convolutional network
brain perfusion SPECT images. The input image had to produce heatmaps that highlight important regions
a matrix of 200 × 200 pixels, which is a composite of upon which the CNN focuses. A guided Grad-CAM
2 lateral and 2 medial surface images. Input values was created by fusing existing pixel-space gradient
of voxels were rescaled within a range of 0 to 255, and visualizations with the Grad-CAM to achieve both
then the mean scalar value of each SPECT volume was high-resolution and class-discrimination. We also used
subtracted. The images were passed through the first Grad-CAM to visualize learning process of the CNN
convolutional layer which produced 193 × 193 × 32 trained with perfusion images.
output images after the 8 × 8 × 32 convolutional filter.
binary
classification
Max-Pooling
Max-Pooling
ReLU
Convolution
Convolution
Max-Pooling
ReLU
Convolution
Softmax
Max-Pooling
ReLU
Convolution
ReLU
Fully connected layer
DLB DLB AD
8 2 5 2 3 5
2 2 NL AD NL
× ×
× ×
× ×
× ×
×
8
×
5
×
3
×
2 2 2 5 2
32 32 64 32
Input Output
Figure 4: Architecture of deep convolutional neural network
7bioRxiv preprint first posted online Mar. 30, 2019; doi: http://dx.doi.org/10.1101/592865. The copyright holder for this preprint
(which was not peer-reviewed) is the author/funder, who has granted bioRxiv a license to display the preprint in perpetuity.
It is made available under a CC-BY 4.0 International license.
Statistics [9] Graff-Radford, J. et al. Dementia with
Lewy bodies basis of cingulate island
The diagnostic and predictive accuracy of the CNN sign. Neurology 83, 801–809 (2014). DOI
was calculated from 10.0% data from the train- 10.1212/WNL.0000000000000734.
ing/validation set and 10-fold cross validation. An
original images and its right-left flip image were in a [10] Iizuka, T. & Kameyama, M. Cingulate island
same set of training or validation. Binary classification sign on FDG-PET is associated with medial
scores were evaluated using the receiver operating temporal lobe atrophy in dementia with Lewy
characteristic (ROC) curve analysis and area under bodies. Ann Nucl Med 30, 421–429 (2016). DOI
the curve (AUC). Correlations between CIS ratios 10.1007/s12149-016-1076-9.
and DLB/AD or DLB/NL scores were assessed using
Spearman rank correlation coefficients. All statistical [11] Iizuka, T., Iizuka, R. & Kameyama, M. Cingulate
analyses were performed with EZR (Saitama Medical island sign temporally changes in dementia with
Center, Jichi Medical University, Saitama, Japan), Lewy bodies. Sci Rep 7, 14745 (2017). DOI
which is a graphical user interface for R (The R Foun- 10.1038/s41598-017-15263-2.
dation for Statistical Computing, Vienna, Austria).
[12] Imabayashi, E. et al. The cingulate island sign
More precisely, it is a modified version of R commander
within early Alzheimer’s disease-specific hypoper-
designed to add statistical functions frequently used in
fusion volumes of interest is useful for differen-
biostatistics.
tiating Alzheimer’s disease from dementia with
Lewy bodies. EJNMMI Res 6, 67 (2016). DOI
10.1186/s13550-016-0224-5.
References
[13] Whitwell, J. L. et al. 18 F-FDG PET in pos-
[1] Minoshima, S., Frey, K. A., Koeppe, R. A., Foster, terior cortical atrophy and dementia with Lewy
N. L. & Kuhl, D. E. A diagnostic approach bodies. J Nucl Med 58, 632 (2017). DOI
in Alzheimer’s disease using three-dimensional 10.2967/jnumed.116.
stereotactic surface projections of fluorine-18-
FDG PET. J Nucl Med 36, 1238–48 (1995). [14] LeCun, Y., Bengio, Y. & Hinton, G. Deep
learning. Nature 521, 436–444 (2015). DOI
[2] Syed, G., Eagger, S., O’brien, J., Barrett, J. & 10.1038/nature14539.
Levy, R. Patterns of regional cerebral blood flow
in Alzheimer’s disease. Nucl Med Commun 13, [15] Krizhevsky, A., Sutskever, I. & Hinton, G. E.
656–663 (1992). ImageNet classification with deep convolutional
neural networks. In Adv Neural Inf Process Syst,
[3] Kogure, D. et al. Longitudinal evaluation of early 1097–1105 (2012).
Alzheimer’s disease using brain perfusion SPECT.
J Nucl Med 41, 1155–1162 (2000). [16] Liu, M., Zhang, D., Shen, D. & Alzheimer’s Dis-
ease Neuroimaging Initiative. Hierarchical fusion
[4] Ishii, K. et al. Regional cerebral blood flow of features and classifier decisions for Alzheimer’s
difference between dementia with Lewy bodies disease diagnosis. Hum Brain Mapp 35, 1305–
and AD. Neurology 53, 413–416 (1999). DOI 1319 (2014). DOI 10.1002/hbm.22254.
10.1212/WNL.53.2.413.
[17] Suk, H.-I., Lee, S.-W., Shen, D. & Alzheimer’s
[5] Lobotesis, K. et al. Occipital hypoperfusion Disease Neuroimaging Initiative. Hierarchi-
on SPECT in dementia with Lewy bodies but cal feature representation and multimodal fu-
not AD. Neurology 56, 643–649 (2001). DOI sion with deep learning for AD/MCI diagno-
10.1212/WNL.56.5.643. sis. NeuroImage 101, 569–582 (2014). DOI
99m 10.1016/j.neuroimage.2014.06.077.
[6] Pasquier, J. et al. Value of Tc-ECD SPET for
the diagnosis of dementia with Lewy bodies. Eur [18] Selvaraju, R. R. et al. Grad-CAM: Visual ex-
J Nucl Med Mol Imaging 29, 1342–1348 (2002). planations from deep networks via gradient-based
DOI 10.1007/s00259-002-0919-x. localization. In ICCV, 618–626 (2017).
[7] Kantarci, K. et al. Multimodality imaging [19] Selvaraju, R. R. et al. Grad-CAM: Visual ex-
characteristics of dementia with Lewy bodies. planations from deep networks via gradient-based
Neurobiol Aging 33, 2091–2105 (2012). DOI localization. arXiv preprint arXiv:1610.02391
10.1016/j.neurobiolaging. (2016).
[8] Lim, S. M. et al. The 18 F-FDG PET cingu- [20] Nedelska, Z. et al. Regional cortical perfusion
late island sign and comparison to 123 I-β-CIT on arterial spin labeling MRI in dementia with
SPECT for diagnosis of dementia with Lewy Lewy bodies: Associations with clinical severity,
bodies. J Nucl Med 50, 1638–1645 (2009). DOI glucose metabolism and tau PET. NeuroImage
10.2967/jnumed.109.065870. Clin (2018). DOI 10.1016/j.nicl.2018.06.020.
8bioRxiv preprint first posted online Mar. 30, 2019; doi: http://dx.doi.org/10.1101/592865. The copyright holder for this preprint
(which was not peer-reviewed) is the author/funder, who has granted bioRxiv a license to display the preprint in perpetuity.
It is made available under a CC-BY 4.0 International license.
[21] Hepp, D. H. et al. Distribution and load Cereb Blood Flow Metab 34, 1157–1161 (2014).
of amyloid-β pathology in Parkinson disease DOI 10.1038/jcbfm.2014.64.
and dementia with Lewy bodies. J Neu-
ropathol Exp Neurol 75, 936–945 (2016). DOI [29] McKhann, G. M. et al. The diagnosis of dementia
10.1093/jnen/nlw070. due to Alzheimer’s disease: Recommendations
from the National Institute on Aging-Alzheimer’s
[22] Del Ser, T., Hachinski, V., Merskey, H. & Munoz, Association workgroups on diagnostic guidelines
D. G. Clinical and pathologic features of two for Alzheimer’s disease. Alzheimers Dement 7,
groups of patients with dementia with Lewy bod- 263–269 (2011). DOI 10.1016/j.jalz.2011.03.005.
ies: effect of coexisting Alzheimer-type lesion load.
Alzheimer Dis Assoc Disord 15, 31–44 (2001). [30] Walker, M. et al. The clinician assessment of
fluctuation and the one day fluctuation assessment
[23] Murray, M. E. et al. MRI and pathology of REM scale: two methods to assess fluctuating confusion
sleep behavior disorder in dementia with Lewy in dementia. Br J Psychiatry 177, 252–256
bodies. Neurology 81, 1681–1689 (2013). DOI (2000). DOI 10.1192/bjp.177.3.252.
10.1212/01.wnl.0000435299.57153.f0.
[31] Miyamoto, T. et al. The REM sleep behavior
[24] Walker, Z. et al. Differentiation of dementia disorder screening questionnaire: validation study
with Lewy bodies from Alzheimer’s disease using of a Japanese version. Sleep Med 10, 1151–1154
a dopaminergic presynaptic ligand. J Neurol (2009). DOI 10.1016/j.sleep.2009.05.007.
Neurosurg Psychiatry 73, 134–140 (2002). DOI
10.1136/jnnp.73.2.134.
[25] Yoshita, M. et al. Diagnostic accuracy of 123 I-
Acknowledgements
meta-iodobenzylguanidine myocardial scintigra-
This study was partly supported by Grant-in-Aid
phy in dementia with Lewy bodies: a multicenter
for Scientific Research (Kakenhi) Grant number
study. PLoS One 10, e0120540 (2015). DOI
18K07488.
10.1212/01.wnl.0000219640.59984.a7.
[26] McKeith, I. G. et al. Diagnosis and
management of dementia with Lewy bodies: Author contributions statement
Fourth consensus report of the DLB
T.I. contributed to conceptualization, patient recruit-
consortium. Neurology 89, 88–100 (2017).
ment, investigation, project administration and the
DOI 10.1212/WNL.0000000000004058.
initial draft manuscript preparation. T.I. and M.F.
[27] Sanchez-Catasus, C. A. et al. FDG-PET for built CNN, analysed the data and produced figures.
prediction of AD dementia in mild cognitive im- M.K. advised the project and revised the manuscript.
pairment. A review of the state of the art with All the authors discussed the project and have read
particular emphasis on the comparison with other and approved the final manuscripts.
neuroimaging modalities (MRI and perfusion
SPECT). Curr Alzheimer Res 14, 127–142 (2017).
DOI 10.2174/1567205013666160629081956. Additional information
[28] Kameyama, M. Lassen’s equation is a good ap- Competing financial interests M.K. received re-
proximation of permeability-surface model: New search funding from Fujifilm RI Pharma, Nihon Med-
α values for 99m Tc-HMPAO and 99m Tc-ECD. J Physics, and Daiichi-Sankyo.
9You can also read