Physical activity attenuates the associations of systemic immune inflammation index with total and cause specific mortality among middle aged and ...
←
→
Page content transcription
If your browser does not render page correctly, please read the page content below
www.nature.com/scientificreports

                OPEN              Physical activity attenuates
                                  the associations of systemic
                                  immune‑inflammation index
                                  with total and cause‑specific
                                  mortality among middle‑aged
                                  and older populations
                                  Hang Li, Xiulong Wu, Yansen Bai, Wei Wei, Guyanan Li, Ming Fu, Jiali Jie, Chenming Wang,
                                  Xin Guan, Yue Feng, Hua Meng, Mengying Li, Meian He, Xiaomin Zhang & Huan Guo*

                                  Systemic immune-inflammation index (SII) emerged as a biomarker of chronic inflammation and an
                                  independent prognostic factor for many cancers. We aimed to investigate the associations of SII level
                                  with total and cause-specific mortality risks in the general populations, and the potential modification
                                  effects of lifestyle-related factors on the above associations. In this study, we included 30,521 subjects
                                  from the Dongfeng-Tongji (DFTJ) cohort and 25,761 subjects from the National Health and Nutrition
                                  Examination Survey (NHANES) 1999–2014. Cox proportional hazards regression models were used to
                                  estimate the associations of SII with mortality from all-cause, cardiovascular diseases (CVD), cancer
                                  and other causes. In the DFTJ cohort, compared to subjects in the low SII subgroup, those within the
                                  middle and high SII subgroups had increased risks of total mortality [hazard ratio, HR (95% confidence
                                  interval, CI) = 1.12 (1.03–1.22) and 1.26 (1.16–1.36), respectively) and CVD mortality [HR (95%CI) = 1.36
                                  (1.19–1.55) and 1.50 (1.32–1.71), respectively]; those within the high SII subgroup had a higher risk
                                  of other causes mortality [HR (95%CI) = 1.28 (1.09–1.49)]. In the NHANES 1999–2014, subjects in the
                                  high SII subgroup had higher risks of total, CVD, cancer and other causes mortality [HR (95%CI) = 1.38
                                  (1.27–1.49), 1.33 (1.11–1.59), 1.22 (1.04–1.45) and 1.47 (1.32–1.63), respectively]. For subjects with
                                  a high level of SII, physical activity could attenuate a separate 30% and 32% risk of total and CVD
                                  mortality in the DFTJ cohort, and a separate 41% and 59% risk of total and CVD mortality in the
                                  NHANES 1999–2014. Our study suggested high SII level may increase total and CVD mortality in the
                                  general populations and physical activity exerted a beneficial effect on the above associations.

                                  Abbreviations
                                  CVD	Cardiovascular disease
                                  WBC	White blood cell
                                  NLR	Neutrophil-to-lymphocyte ratio
                                  PLR	Platelet-to-lymphocyte ratio
                                  SII	Systemic immune-inflammation index
                                  DFTJ	Dongfeng-Tongji
                                  NHANES	National Health and Nutrition Examination Survey
                                  BMI	Body mass index
                                  ICD-10	10th Revision of the international classification of diseases
                                  IQR	Interquartile range

                                  Department of Occupational and Environmental Health, Key Laboratory of Environment & Health, Ministry of
                                  Education; State Key Laboratory of Environmental Health (Incubating), School of Public Health, Tongji Medical
                                  College, Huazhong University of Science and Technology, 13 Hangkong Rd, Wuhan 430030, Hubei, China. *email:
                                  ghuan5011@hust.edu.cn

Scientific Reports |   (2021) 11:12532               | https://doi.org/10.1038/s41598-021-91324-x                                            1

                                                                                                                                         Vol.:(0123456789)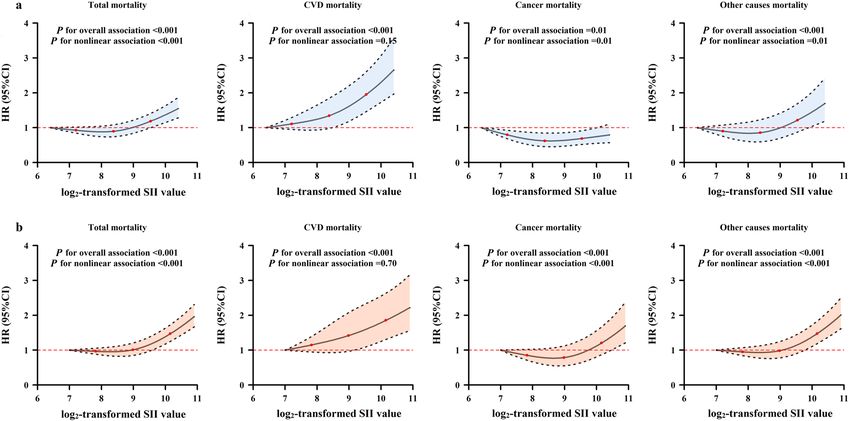
www.nature.com/scientificreports/
HR Hazard ratio
CI Confidence interval
IL Interleukin
Systemic chronic inflammation has been considered as an important risk factor for the development of multi-
ple chronic diseases, including cardiovascular disease (CVD), cancer, and d iabetes1, which account for more
than 50% of total d eaths2. Since systemic chronic inflammation always developed in the absence of clinical
manifestations, available and reliable systemic inflammatory markers could help identify high-risk populations
and develop therapeutic strategies, which were important for reducing the burden of chronic diseases. Many
observational studies have documented the associations of blood-based inflammatory markers with disease
morbidity and mortality3–5. Elevated white blood cell (WBC) count was independently associated with increased
risks of incident C VD6, cancer4, and m ortality7,8, while the roles of WBC subtypes and other blood cells such as
platelets on mortality have been also investigated i ndividually9–11. As blood cells could interact with each other
and then play essential roles in chronic inflammation-related diseases, the composite indices, such as neutrophil-
to-lymphocyte ratio (NLR) and platelet-to-lymphocyte ratio (PLR), were considered to be potential prognostic
factors for patients with CVD and c ancer12–14, as well as markers for predicting CVD incidence and mortality
in the general p opulations15,16.
Recently, the systemic immune-inflammation index (SII), calculated based on the neutrophil, lymphocyte
and platelet counts in peripheral blood, was put forward to reflect the balance of systemic inflammation and
immune status17. Previous studies implicated that an elevated level of SII was associated with poor prognosis of
patients with certain malignancies, i.e., hepatocellular carcinoma17, colorectal cancer18, and pancreatic cancer19.
Two cohort studies embedded in the Rotterdam Study found that high SII level was associated with the risks of
solid cancer and d ementia20,21. One recent cohort study of 85,154 Chinese participants reported that high SII
was associated with 24% increased total mortality risk22, but its association with cause-specific mortality risk was
not evaluated. Compelling evidence has suggested that unhealthy lifestyle factors, including smoking, alcohol
drinking, physical inactivity, and being overweight or obese, contributed to about 60% of d eaths23, and were
linked to chronic inflammation s tatus1, which underscored the potential modification roles of these factors on
the effects of chronic inflammation.
In this study, we aimed to examine the associations of SII with total and cause-specific mortality in the
general middle-aged and older populations of two large prospective cohort studies, including the Dongfeng-
Tongji (DFTJ) cohort and National Health and Nutrition Examination Survey (NHANES). We also explored
the modification effects of the general characteristics [age, sex, body mass index (BMI)] and common lifestyle
factors (smoking, alcohol drinking and physical activity status) on the above associations.
Results
Among the 30,521 participants in the DFTJ cohort [median (interquartile range, IQR) for age, 62.2 (56.2–68.0)
years old], the median (IQR) of SII was 332.71 (236.91–467.61) × 109/L. There were 3311 deaths occurring during
a mean follow-up time of 8.2 years, including 1339 CVD deaths, 1081 cancer deaths, and 891 other causes deaths.
Among the 25,761 participants in the NHANES 1999–2014 [median (IQR) for age, 54.5 (46.5–65.4) years old],
the median (IQR) for SII was 505.14 (366.96–705.63) × 109/L. There were 4828 deaths occurring during a mean
follow-up time of 7.6 years, including 1093 CVD deaths, 1032 cancer deaths, and 2703 other causes deaths. As
shown in Table 1, compared to survivors, the deceased participants were more likely to be males, elders, non-
Hispanic Whites (only in the NHANES 1999–2014), smokers, less educated, physically inactive, and had a greater
prevalence of hypertension, diabetes, CVD and cancer (all P < 0.05). Additionally, the deceased participants
had higher neutrophil count and lower platelet count than survivors (both P < 0.05). The baseline SII level of
the deceased participants was significantly higher than that of survivors in the NHANES 1999–2014 [median
(IQR) for SII, 562.92 (392.70–824.09) × 109/L vs. 497.68 (363.66–690.55) × 109/L, P < 0.001]; however, this dif-
ference was not seen among subjects in the DFTJ cohort [median (IQR) for SII, 343.10 (229.48–487.99) × 109/L
vs. 331.70 (237.40–465.00) × 109/L, P = 0.21]. The SII level was positively associated with BMI and smoking, but
was inversely associated with age and physical activity in both cohorts (all P < 0.05, Supplementary Table S1).
The associations of baseline SII with total and cause‑specific mortality. In both cohorts, since
the hazard ratios (HRs) for the associations of baseline SII with total and cause-specific mortality were relatively
stable before the 50th percentile of SII and were steeper at a higher SII level (Fig. 1), we then classified partici-
pants into low, middle and high SII subgroups according to the 50th and 75th percentiles of SII among survivors
in each cohort, and set the low SII subgroup as the reference. In the DFTJ cohort, subjects in the middle and high
SII subgroups had higher risks of total mortality [HR (95%CI) = 1.12 (1.03–1.22) and 1.26 (1.16–1.36), respec-
tively] and CVD mortality [HR (95%CI) = 1.36 (1.19–1.55) and 1.50 (1.32–1.71), respectively]; those in high SII
subgroup had a significantly increased risk of other causes mortality [HR (95%CI) = 1.28 (1.09–1.49)]. There
was no significant association between SII level and cancer mortality (P > 0.05). In the NHANES 1999–2014,
subjects in the high SII subgroup had increased risks of total, CVD, cancer, and other causes mortality [HR
(95%CI) = 1.38 (1.27–1.49), 1.33 (1.11–1.59), 1.22 (1.04–1.45) and 1.47 (1.32–1.63), respectively, Table 2]. In
both cohorts, the sensitivity analyses by excluding subjects taking medicines that may influence the SII level,
deaths occurring during the first year of follow-up, or subjects with prevalent CVD or cancer did not materially
change the results (Supplementary Tables S2 and S3).
Effect modifications by general characteristics and lifestyles. In the NHANES 1999–2014, we
observed significant modification effect of physical activity on the association between SII and total mortality
Scientific Reports | (2021) 11:12532 | https://doi.org/10.1038/s41598-021-91324-x 2
Vol:.(1234567890)www.nature.com/scientificreports/
Variables All participants Survivors Deaths Pa
DFTJ cohort
No 30,521 27,210 3311
Males 13,685 (44.8) 11,519 (42.3) 2166 (65.4) < 0.001
Age (years) 62.2 (56.2–68.0) 62.0 (55.8–66.3) 70.0 (64.0–76.0) < 0.001
BMI (kg/m2) 24.1 (22.0–26.4) 24.1 (22.1–26.3) 24.2 (21.9–26.6) 0.67
Smokers 9034 (29.6) 7493 (27.5) 1541 (46.5) < 0.001
Alcohol drinkers 8730 (28.6) 7596 (27.9) 1134 (34.3) < 0.001
Education < 0.001
Below high school 18,192 (59.6) 15,842 (58.2) 2350 (71.0)
High school 8499 (27.9) 7912 (29.1) 587 (17.7)
College or above 3466 (11.4) 3140 (11.5) 326 (9.9)
Missing 364 (1.2) 316 (1.2) 48 (1.5)
Physically active 24,544 (80.4) 22,036 (81.0) 2508 (75.8) < 0.001
Disease history
Hypertension 16,678 (54.6) 14,395 (52.9) 2283 (69.0) < 0.001
Hyperlipidemia 16,122 (52.8) 14,348 (52.7) 1774 (53.6) 0.36
Diabetes 6090 (20.0) 5027 (18.5) 1063 (32.1) < 0.001
CVD 5226 (17.1) 4170 (15.3) 1056 (31.9) < 0.001
Cancer 834 (2.7) 636 (2.3) 198 (6.0) < 0.001
Neutrophils (× 109/L) 3.29 (2.61–4.10) 3.23 (2.60–4.03) 3.60 (2.84–4.50) < 0.001
Lymphocytes (× 109/L) 1.83 (1.47–2.27) 1.82 (1.47–2.26) 1.87 (1.46–2.35) 0.01
Platelets (× 109/L) 188 (155–225) 189 (157–226) 176 (142–216) < 0.001
SII (× 109/L) c 332.71 (236.91–467.61) 331.70 (237.40–465.00) 343.10 (229.48–487.99) 0.21
NHANES 1999–2014
No 25,761 20,933 4828 –
Males 12,640 (47.1) 9932 (46.5) 2708 (51.1) < 0.001
Age (years) 54.5 (46.5–65.4) 52.8 (45.7–62.4) 71.7 (59.8–79.3) < 0.001
Race
Non-hispanic white 12,892 (75.0) 9956 (74.4) 2936 (78.8) < 0.001
Non-Hispanic Black 5132 (9.8) 4265 (9.8) 867 (10.1)
Mexican American 4276 (5.6) 3575 (5.8) 701 (4.0)
Other 3461 (9.6) 3137 (10.0) 324 (7.1)
BMI (kg/m2) 28.0 (24.6–32.2) 28.1 (24.7–32.3) 27.4 (24.0–31.6) < 0.001
Smokers 12,985 (50.2) 10,135 (48.6) 2850 (60.2) < 0.001
Alcohol drinkers 16,283 (68.2) 13,452 (69.6) 2831 (59.3) < 0.001
Education < 0.001
Below high school 8041 (19.5) 5955 (17.2) 2086 (33.7)
High school 5937 (24.6) 4796 (24.1) 1141 (27.4)
College or above 11,737 (55.8) 10,160 (58.6) 1577 (38.5)
Missing 46 (0.1) 22 (0.1) 24 (0.4)
Physically active 6798 (31.5) 5949 (33.3) 849 (19.9) < 0.001
Disease history
Hypertension 14,392 (49.8) 10,918 (46.6) 3474 (70.0) < 0.001
Hyperlipidemia 15,929 (62.2) 12,972 (62.0) 2957 (63.3) 0.17
Diabetes 5636 (16.3) 4155 (14.5) 1481 (27.7) < 0.001
CVD 4184 (13.1) 2499 (9.8) 1685 (34.2) < 0.001
Cancer 3249 (13.1) 2209 (11.5) 1040 (23.0) < 0.001
Neutrophils (× 109/L) 3.97 (3.10–5.04) 3.93 (3.06–4.97) 4.26 (3.34–5.41) < 0.001
Lymphocytes (× 109/L) 1.89 (1.51–2.37) 1.91 (1.54–2.38) 1.74 (1.33–2.27) 0.19
Platelets (× 109/L) 246 (208–291) 247 (209–292) 241 (199–289) 0.01
SII (× 109/L)c 505.14 (366.96–705.63) 497.68 (363.66–690.55) 562.92 (392.70–824.09) < 0.001
Table 1. Baseline characteristics of study populations. Values were presented as n (%) for categorical variables
and median (interquartile range) for continuous variables. DFTJ Dongfeng-Tongji cohort, NHANES National
Health and Nutrition Examination Survey, BMI body mass index, CVD cardiovascular diseases, SII systemic
immune-inflammation index. a P values were calculated by the Chi-square test or Mann–Whitney U test.
b
P values were calculated by Rao-Scott χ2 test for categorical variables, which is design adjusted version of
Pearson χ2 test, and by variance estimation adjusting for sampling weights for continuous variables. c For each
subject, SII value = neutrophil count/lymphocyte count × platelet count.
Scientific Reports | (2021) 11:12532 | https://doi.org/10.1038/s41598-021-91324-x 3
Vol.:(0123456789)www.nature.com/scientificreports/
Figure 1. Estimated HRs (95%CIs) for the associations of SII level with risk of total and cause-specific
mortality. (a) DFTJ cohort; (b) NHANES 1999–2014. DFTJ Dongfeng-tongji, NHANES National Health and
Nutrition Examination Survey, SII systemic immune-inflammation index, CVD cardiovascular diseases. Notes:
The HRs and 95% CIs were calculated by restricted cubic spline regression models, adjusted for age, sex, race
(only in the NHANES 1999–2014), body mass index, smoking status, alcohol drinking status, physical activity
status, education and baseline disease histories, with the minimum value of the transformed SII as reference
(DFTJ cohort: 6.4; NHANES 1999–2014: 7.0). Knots were placed at the 5th, 50th and 95th percentiles of the SII.
Total mortality CVD mortality Cancer mortality Other causes mortality
No of deaths/
SII category PYs HR (95%CI)a No of deaths HR (95%CI)a No of deaths HR (95%CI)a No of deaths HR (95%CI)a
DFTJ cohort
Low SII
1580/127,963 Ref 578 Ref 577 Ref 425 Ref
(< 332)
Middle SII 1.12 1.36 0.87 1.14
799/61,150 353 231 215
(332–465) (1.03–1.22) (1.19–1.55) (0.75–1.02) (0.97–1.34)
High SII 1.26 1.50 1.00 1.28
932/59,909 408 273 251
(> 465) (1.16–1.36) (1.32–1.71) (0.87–1.16) (1.09–1.49)
NHANES 1999–2014
Low SII
2058/98,504 Ref 456 Ref 476 Ref 1126 Ref
(< 498)
Middle SII 1.07 1.03 0.97 1.13
1098/47,705 266 218 614
(498–691) (0.98–1.17) (0.85–1.26) (0.79–1.20) (0.99–1.28)
High SII 1.38 1.33 1.22 1.47
1672/49,564 371 338 963
(> 691) (1.27–1.49) (1.11–1.59) (1.04–1.45) (1.32–1.63)
Table 2. The associations between the level of the systemic immune-inflammation index (SII) and mortality
in the cohort studies. DFTJ Dongfeng-Tongji cohort, NHANES National Health and Nutrition Examination
Survey, PY person-year. a HR (95%CI)s were calculated in the multivariable Cox proportional hazards
regression models, with adjustment for age, sex, race (only in the NHANES 1999–2014), body mass index,
smoking status, alcohol drinking status, education, physical activity status, and disease histories at baseline.
risk (Pint = 0.04, Supplementary Table S4). When assessing the cause-specific mortality, we found significant and
marginal significant interaction effects between physical activity and SII on CVD and other causes mortality
(Pint = 0.04 and 0.06, respectively), but not for cancer mortality (Pint = 0.47, Supplementary Table S5). However,
we did not observe the significant interaction between physical activity and baseline SII in the DFTJ cohort, and
non-significant interactions were found for age, sex, BMI, smoking and alcohol drinking status with SII in both
cohorts (all Pint > 0.05, Supplementary Table S4).
We further assessed the effect of physical activity on mortality risk across SII subgroups in both cohorts.
As shown in Table 3, in the DFTJ cohort, physical activity could significantly attenuate total mortality risk by
29–39% across SII subgroups, and corresponding HRs (95%CIs) in low, middle and high SII subgroups were 0.71
Scientific Reports | (2021) 11:12532 | https://doi.org/10.1038/s41598-021-91324-x 4
Vol:.(1234567890)www.nature.com/scientificreports/
Physical activity status Low SII Middle SII High SII
DFTJ cohort
Total mortality
Inactive Ref Ref Ref
Active 0.71 (0.63–0.80) 0.61 (0.52–0.72) 0.70 (0.60–0.81)
CVD mortality
Inactive Ref Ref Ref
Active 0.69 (0.57–0.84) 0.59 (0.46–0.75) 0.68 (0.54–0.85)
Cancer mortality
Inactive Ref Ref Ref
Active 0.88 (0.71–1.09) 0.63 (0.46–0.85) 0.83 (0.62–1.12)
Other causes mortality
Inactive Ref Ref Ref
Active 0.58 (0.46–0.72) 0.65 (0.47–0.90) 0.62 (0.47–0.83)
NHANES 1999–2014
Total mortality
Inactive Ref Ref Ref
Active 0.69 (0.60–0.80) 0.65 (0.52–0.80) 0.59 (0.51–0.68)
CVD mortality
Inactive Ref Ref Ref
Active 0.76 (0.55–1.03) 0.78 (0.50–1.20) 0.41 (0.27–0.64)
Cancer mortality
Inactive Ref Ref Ref
Active 0.64 (0.47–0.88) 0.71 (0.49–1.04) 0.86 (0.62–1.19)
Other causes mortality
Inactive Ref Ref Ref
Active 0.69 (0.58–0.83) 0.58 (0.45–0.75) 0.57 (0.46–0.70)
Table 3. The association between physical activity and mortality risk stratified by SII groups. HR (95%CI)s
were calculated in the multivariable Cox proportional hazards regression models, with adjustment for age, sex,
race (only in the NHANES 1999–2014), body mass index, smoking status, alcohol drinking status, education,
and disease histories. DFTJ Dongfeng-Tongji cohort, NHANES National Health and Nutrition Examination
Survey, SII systemic immune-inflammation index.
(0.63–0.80), 0.61 (0.52–0.72) and 0.70 (0.60–0.81), respectively. Similar effects of physical activity were observed
for CVD mortality and other causes mortality, with risk reduction by 31–41% and 35–42%, respectively. Physi-
cal activity decreased cancer mortality by 37% in the middle SII group, but such effect was not shown in low or
high SII subgroups. In the NHANES 1999–2014, physical activity was also found to be associated with lower risk
of total mortality across low, middle and high SII subgroups [HR (95%CI) = 0.69 (0.60–0.80), 0.65 (0.52–0.80)
and 0.59 (0.51–0.68), respectively]. Physical activity was only significantly associated with 59% reduced CVD
mortality in the high SII subgroup [HR (95%CI) = 0.41 (0.27–0.64)], and 36% lower cancer mortality in the low
SII subgroup [HR (95%CI) = 0.64 (0.47–0.88)].
Discussion
To our knowledge, this is the first study using two large prospective cohorts from China and U.S. to explore the
association between SII level and total and cause-specific mortality among the general middle-aged and older
populations. The results demonstrated that the high SII was associated with a separate 26% and 50% increased
risk of total and CVD mortality in the DFTJ cohort, as well as a separate 38% and 33% increased risk of total and
CVD mortality in the NHANES 1999–2014. Moreover, physical activity could reduce a separate 30% and 32%
risk of total and CVD mortality in the high SII subgroup of the DFTJ cohort, and decrease a separate 41% and
59% risk of total and CVD mortality in the high SII subgroup of the NHANES 1999–2014.
Multiple inflammatory biomarkers have been studied on their associations with risk of CVD, cancer and
mortality individually10,24,25. Morrison L. suggested that combining inflammatory markers into a risk score
was a robust method for testing the associations of systemic chronic inflammation with cancer risk and cancer
mortality26. The SII is an addition to these combined inflammatory makers, which integrates different but com-
plementary pathways simultaneously. The low cost and common availability of blood routine test in primary
care make the SII an attractive index for further investigation.
Many studies have indicated that a high level of SII was associated with early recurrence and poor survival
among certain cancer patients, and these effects were independent of conventional risk factors and other inflam-
matory scores or markers17,27–29. Besides the investigations in the clinical patients, two studies suggested that
individuals with high SII had elevated risks of solid cancer and dementia in the general population20,21. In the
Scientific Reports | (2021) 11:12532 | https://doi.org/10.1038/s41598-021-91324-x 5
Vol.:(0123456789)www.nature.com/scientificreports/
present study, we observed significant associations between high SII and increased total and CVD mortality in
middle-aged and older populations. The effect of high SII on elevated total mortality was consistent with the
findings reported by a previous study of 85,154 Chinese participants22. It was shown that high SII was associated
with increased cancer mortality for subjects in NHANES 1999–2014, but this association was not observed in the
DFTJ cohort, possibly due to the different combinations of cancer subtypes between the two cohorts. However,
we could not further evaluate the associations of SII level with the mortality of specific type of cancer because
of the limited information of cancer subtypes of deaths.
High level of SII was reported to be associated with elevated cytokines, e.g., interleukin-6 (IL-6), IL-8,
IL-1030,31, which were implicated in the systemic chronic inflammation response. The increased mortality in
participants with higher SII level was thought to be driven by chronic inflammation, which could generate
reactive nitrogen species, reactive oxygen species, genomic instability and cell senescence, increasing the risk of
CVD and mortality1. Moreover, SII was reported to be associated with circulating tumor cells in hepatocellular
carcinoma patients17. The interactions between the circulating neutrophils and platelets help cancer cells evade
immune surveillance and eradication. It was suggested that the high SII level may reflect the suppression of
immune function, which supports proliferation, invasion and metastasis of cancer cells.
Previous epidemiological studies have reported the benefic effects of physical activity on mortality r isk32,33. In
the current study, physical activity attenuated total and CVD mortality significantly, especially in subjects with
high level of SII. Similar with our results, a cohort study including 336,560 South Korean participants found that
physical activity could attenuate the association between high-sensitivity C-reactive protein and CVD mortal-
ity, and could also reduce the risks of total and cause-specific mortality among those with high high-sensitivity
C-reactive protein34. These findings emphasize the importance of physical activity on the prevention of total and
CVD mortality related to chronic inflammation. Although the protective effect of physical activity against cancer
mortality did not consistently reach the significant level in each subgroup of SII, several epidemiological studies
reported inverse associations of physical activity with cancer m ortality32,33. An umbrella review summarizing 19
systematic reviews on the associations of physical activity with cancer incidence and cancer mortality suggested
strong associations with breast and colon cancers, but evidence for other cancer sites was less consistent and
uncertain35. These findings emphasized the need of further explorations on specific types of cancers.
The present study involved two large sample sized cohort studies from China and U.S., which could ensure the
statistical power and causal inference for the current findings. The generally consistent results among populations
from two countries make the findings robust and reliable. However, some limitations should be noted. First,
the one-spot blood routine measurement and SII at baseline might not represent a long-time status of chronic
inflammation across the follow-up period and lead to underestimation of the association between SII and mor-
tality. However, a previous study with two measurements over 6.1 years showed that the within-person change
of the SII was s mall36. Second, most of the participants in the DFTJ cohort were elder retirees, which limited
representativeness for the younger Chinese population. However, the general characteristics and SII level among
the DFTJ cohort participants were comparable with that reported in the general middle-aged and older Chinese
population37,38. Thirdly, our results might be affected by reverse causation or residual confounding. However, the
associations remained even after excluding subjects who died during the first year of follow-up or subjects with
prevalent CVD and cancer, which minimize the possibility of reverse causation. Fourthly, lifestyle factors were
defined differently in two studies. However, when stratified by these factors, the associations of SII with mortal-
ity in each stratum were similar in both studies, which suggested the findings were not explainable by chance.
Finally, the observational study could not provide mechanistic information, therefore the biology underlying the
results is unknown. Further in vivo and in vitro studies are also warranted to clarify the possible mechanisms.
Conclusions
Our studies found that high level of SII was associated with a separate 26–38% and 33–50% increased risk of
total and CVD mortality in the DFTJ cohort and NHANES 1999–2014. For subjects with a high level of SII,
physical activity could attenuate a separate 30% and 32% risks of total and CVD mortality in the DFTJ cohort,
and a separate 41% and 59% risk of total and CVD mortality in the NHANES 1999–2014. In a public health
view, regular physical exercise was suggested as a promising strategy to prevent the chronic inflammation caused
elevated risk of mortality in the general middle-age and older populations.
Methods
Study populations. The study designs of the DFTJ cohort and NHANES have been described p reviously39,40.
Briefly, the DFTJ cohort began in 2008, launched among retirees from Dongfeng Motor Corporation in China,
and was followed up every five years. A total of 27,009 participants were recruited at baseline and additional
14,120 retirees were recruited during the first follow-up visit in 2013. The NHANES was conducted periodically
from 1999 and selected about 5000 persons annually in counties across the United States (U.S.) using complex,
multistage probability sampling design to represent the general U.S. population of all ages. These data were pub-
licly released in 2-year cycles. In the current study, we combined 8 consecutive survey cycles during 1999–2014
with a total of 82,091 participants (response rate ranged 71.0–83.9% in 8 cycles).
In the DFTJ cohort, we excluded individuals without value of SII (n = 10,608 without information of neu-
trophil, lymphocyte, or platelet counts). Therefore, the left 30,521 participants were included in this study. In
the NHANES 1999–2014, after excluding individuals who did not take health examination (n = 1487), without
mortality data (n = 38), and without information of related blood cells count (n = 1318), a total of 25,761 partici-
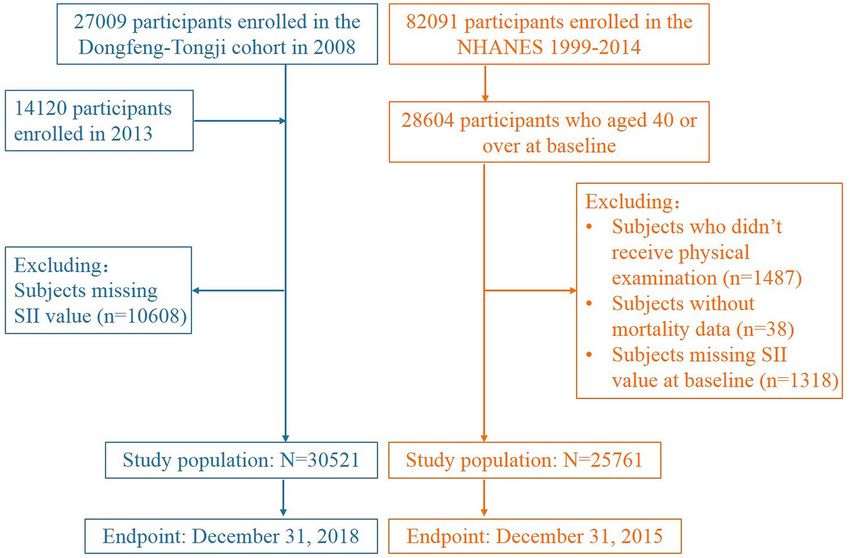
pants aged ≥ 40 years old were included because most deaths occurred in these adults (Fig. 2).
Scientific Reports | (2021) 11:12532 | https://doi.org/10.1038/s41598-021-91324-x 6
Vol:.(1234567890)www.nature.com/scientificreports/
Figure 2. Flow chart of study participants.
Assessment of covariates. Information on demographic characteristics (e.g., age, sex, race, and educa-
tion level), lifestyles (e.g., smoking status, alcohol drinking status, and physical activity status), medical history,
and self-reported diseases was assessed with a self-administered questionnaire and an interview during the base-
line data collection. The body weight and height were measured in the physical examination. In both studies,
BMI was calculated as weight divided by the square of height (kg/m2). In the questionnaires of DFTJ cohort,
current smokers were defined as participants who have smoked ≥ 1 cigarette/day in the past half a year, former
smokers as participants who had ever smoked but stopped for at least half a year, and never smokers as partici-
pants who have smoked < 1 cigarette/day in lifetime. Current alcohol drinkers were defined as participants who
have ≥ 1 drink/week in the past half a year, former drinkers as participants who had ever drunk but stopped for
at least half a year, and never drinkers as participants who have < 1 drink/week in lifetime. Current and former
smokers or drinkers were combined as smokers or drinkers. Participants were asked whether they did physical
activity for more than 20 min each time in leisure time during the past half a year, and those with an affirmative
answer were then asked total frequency per week and duration each time. Total weekly physical activity duration
was calculated by frequency per week multiplying the average minutes each time.
In the NHANES 1999–2014, smokers were defined as participants who had smoked ≥ 100 cigarettes during
lifetime, otherwise, they were non-smokers. Alcohol drinkers were defined as participants who had ≥ 12 drinks
in any 1 year, otherwise, they were non-drinkers. Participants were asked whether did any vigorous-intensity
recreational activities, as well as whether they did any moderate-intensity recreational activities for at least
10 min continuously. Those with an affirmative response to either question were also asked the frequency and
duration each day of the specific moderate or vigorous-intensity activities. Weekly duration of moderate or
vigorous-intensity activities was calculated as frequency per week multiplying minutes each day. To make the
same classification criteria of physical activity status in both cohorts, total physical activity duration per week
was calculated as the sum of weekly minutes of vigorous-intensity activities and weekly minutes of moderate-
intensity activities. In both cohorts, participants with total physical activity ≥ 150 min/week were classified as
physically active, otherwise, they were physically i nactive41.
Measurement of the peripheral counts of blood cells. The peripheral counts of blood cells were
measured by certified technologists using CELL-DYN 3700 system (Abbott Laboratories, Illinois, USA) in the
DFTJ cohort and Beckman Coulter Counter (Beckman Coulter Inc., Brea, CA, USA) in the NHANES 1999–
2014. The SII level was calculated for each participant as follows: SII (× 109/L) = neutrophil count (× 109/L)/
lymphocyte count (× 109/L) × platelet count (× 109/L)17.
Mortality follow‑up. In the DFTJ cohort, each subject had a unique medical insurance number to track
the vital status through Dongfeng Motor Corporation’s medical insurance system, which covers all retirees.
The causes of death for the dead were confirmed by medical records from hospitals and death certificates from
Centers for Disease Control and Prevention. This information was verified mutually. For the participants in
the NHANES 1999–2014, the public-use linked mortality files were released by the National Center for Health
Statistics, including vital status, cause of death, follow-up time from interview date and follow-up time from
physical examination date. Mortality variables were obtained by matching to public-use linked mortality files
Scientific Reports | (2021) 11:12532 | https://doi.org/10.1038/s41598-021-91324-x 7
Vol.:(0123456789)www.nature.com/scientificreports/
using exclusive respondent sequence n umber42. Mortality data was available till December 31, 2018 in the DFTJ
cohort and December 31, 2015 in the NHANES 1999–2014. We used the 10th revision of the international
classification of diseases (ICD-10) to classify the causes of death. Total and cause-specific mortality, including
CVD mortality (codes I00-I09, I11-I13, I20-I51, I60-I69), cancer mortality (codes C00-C97), and other causes
mortality were assessed.
Statistical analysis. Data were reported as median (IQR) for continuous variables, with differences tested
by Mann–Whitney U test, or number (percentage) for categorical variables, with different distributions tested
by χ2 test. SII value was log2-transformed to conform to normal distribution. Multivariable linear regression
was conducted to disclose the associations of SII level with basic characteristics, including age, sex, race (only in
the NHANES 1999–2014), BMI, smoking status, alcohol drinking status, and physical activity status. We fitted
restricted cubic spline models to show the dose–response association shapes of SII with mortality, with 3 knots
at the 5th, 50th and 95th percentiles of the SII. Subjects with extreme SII value outside their 1st and 99th percen-
tiles were excluded due to limited number of participants and events. The hazard ratios (HRs) for the associa-
tions of SII with total and cause-specific mortality were relatively stable before the 50th percentile of SII and were
steeper at a higher SII level, therefore, we classified participants into three subgroups: low SII: < 50th percentile;
middle SII: 50th–75th percentile; and high SII: > 75th percentile of SII among survivors in each cohort. HRs and
95% CIs were calculated to examine the associations of SII subgroups with mortality by using Cox proportional
hazards regression models, with adjustment for baseline age (continuous), sex, race (only in the NHANES 1999–
2014), BMI (< 18.5, 18.5–24.9, 25.0–29.9, ≥ 30 kg/m2), education level (below high school, high school, college
or above), smoking status (smokers, non-smokers), alcohol drinking status (drinkers, non-drinkers), physical
activity status (physically active, physically inactive), and baseline disease histories of hypertension, hyperlipi-
demia, diabetes, CVD and cancer. Person-years were recorded from baseline interview to date of death, loss to
follow-up, or end of follow-up, whichever came first. The proportional hazard assumption was tested by adding
cross term between person-years and exposure factors, showing no violations. Several sensitivity analyses were
further conducted by excluding: (1) subjects taking anti-coagulation drugs, thrombolytic drugs, antibiotics and
aspirin, which may influence SII level at baseline; (2) subjects who died during the first year of follow-up; (3)
participants with prevalent CVD or cancer.
The stratified analyses were conducted by sex, age, BMI, smoking status, alcohol drinking status, and physical
activity status. Effect modification was evaluated by likelihood ratio tests to compare the models with or without
the interaction term between each of these covariates and SII. We further explored the beneficial effect of physical
activity on mortality risk in each SII subgroup.
Sample weights, clustering, and stratification were taken into account for the complex sampling design in all
analyses among the NHANES 1999–2014. All statistical analyses were performed by using SAS 9.4 (SAS Institute
Inc. Cary, NC, USA), and two-tailed P < 0.05 were considered statistically significant.
Ethical approval. Written informed consents were obtained from all participants. The DFTJ cohort was
approved by the Ethics and Human Subject Committee of the School of Public Health, Tongji Medical College,
Huazhong University of Science and Technology; the NHANES was approved by the National Center for Health
Statistics Research Ethics Review Board. The methods were conducted in accordance with the approved guide-
lines and regulations.
Data availability
The dataset of DFTJ cohort is available from the corresponding author upon reasonable request and the dataset
of the NHANES is available at https://www.cdc.gov/nchs/nhanes/.
Received: 17 December 2020; Accepted: 20 May 2021
References
1. Furman, D. et al. Chronic inflammation in the etiology of disease across the life span. Nat. Med. 25, 1822–1832. https://doi.org/
10.1038/s41591-019-0675-0 (2019).
2. Roth, G. A. et al. Global, regional, and national age-sex-specific mortality for 282 causes of death in 195 countries and territories,
1980–2017: a systematic analysis for the Global Burden of Disease Study 2017. Lancet 392, 1736–1788. https://doi.org/10.1016/
S0140-6736(18)32203-7 (2018).
3. Bonaccio, M. et al. A score of low-grade inflammation and risk of mortality: prospective findings from the Moli-sani study. Hae-
matologica 101, 1434. https://doi.org/10.3324/haematol.2016.144055 (2016).
4. Allin, K. H., Bojesen, S. E. & Nordestgaard, B. G. Inflammatory biomarkers and risk of cancer in 84,000 individuals from the
general population. Int. J. Cancer 139, 1493–1500. https://doi.org/10.1002/ijc.30194 (2016).
5. Van Hemelrijck, M. et al. Association between levels of C-reactive protein and leukocytes and cancer: three repeated measurements
in the Swedish AMORIS study. Cancer Epidemiol. Biomark. Prev. 20, 428–437. https://doi.org/10.1158/1055-9965.Epi-10-1190
(2011).
6. Lassale, C. et al. Elements of the complete blood count associated with cardiovascular disease incidence: findings from the EPIC-
NL cohort study. Sci. Rep. 8, 3290. https://doi.org/10.1038/s41598-018-21661-x (2018).
7. Kabat, G. C. et al. White blood cell count and total and cause-specific mortality in the Women’s Health Initiative. Am. J. Epidemiol.
186, 63–72. https://doi.org/10.1093/aje/kww226 (2017).
8. Ruggiero, C. et al. White blood cell count and mortality in the Baltimore longitudinal study of aging. J. Am. Coll. Cardiol. 49,
1841–1850. https://doi.org/10.1016/j.jacc.2007.01.076 (2007).
9. Welsh, C. et al. Association of total and differential leukocyte counts with cardiovascular disease and mortality in the UK Biobank.
Arterioscler. Thromb. Vasc. Biol. 38, 1415–1423. https://doi.org/10.1161/ATVBAHA.118.310945 (2018).
Scientific Reports | (2021) 11:12532 | https://doi.org/10.1038/s41598-021-91324-x 8
Vol:.(1234567890)www.nature.com/scientificreports/
10. Shah, A. D., Denaxas, S., Nicholas, O., Hingorani, A. D. & Hemingway, H. Neutrophil counts and initial presentation of 12 cardio-
vascular diseases: a CALIBER cohort study. J. Am. Coll. Cardiol. 69, 1160–1169. https://doi.org/10.1016/j.jacc.2016.12.022 (2017).
11. Tsai, M. T., Chen, Y. T., Lin, C. H., Huang, T. P. & Tarng, D. C. U-shaped mortality curve associated with platelet count among
older people: a community-based cohort study. Blood 126, 1633–1635. https://doi.org/10.1182/blood-2015-06-654764 (2015).
12. Diem, S. et al. Neutrophil-to-lymphocyte ratio (NLR) and platelet-to-lymphocyte ratio (PLR) as prognostic markers in patients
with non-small cell lung cancer (NSCLC) treated with nivolumab. Lung Cancer 111, 176–181. https://doi.org/10.1016/j.lungcan.
2017.07.024 (2017).
13. Templeton, A. J. et al. Prognostic role of neutrophil-to-lymphocyte ratio in solid tumors: a systematic review and meta-analysis.
J. Natl. Cancer Inst. 106, dju124. https://doi.org/10.1093/jnci/dju124 (2014).
14. Arbel, Y. et al. Neutrophil/lymphocyte ratio is related to the severity of coronary artery disease and clinical outcome in patients
undergoing angiography. Atherosclerosis 225, 456–460. https://doi.org/10.1016/j.atherosclerosis.2012.09.009 (2012).
15. Kim, S., Eliot, M., Koestler, D. C., Wu, W. C. & Kelsey, K. T. Association of neutrophil-to-lymphocyte ratio with mortality and
cardiovascular disease in the Jackson heart study and modification by the Duffy antigen variant. JAMA Cardiol. 3, 455–462. https://
doi.org/10.1001/jamacardio.2018.1042 (2018).
16. Kang, J. et al. Neutrophil-to-lymphocyte ratio and risk of lung cancer mortality in a low-risk population: a cohort study. Int J
Cancer 145, 3267–3275. https://doi.org/10.1002/ijc.32640 (2019).
17. Hu, B. et al. Systemic immune-inflammation index predicts prognosis of patients after curative resection for hepatocellular car-
cinoma. Clin. Cancer Res. 20, 6212–6222. https://doi.org/10.1158/1078-0432.Ccr-14-0442 (2014).
18. Xie, Q. K. et al. The systemic immune-inflammation index is an independent predictor of survival for metastatic colorectal cancer
and its association with the lymphocytic response to the tumor. J. Transl. Med. 16, 273. https://d oi.o
rg/1 0.1 186/s 12967-0 18-1 638-9
(2018).
19. Aziz, M. H. et al. The systemic-immune-inflammation index independently predicts survival and recurrence in resectable pancre-
atic cancer and its prognostic value depends on bilirubin levels: a retrospective multicenter cohort study. Ann. Surg. 270, 139–146.
https://doi.org/10.1097/sla.0000000000002660 (2019).
20. Fest, J. et al. The systemic immune-inflammation index is associated with an increased risk of incident cancer: a population-based
cohort study. Int. J. Cancer 146, 692–698. https://doi.org/10.1002/ijc.32303 (2020).
21. van der Willik, K. D. et al. Balance between innate versus adaptive immune system and the risk of dementia: a population-based
cohort study. J. Neuroinflamm. 16, 68. https://doi.org/10.1186/s12974-019-1454-z (2019).
22. Jin, Z. et al. The associations of two novel inflammation indexes, SII and SIRI with the risks for cardiovascular diseases and all-
cause mortality: a ten-year follow-up study in 85,154 individuals. J. Inflamm. Res. 14, 131–140. https://doi.org/10.2147/jir.S2838
35 (2021).
23. Li, Y. et al. Healthy lifestyle and life expectancy free of cancer, cardiovascular disease, and type 2 diabetes: prospective cohort study.
BMJ 368, l6669. https://doi.org/10.1136/bmj.l6669 (2020).
24. Shiels, M. S. et al. Circulating inflammation markers, risk of lung cancer, and utility for risk stratification. J. Natl. Cancer Inst. 107,
djv199. https://doi.org/10.1093/jnci/djv199 (2015).
25. Singh-Manoux, A. et al. Association between inflammatory biomarkers and all-cause, cardiovascular and cancer-related mortality.
Can. Med. Assoc. J. 189, E384. https://doi.org/10.1503/cmaj.160313 (2017).
26. Morrison, L. et al. Inflammatory biomarker score and cancer: a population-based prospective cohort study. BMC Cancer 16, 80.
https://doi.org/10.1186/s12885-016-2115-6 (2016).
27. Geng, Y. et al. Systemic immune-inflammation index predicts prognosis of patients with esophageal squamous cell carcinoma: a
propensity score-matched analysis. Sci. Rep. 6, 39482. https://doi.org/10.1038/srep39482 (2016).
28. Hong, X., Cui, B. & Wang, M. Systemic immune-inflammation index, based on platelet counts and neutrophil-lymphocyte ratio,
is useful for predicting prognosis in small cell lung cancer. Tohoku J. Exp. Med. 236, 297–304. https://doi.org/10.1620/tjem.236.
297 (2015).
29. Huang, H. et al. Prognostic value of preoperative systemic immune-inflammation index in patients with cervical cancer. Sci. Rep.
9, 3284. https://doi.org/10.1038/s41598-019-39150-0 (2019).
30. Chan, S. L. et al. Development of a novel inflammation-based index for hepatocellular carcinoma. Liver Cancer 9, 167–181. https://
doi.org/10.1159/000504252 (2020).
31. Motomura, T. et al. Neutrophil-lymphocyte ratio reflects hepatocellular carcinoma recurrence after liver transplantation via inflam-
matory microenvironment. J. Hepatol. 58, 58–64. https://doi.org/10.1016/j.jhep.2012.08.017 (2013).
32. Zhao, G. et al. Leisure-time aerobic physical activity, muscle-strengthening activity and mortality risks among US adults: the
NHANES linked mortality study. Br. J. Sports Med. 48, 244–249. https://doi.org/10.1136/bjsports-2013-092731 (2014).
33. Zhao, M., Veeranki, S. P., Li, S., Steffen, L. M. & Xi, B. Beneficial associations of low and large doses of leisure time physical activ-
ity with all-cause, cardiovascular disease and cancer mortality: a national cohort study of 88,140 US adults. Br. J. Sports Med. 53,
1405–1411. https://doi.org/10.1136/bjsports-2018-099254 (2019).
34. Lee, J. Y., Ryu, S., Cheong, E. & Sung, K. C. Association of physical activity and inflammation with all-cause, cardiovascular-related
and cancer-related mortality. Mayo Clin. Proc. 91, 1706–1716. https://doi.org/10.1016/j.mayocp.2016.08.003 (2016).
35. Rezende, L. F. M. et al. Physical activity and cancer: an umbrella review of the literature including 22 major anatomical sites and
770 000 cancer cases. Br. J. Sports Med. 52, 826–833. https://doi.org/10.1136/bjsports-2017-098391 (2018).
36. Fest, J. et al. Reference values for white blood-cell-based inflammatory markers in the Rotterdam study: a population-based
prospective cohort study. Sci. Rep. 8, 10566. https://doi.org/10.1038/s41598-018-28646-w (2018).
37. Xiao, D. et al. Prevalence and risk factors of small airway dysfunction, and association with smoking, in China: findings from a
national cross-sectional study. Lancet Respir. Med. 8, 1081–1093. https://doi.org/10.1016/s2213-2600(20)30155-7 (2020).
38. Meng, X. et al. Determinant roles of gender and age on SII, PLR, NLR, LMR and MLR and their reference intervals defining in
Henan, China: a posteriori and big-data-based. J. Clin. Lab. Anal. 32, e22228. https://doi.org/10.1002/jcla.22228 (2018).
39. Wang, F. et al. Cohort profile: the Dongfeng-Tongji cohort study of retired workers. Int. J. Epidemiol. 42, 731–740. https://doi.org/
10.1093/ije/dys053 (2013).
40. Centers for Disease Control and Prevention (CDC). National Health and Nutrition Examination Surveys. 4 Sept 2020. https://w ww.
cdc.gov/nchs/nhanes/index.htm.
41. World Health Organization (WHO). Global Recommendation on Physical Activity for Health. https://www.who.int/dietphysicalact
ivity/factsheet_recommendations/en/.
42. National Center for Health Statistics. Public-Use 2015 Linked Mortality Files. 30 Jan 2020. https://www.cdc.gov/nchs/data-linkage/
mortality-public.htm.
Acknowledgements
We would like to appreciate all participants in the DFTJ cohort as well as all volunteers for collecting the sam-
ples and questionnaires. We also thank the U.S. National Center for Health Statistics of the Centers for Disease
Control and Prevention for sharing NHANES data.
Scientific Reports | (2021) 11:12532 | https://doi.org/10.1038/s41598-021-91324-x 9
Vol.:(0123456789)www.nature.com/scientificreports/
Authors Contributors
H.L., H.G. designed research, performed data analyses, and wrote the paper, and Y.B., G.L., W.W., H.M., Y.F.,
M.L., X.G., M.F., C.W., and J.J. collected samples of the DFTJ cohort. H.G., X.Z., and M.H. provided essential
materials of the DFTJ cohort. X.W., M.F., C.W., and J.J. assisted the data extraction of the NHANES. All authors
provided critical revisions of the draft and approved the submitted draft. The corresponding authors attests that
all listed authors meet authorship criteria and that no others meeting the criteria have been omitted.
Funding
This study was supported by the funds from the National Natural Science Foundation of China (Grant Nos.
82073650 and 81773398) and the National Youth Top Talent Support Program to H.G. The funding source
had no role in study design and conduct; data collection, analysis, and interpretation; preparation, writing this
manuscript; or submit the manuscript for publication.
Competing interests
The authors declare no competing interests.
Additional information
Supplementary Information The online version contains supplementary material available at https://doi.org/
10.1038/s41598-021-91324-x.
Correspondence and requests for materials should be addressed to H.G.
Reprints and permissions information is available at www.nature.com/reprints.
Publisher’s note Springer Nature remains neutral with regard to jurisdictional claims in published maps and
institutional affiliations.
Open Access This article is licensed under a Creative Commons Attribution 4.0 International
License, which permits use, sharing, adaptation, distribution and reproduction in any medium or
format, as long as you give appropriate credit to the original author(s) and the source, provide a link to the
Creative Commons licence, and indicate if changes were made. The images or other third party material in this
article are included in the article’s Creative Commons licence, unless indicated otherwise in a credit line to the
material. If material is not included in the article’s Creative Commons licence and your intended use is not
permitted by statutory regulation or exceeds the permitted use, you will need to obtain permission directly from
the copyright holder. To view a copy of this licence, visit http://creativecommons.org/licenses/by/4.0/.
© The Author(s) 2021
Scientific Reports | (2021) 11:12532 | https://doi.org/10.1038/s41598-021-91324-x 10
Vol:.(1234567890)You can also read