Cutoff criteria for the placebo response: a cluster and machine learning analysis of placebo analgesia
←
→
Page content transcription
If your browser does not render page correctly, please read the page content below
www.nature.com/scientificreports
OPEN Cutoff criteria for the placebo
response: a cluster and machine
learning analysis of placebo
analgesia
Per M. Aslaksen
Computations of placebo effects are essential in randomized controlled trials (RCTs) for separating
the specific effects of treatments from unspecific effects associated with the therapeutic intervention.
Thus, the identification of placebo responders is important for testing the efficacy of treatments and
drugs. The present study uses data from an experimental study on placebo analgesia to suggest a
statistical procedure to separate placebo responders from nonresponders and suggests cutoff values
for when responses to placebo treatment are large enough to be separated from reported symptom
changes in a no-treatment condition. Unsupervised cluster analysis was used to classify responders
and nonresponders, and logistic regression implemented in machine learning was used to obtain
cutoff values for placebo analgesic responses. The results showed that placebo responders can be
statistically separated from nonresponders by cluster analysis and machine learning classification, and
this procedure is potentially useful in other fields for the identification of responders to a treatment.
The use of placebos is crucial in medical science to determine the effects and efficacy of treatments1,2. Because
randomized controlled trials (RCTs) use placebo conditions as a control, the definition of placebo responders is
important to make valid statements about the statistical effects of treatments3. However, there is no consensus
on how to statistically define a placebo responder or how to determine the cutoff for when a placebo response is
large enough to be considered a true change from baseline. The majority of studies investigating the mechanistic
components of the placebo response have used the placebo response in the context of pain, i.e., placebo analgesia,
as the modality for studying this e ffect4.
Experimental studies on the mechanisms of the placebo response have traditionally relied on defining a pla-
cebo effect as the statistically significant difference in mean values between a group that receive placebo treatment
and a group that receive no treatment but undergo the same assessments and procedures as the placebo g roup5.
However, statistically significant differences are largely dependent on sample sizes, and larger samples might
produce significant differences between groups that may have no practical or clinical r elevance6. In the field of
clinical pain, several authors have previously addressed this issue, and values for minimal clinically important
differences in pain change have been suggested in terms of absolute changes and percentage changes. In a study
on acute pain in trauma patients, Todd et al.7 found that an absolute pain reduction of 13 mm on a 100-mm
visual analog scale (VAS) was a valid cutoff value for a clinically significant change in acute pain. The finding by
Todd et al. was replicated in other s tudies8,9, but there was the notion that patients with higher pain at baseline
required a higher VAS reduction compared to those with lower initial VAS ratings to achieve a meaningful
reduction in p ain9. The relative percentage change in pain might in some situations be less biased by baseline
or pretreatment pain compared to the absolute VAS change, and Jensen et al.10 suggested that more than a 33%
relative and 20–30 mm absolute reduction in individual VAS scores constituted a clinically meaningful change
in postoperative pain. In a study employing meta-regression on data from 10,938 patients from 40 studies with
various diagnoses of chronic pain, a minimum clinically important difference of 28 mm on the 100-mm VAS
scale was found11. Thus, the cutoff values for a clinically relevant VAS change vary among acute, postoperative,
and chronic types of pain.
However, most mechanistic studies on placebo analgesia have been performed in healthy volunteers who
had no prior history of long-lasting pain. Thus, the most comparable clinical category is probably acute pain. By
using the cutoff value from Todd et al.7, a meta-analysis on placebo effects12 found that only 26% of the included
Department of Psychology, The Faculty of Health Sciences, UiT The Arctic University of Norway, 9037 Tromsø,
Norway. email: per.aslaksen@uit.no
Scientific Reports | (2021) 11:19205 | https://doi.org/10.1038/s41598-021-98874-0 1
Vol.:(0123456789)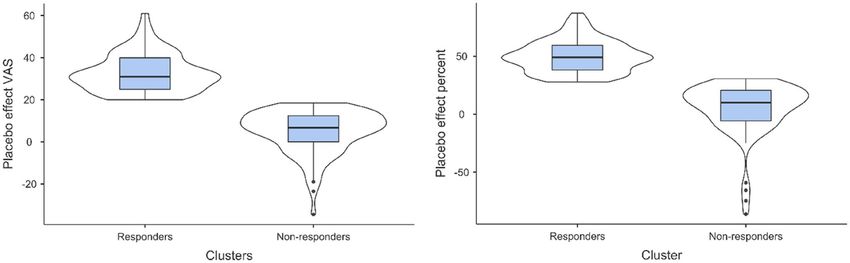
www.nature.com/scientificreports/
Figure 1. Box and violin plots showing the density of placebo responders versus nonresponders.
placebo studies performed in healthy volunteers reported clinically significant pain reduction after placebo
treatment. Minor pain reductions in placebo analgesic studies could be problematic for the interpretation and
generalizability of mechanistic studies on the placebo response. Furthermore, the reported response rate to
placebo treatment varies substantially between studies and between experimental and clinical settings13,14. In
an influential and debated study by B eecher15, the response rate to placebo in clinical pain was estimated to be
35.2%, whereas other more recent studies have shown values between 39–78%16,17 and a 56–72% response rate
for experimental placebo a nalgesia18,19 when a responder was defined as a participant who reported a change in
pain in the expected direction after placebo treatment. Hence, the majority of studies reporting the percentage of
placebo responders define a placebo responder as a patient or a participant in an experimental study that reports
any pain reduction measured on a VAS or numerical rating scale (NRS) after placebo treatment, regardless of
the magnitude of the pain r eduction12.
Here, data from a large experimental placebo analgesic study performed in healthy volunteers20 were used
to test the assumption that placebo responders can be separated from nonresponders by cutoff values for both
absolute and relative percentage changes in pain measured on a 100-mm VAS. Data from 296 participants (179
females) were included. Thermal pain stimulation was performed in two pretests and three posttests, and the
temperature for pain stimulation needed to evoke a rating of 60 on a 100-mm computerized visual analog scale
was individually determined for each participant in a calibration phase before the pretests. Placebo administra-
tion (placebo cream) together with information that the cream was a painkiller was performed after the pretests.
The design consisted of a double-blind procedure in the placebo group, whereas the control group received no
cream but experienced the same pain procedure as the placebo group.
Unsupervised cluster analysis was used to classify responders and nonresponders, and the classification was
tested with different cutoffs in a supervised machine learning algorithm based on logistic regression. If a placebo
analgesic manipulation produces either responders or nonresponders, an unsupervised cluster analysis should
result in two clusters. Since placebo analgesia is dependent on a reduction in pain reports measured on the same
scales as clinical pain, it was hypothesized that reductions in pain after placebo treatment should have the same
magnitude as pain reduction after clinical t reatment7,10,11 to refer to the response as “analgesia”. Consistent with
the predictions, the cluster analysis revealed two distinct clusters in the data separated by significant differences
in pain change after placebo treatment. Furthermore, the machine learning classification suggested cutoff values
for placebo analgesic responses close to the suggested cutoffs for acute clinical pain. The assumption that pain
reporting after placebo administration results in a two-cluster solution was supported by testing pain change
data from three previously published studies from our lab21–23. Consequently, it is suggested that the statistical
approach in the present study could be used as an alternative for defining placebo responders in both clinical
and experimental studies where patient self-report is the main outcome.
Results
Group differences. A comparison of pretest and posttest values in the placebo group showed a significant
mean decrease in pain intensity of 16.76 VAS points (95% CI [13.94–19.59]) after placebo manipulations con-
sisting of verbal information and application of a placebo cream (t (145) = 11.72, p < .001). The mean values of
the two pretests were 58.24 (95% CI [55.67–61.11]), and the mean pain intensity in the posttest was 41.48 VAS
points (95% CI [38.39–45.02]) on the 100-mm VAS scale. In contrast, in the control group that received no
manipulations during the pain stimulation procedure, the mean decrease in pain was significant (t (124) = 3.04,
p = .003), with a 3.26 VAS points reduction (95% CI [1.03–5.39]) from the pretest to the posttest. When compar-
ing the placebo group and the control group, a significantly larger pain reduction was observed in the placebo
group (t (294) = − 7.85, p < .001). Hence, the design produced a statistically significant placebo analgesic effect.
Cluster analysis. A two-step unsupervised cluster analysis was performed on the VAS change scores for
the mean of the two pretests and the last posttest (pretests–last posttest). Before performing the two-step cluster
analysis, the order of the participants in the data file was randomized in order to reduce order-effects. In the
placebo group, the analysis revealed two distinct clusters (Fig. 1) with means of 32.68 (95% CI [30.43–34.91])
Scientific Reports | (2021) 11:19205 | https://doi.org/10.1038/s41598-021-98874-0 2
Vol:.(1234567890)www.nature.com/scientificreports/
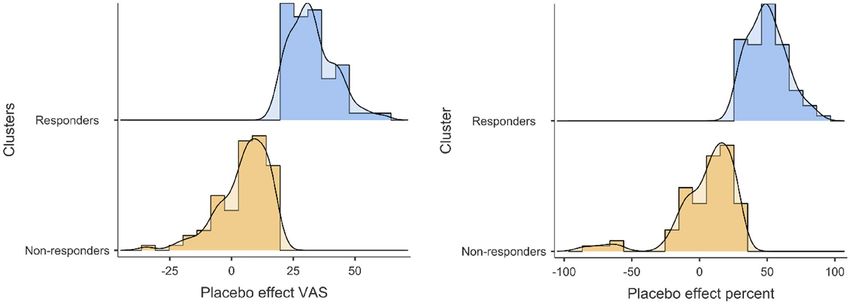
Figure 2. Histograms showing the distribution of responders and nonresponders classified by the two-step
cluster analysis.
and 5.16 (95% CI [2.98–7.33]), medians of 31 and 7.5, and modes of 29.5 and 3 for changes in VAS pain ratings.
The cluster quality was good, with an average silhouette measure of .7. The two clusters were termed placebo
responders (N = 65, 42%) and nonresponders (n = 90, 58%), respectively. The distribution of changes in pain
for the responders and nonresponders is shown in Fig. 2, and the mean difference in pain changes between the
responders and nonresponders was significant (t (153) = 17.19, p < .001). The effect size was very large24 based on
the mean difference between the responders and the nonresponders (32.68–5.16/SD 16.70 = 1.65; Cohen’s d). To
test the stability of the results from the two-step cluster analysis, the order of the sample was randomized again
and split into halves and then run in two separate samples. When splitting the sample, the results were identical
to the initial analysis with two clusters and a silhouette measure of .7. The cluster solution with two clusters was
additionally tested in a supervised k-means cluster analysis. The k-means analysis showed that a two-cluster
solution produced the same number of responders (N = 65), and nonresponders (N = 90), the two clusters had
final cluster centers of 32.68 and 4.88, and the ANOVA test for differences in cluster means was significant (F (1,
153) = 295.54, p < .001).
When performing the two-step cluster analytic procedure on data from the control group, four clusters
emerged with good quality of the clusters (.7) determined by the average silhouette measure (cluster 1, N = 23,
mean = 20.8; cluster 2, N = 42, mean = 8.83; cluster 3, N = 50, mean = − .09; cluster 4, N = 26, mean = − 13.13).
Validation of the two‑cluster solution for placebo responding. The unsupervised cluster analysis
for classification was additionally tested on data from the placebo arms and/or conditions in published studies
with smaller samples from our lab21–23. The two-step cluster analysis classified the pain change data in two-
cluster solutions in all three datasets, with silhouette measures .7, .7, and .6, respectively. Thus, the classification
produced cluster solutions of good quality, and the assumption that self-reported responses after placebo admin-
istration can be classified in responders and non-responders was supported. See Supplemental information for
details about the validation of the cluster solution.
Determination of cutoff values by machine learning. The two categories (placebo responders and
nonresponders) derived from the cluster analysis in the placebo group were used as dependent variables in a
machine learning algorithm based on logistic regression. Values for pain change ranging from 0 to 50 for per-
centage change and change values from 0 to 25 for absolute VAS change were tested as possible cutoff values.
The false discovery rate (FDR) was used to assess the predictive ability for each of the selected cutoff values, and
q ≤ 5% was chosen as the FDR criterion for a valid cutoff that could separate responders from nonresponders.
The optimal cutoff values (Table 1) for a VAS change were 18–20. These values produced identical area under the
curve (AUC) values (.99) and showed high accuracy (99.4%) for the prediction of the placebo responders identi-
fied by the cluster analysis. Furthermore, low (0–1%) FDR values for both false classification of responders and
nonresponders suggested a highly precise prediction. A VAS change value of 17 also reached the FDR criterion
but with somewhat lower AUC and accuracy values. In summary, absolute VAS changes in the range between
17 and 20 points could separate responders from nonresponders within the 5% FDR criterion. In comparison, a
cutoff based on any or a small change in pain (≥ 0) showed a predictive value close to chance level (AUC = .61),
whereas a cutoff based on a large VAS change score (≥ 25) correctly classified all the nonresponders but incor-
rectly classified 17% of the responders as nonresponders. Thus, using higher cutoff values may increase the false
negative rate. When using different cutoffs for percentage change values (0 to 50% change in VAS ratings), the
optimal cutoffs were 27–28% change (AUC = .99, accuracy = 99.3%) with FDR values of 0–1% (Table 1). Percent-
age changes between 25 and 30 all passed the 5% FDR criterion but with lower AUC (.96–.97) and accuracy
values (97.3–97.9%). Calculation of the Youden i ndex25 was additionally performed to compare cutoffs from the
logistic machine learning analysis with a widely used method for this p urpose26. Generally, the machine learning
procedure and the Youden method gave similar cutoff values (see Table 1).
Scientific Reports | (2021) 11:19205 | https://doi.org/10.1038/s41598-021-98874-0 3
Vol.:(0123456789)www.nature.com/scientificreports/
VAS absolute change AUC Accuracy % FDR responder % FDR non-responder % Youden index
0 .61 55.5 52 36 .27
5 .66 65.8 45 0 .40
10 .79 78.7 33 0 .62
15 .9 91 18 0 .83
16 .95 95.5 10 0 .91
17 .98 98.7 3 0 .97
18 .99 99.4 1 0 .98
19 .99 99.4 0 1 1.0
20 .99 99.4 0 1 1.0
21 .94 96.8 0 5 .94
22 .92 95.5 0 7 .91
23 .9 94.2 0 9 .88
24 .86 91.6 0 13 .82
25 .84 88.4 0 17 .74
VAS % change AUC Accuracy % FDR responder % FDR non-responder % Youden index
0 .64 69.2 36 0 .29
5 .69 74 32 0 .38
10 .77 80.1 27 0 .50
15 .83 86 20 0 .62
20 .91 92.5 12 0 .74
25 .96 97.3 5 0 .88
26 .97 97.9 4 0 .89
27 .99 99.3 1 0 .93
28 .99 99.3 0 1 .96
29 .97 97.9 0 4 .94
30 .97 97.9 0 4 .95
31 .96 97.3 0 6 .95
32 .94 95.9 0 8 .92
33 .93 93.8 0 12 .89
34 .9 91.8 0 15 .85
35 .89 91.1 0 16 .84
40 .84 84.9 0 25 .72
45 .81 81.5 0 29 .66
50 .72 72.6 0 37 .49
Table 1. Cutoff values from logistic regression machine learning. The VAS absolute change is the absolute
change in VAS pain intensity ratings from the pretests to the posttest. The VAS percent change is the
percentage change in VAS pain intensity ratings from the pretests to the posttest. Bold type indicates q ≤ 5%.
VAS visual analog scale, AUCarea under the curve, FDR false-discovery rate.
Discussion
The gold standard for the determination of a placebo effect in experimental designs is the observation of statisti-
cally significant differences between one or more groups receiving placebo treatment and a group receiving the
same procedure but with no treatment27. Hence, this definition is based on observed differences in measures
of central tendencies, most often mean differences, regardless of the magnitude of the change; when statistical
significance is used as the only criterion, this might not account for the physiological and psychological experi-
ence of the stimulation or whether analgesia is induced.
The results from the present study and studies on cutoffs for clinical pain7–11 suggest that small, albeit statisti-
cally significant, changes in pain after treatment may have no practical or clinical relevance. Furthermore, when
using any pain change in the desired direction as the definition of placebo responders, the present data showed
that the accuracy was close to chance. This is a problem for the interpretation of experimental studies on placebo
analgesia with no criterion for defining when changes in pain magnitude are sufficient to be considered meaning-
ful decreases in pain perception. However, studies with small but significant changes in pain may still provide
important information about mechanisms of placebo-induced changes in physiological systems related to pain
perception21,28 and how contextual and psychological factors associated with placebo administration may affect
treatment or experimental outcomes; s ee2,29,30 for an overview. Nonetheless, the term “analgesia” refers to the relief
of pain without the loss of consciousness, and studies making inferences about placebo analgesia should at least
display changes in pain ratings large enough to be recognized as reduced pain intensity that are perceived as such.
The results from the present study showed a significant difference in mean pain change between the placebo
group and the control group. Nonetheless, the cluster analysis revealed that one of the clusters in the control
Scientific Reports | (2021) 11:19205 | https://doi.org/10.1038/s41598-021-98874-0 4
Vol:.(1234567890)www.nature.com/scientificreports/
group data had a pain reduction that could be classified as placebo responses according to the cutoff values found
in the present study if it had been observed in the placebo group. Moreover, the second cluster in the control
group had a mean pain change of 8.83, which is comparable to placebo induced pain changes in several previous
studies5,12,31,32. These findings suggests that relatively large changes in experimental pain reports could occur in
the absence of a treatment and be caused by factors such as reporting biases, individual differences in emotional
responses to the pain stimulation, and statistical regression to the m ean33–35. Thus, the possibility exist that parts
of the improvement observed in the placebo group would also have occurred without the placebo treatment36.
The present study is probably the first to provide cutoff values for experimental placebo analgesia. The optimal
cutoff values of 18–20 mm for absolute VAS changes and 27–28% changes are not surprising given findings in
studies on clinical p ain7–11. However, the cutoff suggested by Todd et al.7 of a 13-mm change for acute pain was
too liberal in the present data, as shown by both the machine learning analysis and the Youden index.
Nonetheless, the cutoffs found in the present study were based on a specific procedure for placebo treatment
and pain stimulation, and different procedures might provide different values. A limitation of the present data
is that the pain measurement did not include a qualitative measure for rating the perceived p ain37 after placebo
treatment as “much less", "little less", "the same", etc. Hence, minimally clinically important difference (MCID)
values could not be computed. On the other hand, the present results are in line with suggested cutoff values
found in studies on clinical pain, and the pain stimulation used here is one of the most common methods in
experimental pain s tudies38. The use of cutoff values for pain changes to perform responder analyses has been
recommended for clinical pain trials with the reasoning that statistical mean differences might not capture the
experienced effect of pain reductions in most p atients39–41. Thus, the definition of placebo responders versus
nonresponders based on cutoffs could be a beneficial add-on for analyses for both clinical and experimental
studies. However, the terms “placebo responders and nonresponders” does not imply that participants who
shows a positive response to placebo administration in e.g., a pain study will be placebo responders in other
situations. Placebo responding and placebo nonresponding are probably not consistent t raits14,42, but depend on
the individual learning history of the p articipants43, level of emotional activation during t reatment44, and genetic
factors20,45 associated with the sensory modality in which the placebo treatment is used.
The magnitude and impact of placebo analgesic effects in clinical trials and experimental studies have been
debated, e.g.,12,31,46,47. Nonetheless, these meta-analyses have shown that placebo administration has a statistical
impact on self-reported pain. Furthermore, Zunhammer et al.48,49 found in meta-analyses that placebo admin-
istration has minor effects on the neurologic pain s ignature50 but moderate effects on pain reports, which sug-
gests that the measurement and analysis of pain reports are crucial for determining the magnitude of placebo
analgesic effects. Nevertheless, most meta-analyses have not analyzed whether the observed effects of placebos
had a clinically meaningful impact. To date, the only meta-analysis that tested clinical significance in relation to
placebo analgesia found that the placebo analgesic effect was higher in patients than in healthy controls in terms
of clinically significant reductions in pain when using the reduction criteria of ≥ 13 mm7 on a 0–100 VAS or NRS
scale12. Interestingly, meta-analyses that have used effect sizes as the main outcome measure have shown the
opposite finding: the placebo effect is larger in healthy controls than in patients31,32. Taken together, analyses of
placebo effects in future studies should preferably include assessments of both statistical and clinical significance,
at least in studies making inferences about patient-reported outcomes such as pain51.
The present study shows that placebo responders can be separated from nonresponders with a straightforward
procedure based on unsupervised cluster analysis and cutoffs selected by logistic regression implemented in
machine learning. These statistical tools are available in several statistical software packages and could easily be
used by scientists with some experience in statistics. Moreover, the machine learning application used here can
be replaced by an ROC curve analysis providing data for sensitivity and specificity52 that is implemented in most
statistical programs or software specialized for finding optimal cutoff points53. However, the latter does require
that the patients/participants be classified as either responders or nonresponders before the analysis to find the
optimal cutoff is performed. Thus, in cases where there is no diagnostic information or clinical classification, an
unsupervised cluster analysis may help the categorization process without inducing bias associated with manual
human classification. The two-cluster classification of the placebo responses of the present study was replicated in
other data from our lab. However, other types of experimental designs may provide more complex classification
of responses54. In data where more than two clusters are found, the logistic regression and eventually the Youden
index must be replaced with classification analyses that handle multiclass data such as support vector machines
or similar methods. An advantage of machine learning algorithms for classification over standard statistical
methods is that these applications provide additional statistics, such as FDR values, compared to other analysis
such as logistic regression. Furthermore, the flexibility in model specifications, such as validation schemes of the
selected model, provides better control over the accuracy and error rate compared to standard statistical methods.
Methods
Data from 296 healthy subjects who participated in an experimental study on genetic factors in placebo
analgesia20 were used for the present analyses. The characteristics of the sample are described in detail in previ-
ous publications20,55.
The participants were randomized into three groups: (1) a placebo group (N = 155) that received a mois-
turizing cream with no analgesic properties (E-45; Crookes Healthcare, Nottingham, United Kingdom), (2) a
natural history group (N = 141) that received no treatment during the procedure, or (3) a lidocaine-prilocaine
cream group (N = 31) that received a local anesthetic cream (Emla; AstraZeneca, Oslo, Norway)20. Thus, the
study included a total of 327 healthy participants with a mean age of 23 years (SD = 3.3). A dose of 3 g of Emla or
E-45 was used for each participant. The group receiving the anesthetic cream was used in the design to ensure
blinding of the experimenters, and these data were not used in the analyses20,55. The experiment was run in a
Scientific Reports | (2021) 11:19205 | https://doi.org/10.1038/s41598-021-98874-0 5
Vol.:(0123456789)www.nature.com/scientificreports/
double-blind manner for the groups where a cream was applied, but there was no blinding in the natural his-
tory group. Randomization was performed before the start of the experiment. The participants were allocated
to the different groups based on their participant number. The participant numbers and group allocations were
randomized by using the online web service https://www.random.org/lists/. Thirty-one of the participants were
randomized into the lidocaine-prilocaine cream group. Hence, data from 296 participants were included in
the final a nalyses20. The study was reviewed and approved by the Regional Committee for Medical and Health
Research Ethics, Region Northern Norway (project number 23430), and the study was performed in accordance
with The Declaration of Helsinki. All participants signed an informed consent before participation. In the consent
form, they stated that they had no history of ongoing disease or any history of serious disease.
Design and stimuli. The study was designed as a repeated measures design with a calibration phase for
determination of temperatures that invoked pain corresponding to 60 mm on a 100-mm computerized visual
analog scale (VAS) scale. Thermal stimuli to the left underarm were delivered by a computer-controlled ther-
mode (Pathway, Medoc, Israel) to induce heat pain. To ensure an equal pain level across participants at the start
of the experiment, a calibration procedure was performed. To approximate the stimulus intensity needed to
produce a rating of 60 on the VAS, Stevens power e quation56 was used to produce a stimulus–response func-
tion for estimation of the individual target temperature of the thermode. After the calibration phase, the pretest
consisting of the presentation of two pain stimuli was performed. The duration of the stimulations in the pretests
and posttests was 10 s from when the thermode reached the calibrated target temperature (43–47 °C) until the
start of the return to baseline at 32 °C20,55. The temperature of the thermode increased/decreased by 10 °C/s. The
interval between the two pretests was 30 s. The two posttests had the same temperature, duration, and intervals
as the pretests20,55. Directly after the pretests, information about the treatment was provided to the participants
allocated to the groups that received either placebo or Emla20,55. The participants in the placebo group were told
“The cream that will be applied to your arm reduces pain, the substance in the cream is used as a local anesthetic
in many pain-reducing remedies and is effective in the treatment of heat pain.” The participants in the natural
history group received no application of cream and were told that they could relax in the break between the
pretests and the posttests20,55. The experimental procedure had a total duration of approximately 45 min, which
included saliva sampling for genetic analyses and measurements of blood pressure and subjective stress.
Statistical analyses. A two-step cluster analysis in SPSS v. 26 (SPSS, IBM, USA) was used to classify
changes in VAS pain intensity from the pretest to the posttest. The order of the participants in the datafile
was randomized by the randperm function in MATLAB (MATLAB v.R2019b, Sweden). The cluster analysis
was set to automatically determine the optimal number of clusters by using Schwarz’s Bayesian criterion57 and
log-likelihood as the distance measure https://www.ibm.com/support/knowledgecenter/SSLVMB_24.0.0/spss/
base/idh_twostep_main.html . The quality of the cluster analysis was measured by the silhouette coefficient,
which is a measure of both cohesion and separation of the suggested clusters. MATLAB Classification Learner
(MATLAB, Sweden; https://se.mathworks.com/help/stats/classificationlearner-app.html) with cross-validation
(fivefolds) was used for the prediction of cutoff values from the two-step cluster analysis. The logistic regression
classifier was used for classification of the selected possible cutoffs for the absolute VAS change and percentage
change between the pre- and posttests. The possible cutoffs were tested separately. Predictive values were deter-
mined from ROC curves providing area under the curve (AUC) values and a confusion matrix that provided
false discovery rate (FDR) values. The accuracy of the predictor is in the Classification Learner calculated from
the cross-validation. The Youden index was calculated in SPSS based on a script (https://www.ibm.com/suppo
rt/pages/can-spss-produce-youdens-index). Group comparisons were performed with two-tailed t-tests. p val-
ues < .05 were considered significant.
Data availability
All data used in the analyses for this article can be found at https://dataverse.no/.
Received: 22 March 2021; Accepted: 16 September 2021
References
1. Colloca, L. & Barsky, A. J. Placebo and Nocebo effects. N. Engl. J. Med. 382, 554–561. https://doi.org/10.1056/NEJMra1907805
(2020).
2. Wager, T. D. & Atlas, L. Y. The neuroscience of placebo effects: Connecting context, learning and health. Nat. Rev. Neurosci. 16,
403–418. https://doi.org/10.1038/nrn3976 (2015).
3. Coleshill, M. J., Sharpe, L., Colloca, L., Zachariae, R. & Colagiuri, B. International Review of Neurobiology Vol. 139, 407–441
(Elsevier, 2018).
4. Finniss, D. G., Kaptchuk, T. J., Miller, F. & Benedetti, F. Biological, clinical, and ethical advances of placebo effects. Lancet 375,
686–695. https://doi.org/10.1016/S0140-6736(09)61706-2 (2010).
5. Vase, L. & Petersen, G. L. Placebo and Pain 203–213 (Elsevier, 2013).
6. Angst, F., Aeschlimann, A. & Angst, J. The minimal clinically important difference raised the significance of outcome effects above
the statistical level, with methodological implications for future studies. J. Clin. Epidemiol. 82, 128–136. https://doi.org/10.1016/j.
jclinepi.2016.11.016 (2017).
7. Todd, K. H., Funk, K. G., Funk, J. P. & Bonacci, R. Clinical significance of reported changes in pain severity. Ann. Emerg. Med. 27,
485–489. https://doi.org/10.1016/s0196-0644(96)70238-x (1996).
8. Gallagher, E. J., Liebman, M. & Bijur, P. E. Prospective validation of clinically important changes in pain severity measured on a
visual analog scale. Ann. Emerg. Med. 38, 633–638. https://doi.org/10.1067/mem.2001.118863 (2001).
9. Bird, S. B. & Dickson, E. W. Clinically significant changes in pain along the visual analog scale. Ann. Emerg. Med. 38, 639–643.
https://doi.org/10.1067/mem.2001.118012 (2001).
Scientific Reports | (2021) 11:19205 | https://doi.org/10.1038/s41598-021-98874-0 6
Vol:.(1234567890)www.nature.com/scientificreports/
10. Jensen, M. P., Chen, C. & Brugger, A. M. Interpretation of visual analog scale ratings and change scores: A reanalysis of two clinical
trials of postoperative pain. J. Pain 4, 407–414 (2003).
11. Olsen, M. F. et al. Minimum clinically important differences in chronic pain vary considerably by baseline pain and methodological
factors: Systematic review of empirical studies. J. Clin. Epidemiol. 101, 87-106.e102. https://doi.org/10.1016/j.jclinepi.2018.05.007
(2018).
12. Forsberg, J. T., Martinussen, M. & Flaten, M. A. The placebo analgesic effect in healthy individuals and patients: A meta-analysis.
Psychosom. Med. 79, 388–394. https://doi.org/10.1097/PSY.0000000000000432 (2017).
13. Enck, P., Klosterhalfen, S., Weimer, K., Horing, B. & Zipfel, S. The placebo response in clinical trials: More questions than answers.
Philos. Trans. R. Soc. B 366, 1889–1895. https://doi.org/10.1098/rstb.2010.0384 (2011).
14. Kaptchuk, T. J. et al. Do “placebo responders” exist?. Contemp. Clin. Trials 29, 587–595 (2008).
15. Beecher, H. K. The powerful placebo. J. Am. Med. Assoc. 159, 1602–1606. https://doi.org/10.1001/jama.1955.02960340022006
(1955).
16. Finniss, D., Nicholas, M., Brooker, C., Cousins, M. & Benedetti, F. Magnitude, response, and psychological determinants of placebo
effects in chronic low-back pain: A randomised, double-blinded, controlled trial. Pain Rep. 4, e744. https://doi.org/10.1097/PR9.
0000000000000744 (2019).
17. Levine, J. D., Gordon, N. C., Bornstein, J. C. & Fields, H. L. Role of pain in placebo analgesia. Proc. Natl. Acad. Sci. U. S. A. 76,
3528–3531. https://doi.org/10.1073/pnas.76.7.3528 (1979).
18. Petrovic, P., Kalso, E., Petersson, K. M. & Ingvar, M. Placebo and opioid analgesia—Imaging a shared neuronal network. Science
295, 1737–1740. https://doi.org/10.1126/science.1067176 (2002).
19. Wager, T. D. et al. Placebo-induced changes in FMRI in the anticipation and experience of pain. Science 303, 1162–1167. https://
doi.org/10.1126/science.1093065 (2004).
20. Aslaksen, P. M., Forsberg, J. T. & Gjerstad, J. The opioid receptor mu 1 (OPRM1) rs1799971 and catechol-O-methyltransferase
(COMT) rs4680 as genetic markers for placebo analgesia. Pain 159, 2585–2592. https://doi.org/10.1097/j.pain.0000000000001370
(2018).
21. Aslaksen, P. M. & Flaten, M. A. The roles of physiological and subjective stress in the effectiveness of a placebo on experimentally
induced pain. Psychosom. Med. 70, 811–818. https://doi.org/10.1097/PSY.0b013e31818105ed (2008).
22. Aslaksen, P. M., Vasylenko, O. & Fagerlund, A. J. The effect of transcranial direct current stimulation on experimentally induced
heat pain. Exp. Brain Res. 232, 1865–1873. https://doi.org/10.1007/s00221-014-3878-0 (2014).
23. Aslaksen, P. M., Zwarg, M. L., Eilertsen, H. H., Gorecka, M. M. & Bjorkedal, E. Opposite effects of the same drug: reversal of topical
analgesia by nocebo information. Pain 156, 39–46. https://doi.org/10.1016/j.pain.0000000000000004 (2015).
24. Sawilowsky, S. S. New effect size rules of thumb. J. Mod. Appl. Stat. Methods 8, 26 (2009).
25. Youden, W. J. Index for rating diagnostic tests. Cancer 3, 32–35. https://doi.org/10.1002/1097-0142(1950)3:13.0.co;2-3 (1950).
26. Fluss, R., Faraggi, D. & Reiser, B. Estimation of the Youden Index and its associated cutoff point. Biometr. J. 47, 458–472. https://
doi.org/10.1002/bimj.200410135 (2005).
27. Linde, K., Fassler, M. & Meissner, K. Placebo interventions, placebo effects and clinical practice. Philos. Trans. R. Soc. Lond. Ser.
B Biol. Sci. 366, 1905–1912. https://doi.org/10.1098/rstb.2010.0383 (2011).
28. Johansen, O., Brox, J. & Flaten, M. A. Placebo and Nocebo responses, cortisol, and circulating beta-endorphin. Psychosom. Med.
65, 786–790. https://doi.org/10.1097/01.psy.0000082626.56217.cf (2003).
29. Benedetti, F., Carlino, E. & Pollo, A. How placebos change the patient’s brain. Neuropsychopharmacology 36, 339–354. https://doi.
org/10.1038/npp.2010.81 (2011).
30. Enck, P., Bingel, U., Schedlowski, M. & Rief, W. The placebo response in medicine: Minimize, maximize or personalize?. Nat. Rev.
Drug Discov. 12, 191–204. https://doi.org/10.1038/nrd3923 (2013).
31. Vase, L., Petersen, G. L., Riley, J. L. 3rd. & Price, D. D. Factors contributing to large analgesic effects in placebo mechanism studies
conducted between 2002 and 2007. Pain 145, 36–44. https://doi.org/10.1016/j.pain.2009.04.008 (2009).
32. Vase, L., Riley, J. L. & Price, D. D. A comparison of placebo effects in clinical analgesic trials versus studies of placebo analgesia.
Pain 99, 443–452 (2002).
33. Bjorkedal, E. & Flaten, M. A. Interaction between expectancies and drug effects: An experimental investigation of placebo analgesia
with caffeine as an active placebo. Psychopharmacology 215, 537–548. https://doi.org/10.1007/s00213-011-2233-4 (2011).
34. Geers, A. L. et al. Affect and emotions in placebo and nocebo effects: What do we know so far?. Soc. Pers. Psychol. Compass 15,
e12575 (2021).
35. Hróbjartsson, A. What are the main methodological problems in the estimation of placebo effects?. J. Clin. Epidemiol. 55, 430–435
(2002).
36. Krogsbøll, L. T., Hróbjartsson, A. & Gøtzsche, P. C. Spontaneous improvement in randomised clinical trials: Meta-analysis of
three-armed trials comparing no treatment, placebo and active intervention. BMC Med. Res. Methodol. 9, 1–10 (2009).
37. Farrar, J. T., Portenoy, R. K., Berlin, J. A., Kinman, J. L. & Strom, B. L. Defining the clinically important difference in pain outcome
measures. Pain 88, 287–294. https://doi.org/10.1016/S0304-3959(00)00339-0 (2000).
38. Baumgartner, U., Cruccu, G., Iannetti, G. D. & Treede, R. D. Laser guns and hot plates. Pain 116, 1–3. https://doi.org/10.1016/j.
pain.2005.04.021|ISSN0304-3959 (2005).
39. Woodcock, J., Witter, J. & Dionne, R. A. Stimulating the development of mechanism-based, individualized pain therapies. Nat.
Rev. Drug Discov. 6, 703–710. https://doi.org/10.1038/nrd2335 (2007).
40. Dionne, R. A., Bartoshuk, L., Mogil, J. & Witter, J. Individual responder analyses for pain: Does one pain scale fit all?. Trends
Pharmacol. Sci. 26, 125–130 (2005).
41. Dworkin, R. H. et al. Research design considerations for confirmatory chronic pain clinical trials: IMMPACT recommendations.
PAIN® 149, 177–193 (2010).
42. Enck, P., Klosterhalfen, S. & Weimer, K. Unsolved, forgotten, and ignored features of the placebo response in medicine. Clin. Ther.
39, 458–468. https://doi.org/10.1016/j.clinthera.2016.11.016 (2017).
43. Muller, M. et al. Treatment history and placebo responses to experimental and clinical pain in chronic pain patients. Eur. J. Pain
20, 1530–1541. https://doi.org/10.1002/ejp.877 (2016).
44. Flaten, M. A., Aslaksen, P. M., Lyby, P. S. & Bjorkedal, E. The relation of emotions to placebo responses. Philos. Trans. R. Soc. Lond.
Ser. B Biol. Sci. 366, 1818–1827. https://doi.org/10.1098/rstb.2010.0407 (2011).
45. Colloca, L. et al. OPRM1 rs1799971-COMT rs4680-FAAH rs324420 genes interact with placebo procedures to induce hypoalgesia.
Pain 160, 1824 (2019).
46. Hrobjartsson, A. & Gotzsche, P. C. Placebo interventions for all clinical conditions. Cochrane Database Syst. Rev. 2010, CD003974.
https://doi.org/10.1002/14651858.CD003974.pub3 (2010).
47. Hrobjartsson, A. & Gotzsche, P. C. Is the placebo powerless? An analysis of clinical trials comparing placebo with no treatment.
N. Engl. J. Med. 344, 1594–1602 (2001).
48. Zunhammer, M., Bingel, U., Wager, T. D. & Placebo Imaging, C. Placebo effects on the neurologic pain signature: A meta-analysis
of individual participant functional magnetic resonance imaging data. JAMA Neurol. 75, 1321–1330. https://doi.org/10.1001/
jamaneurol.2018.2017 (2018).
Scientific Reports | (2021) 11:19205 | https://doi.org/10.1038/s41598-021-98874-0 7
Vol.:(0123456789)www.nature.com/scientificreports/
49. Zunhammer, M., Spisak, T., Wager, T. D., Bingel, U. & Placebo Imaging, C. Meta-analysis of neural systems underlying placebo
analgesia from individual participant fMRI data. Nat. Commun. 12, 1391. https://doi.org/10.1038/s41467-021-21179-3 (2021).
50. Wager, T. D. et al. An fMRI-based neurologic signature of physical pain. N. Engl. J. Med. 368, 1388–1397. https://doi.org/10.1056/
NEJMoa1204471 (2013).
51. Muñoz-Leyva, F., El-Boghdadly, K. & Chan, V. Is the minimal clinically important difference (MCID) in acute pain a good measure
of analgesic efficacy in regional anesthesia?. Reg. Anesth. Pain Med. 45, 1000–1005 (2020).
52. Hajian-Tilaki, K. The choice of methods in determining the optimal cut-off value for quantitative diagnostic test evaluation. Stat.
Methods Med. Res. 27, 2374–2383. https://doi.org/10.1177/0962280216680383 (2018).
53. López-Ratón, M., Rodríguez-Álvarez, M. X., Cadarso-Suárez, C. & Gude-Sampedro, F. OptimalCutpoints: An R package for
selecting optimal cutpoints in diagnostic tests. J. Stat. Softw. 61, 1–36 (2014).
54. Mbowe, O. B., Gewandter, J. S., Turk, D. C., Dworkin, R. H. & McDermott, M. P. Are there really only 2 kinds of people in the
world? Evaluating the distribution of change from baseline in pain clinical trials. Pain 161, 195–201 (2020).
55. Forsberg, J. T., Gjerstad, J., Flaten, M. A. & Aslaksen, P. M. Influence of catechol-O-methyltransferase Val158Met on fear of pain
and placebo analgesia. Pain 159, 168–174. https://doi.org/10.1097/j.pain.0000000000001081 (2018).
56. Stevens, S. S. To honor Fechner and repeal his law: A power function, not a log function, describes the operating characteristic of
a sensory system. Science 133, 80–86. https://doi.org/10.1126/science.133.3446.80 (1961).
57. Schwarz, G. Estimating the dimension of a model. Ann. Stat. 6, 461–464 (1978).
Acknowledgements
The author thanks Espen Bjørkedal, PhD, for valuable comments in the process of writing the article.
Author contributions
P.M.A. was responsible for all aspects of the present study.
Competing interests
The authors declare no competing interests.
Additional information
Supplementary Information The online version contains supplementary material available at https://doi.org/
10.1038/s41598-021-98874-0.
Correspondence and requests for materials should be addressed to P.M.A.
Reprints and permissions information is available at www.nature.com/reprints.
Publisher’s note Springer Nature remains neutral with regard to jurisdictional claims in published maps and
institutional affiliations.
Open Access This article is licensed under a Creative Commons Attribution 4.0 International
License, which permits use, sharing, adaptation, distribution and reproduction in any medium or
format, as long as you give appropriate credit to the original author(s) and the source, provide a link to the
Creative Commons licence, and indicate if changes were made. The images or other third party material in this
article are included in the article’s Creative Commons licence, unless indicated otherwise in a credit line to the
material. If material is not included in the article’s Creative Commons licence and your intended use is not
permitted by statutory regulation or exceeds the permitted use, you will need to obtain permission directly from
the copyright holder. To view a copy of this licence, visit http://creativecommons.org/licenses/by/4.0/.
© The Author(s) 2021
Scientific Reports | (2021) 11:19205 | https://doi.org/10.1038/s41598-021-98874-0 8
Vol:.(1234567890)You can also read