Does China's overseas lending favor One Belt One Road countries?
←
→
Page content transcription
If your browser does not render page correctly, please read the page content below
Munich Personal RePEc Archive

Does China’s overseas lending favor One
Belt One Road countries?

Zhang, Yifei and Fang, Heyang

Beijing Normal University-Hong Kong Baptist University, United
International College, The Chinese University of Hong Kong

3 January 2020

Online at https://mpra.ub.uni-muenchen.de/97954/
MPRA Paper No. 97954, posted 05 Jan 2020 05:13 UTC
Does China's overseas lending favor the One Belt One Road countries?

 Heyang Fang and Yifei Zhang ∗

 January 2020

 Abstract
The One Belt One Road initiative is found to promote China’s overseas lending in the
belt road countries, especially for countries along the continental route. Such effect
strengthens and persists for at least three years. Our findings show that launching a
national strategy could be a decisive determinant of one country’s outbound loans.

JEL Code: F34, F42
Keywords: International lending, One Belt One Road

* Heyang is with The Chinese University of Hong Kong. Email: fangheyang2020@gmail.com.Yifei is with Beijing
Normal University-Hong Kong Baptist University, United International College. Email: yifei-zhang@foxmail.com.
“China’s commitment to building infrastructure in countries covered by its ‘One Belt,
One Road’ initiative - a scheme to boost development along ancient ‘silk road’ trading
routes between China and Europe - is revealed by data showing that the lion’s share
of Beijing’s recent overseas lending pledges have been in countries that lie along the
routes.”

 Financial Times (June 18, 2015)

 1. Introduction

 Banks from developed countries often provide credits to developing countries
(Dymski, 2003), as marginal returns are usually higher in less developed regions
(Healey, 1995). Despite extensive studies regarding advanced countries’ overseas
lending (Goldberg, 2002; Porzecanski, 1981), that of large developing countries such
as China is largely left uncharted.
 In addition to economic considerations, developing countries’ overseas lending
features political reasons, especially for state-owned banks having such objectives
rather than profit maximization goals (Berger et al., 2004; Berger, 2007; Dinc, 2005).1
As China becomes an active international lender in recent decades, it is pivotal to ask
whether and how China’s overseas lending is motivated by its recent foreign policies.
This inspires our study of the grand One Belt One Road (OBOR) policy initiative and
it is intriguing to investigate whether China’s aggregate lending favors the OBOR
countries in the wake of this national strategy.2

1
 Not surprisingly, China’s official commitments are also found to be primarily driven by its foreign
policy (Dreher & Duchs, 2016; Dreher et al., 2018).
2
 China’s overseas lending is mainly through its state-owned banks (Horn et al., 2019). It includes the
two state-owned policy banks (China Export-Import Bank and China Development Bank) and the four
state-owned commercial banks (The Bank of China, the Agricultural Bank of China, the Industrial and
Commercial Bank of China and China Construction Bank).

 1
The OBOR initiative was announced by President Xi Jinping in autumn 2013
during his visit in Kazakhstan, where he unveiled the vision of an ‘Economic Belt’ (i.e.
the land belt) linking China with Central Asia, Central and Eastern Europe, and ends
up in Western Europe. Soon, President Xi proposed a similar ‘Maritime Silk Road’ (i.e.
the sea road), which runs through Southeast Asia, the Persian Gulf and the
Mediterranean, to the same destination as the Economic Belt. Comprising both the land
belt and the sea road, the OBOR initiative is not only a network of ports, railways, roads,
pipelines connecting China with the targeted regions, but a blueprint that access to new
markets for trade and investments, and diplomatic policies to enhance multilateral
relationships. Up to 2017, the OBOR strategy covers 68 target countries with around 8
trillion dollars invested in infrastructures such as transportation networks, energy, and
telecommunications (Balding, 2017; Moser, 2017).
 This paper contributes to the existing literature in two folds. First, it mostly relates
to recent works investigating the impacts of the OBOR initiative on trade and
investments (e.g. Du & Zhang, 2018; Herrero & Xu, 2017; Hurley et al., 2019; Li et al.,
2019). Furthermore, there are only narrative descriptions rather than statistical
evidences discussing China’s loans and grants to OBOR countries (Bräutigam, 2011;
Cheng, 2016; Kynge, 2015; Lin & Wang, 2017; Yu, 2017). Our work fills the gap and
establishes a causal relationship of the policy impact on China’s outbound loans.
 Second, studies relating to China’s overseas lending (Dreher & Fuchs, 2016;
Dreher et al., 2018; Hurley et al., 2019) often do not take “hidden debts” (i.e.,
undisclosed foreign official lending flows) into account. Zucman (2013) and Coppola
et al. (2019) argue that China’s lending to developing countries involves offshore
financial centers and/or borrowers’ foreign banks, which make China’s oversea loans
hard to track. Since such opaqueness could potentially bias the results, we use a new
data set complied by Horn et al. (2019) that explicitly addresses such problems.
 The remainder of this paper is organized as follows: Section 2 describes the data
and variables, Section 3 shows the identification strategies, Section 4 presents the
empirical results, Section 5 checks the robustness of the results and Section 6 concludes.

 2
1. Data and variables

 Our main data is from Horn et al. (2019), which includes oversea debt stocks
owned by Chinese official and state-owned creditors. It mitigates the “hidden debt”
problem by matching from both debtors’ and creditors’ sides, namely the Debtor
Reporting System (DRS) and the Bank of International Settlements (BIS) Locational
Banking Statistics. The data is considered as one of the most reliable and updated
sources of China’s overseas lending. Moreover, our country year-varying control
variables in section 3 are from the Penn World Table 9.0 (Feenstra et al., 2015).
 We mainly follow Du & Zhang (2018) to construct the belt-road country list. We
also manually check the news and update the country list, as the coverage of the OBOR
is constantly expanding. According to China’s official announcements or news reports,
we further collect the years of agreement signed with those OBOR countries, which we
use in section 5.3
 Our final sample contains 105 recipient countries, with 51 OBOR countries (38 on
the land belt and 13 along the sea road) from 2010 to 2017. 4 Table 1 presents the
summary statistics of the main variables and Appendix Table A lists the variable
definitions and their sources.

 [Table 1 about here]

 2. Identification Strategy

 To gauge the impact of the OBOR initiative on China’s overseas lending, we
employ a difference-in-differences (DD) strategy, following Du & Zhang (2018) and
Mao et al. (2019). Specifically, we use the OBOR countries as the treatment group and

3
 The country list and their OBOR signature years are provided in the online supplementary material,
Table A1 and Table A2 respectively.
4
 Our choice of the start year is standard and follows the related literature such as Du & Zhang (2018).
 3
the non-OBOR countries as the control group. Treating the policy announcement in late
2013 as an exogenous shock, we define years on or after 2014 as the post period, and
year 2010 to 2013 as the pre-shock period. Our baseline DD model is thus specified as
follows:

 = 0 + 1 × + + + + (1)

 where is the logarithm of China’s total overseas lending to country i in year t.
 is a dummy variable and equals to 1 if t is after year 2014 and 0 otherwise.
 is an indicator variable and equals to 1 if the recipient country i is an OBOR
country and 0 otherwise. is a vector of country i’s year-varying controls such as
GDP, population, capital stock, exchange rate, etc. Note that model (1) does not include
 and , as they are absorbed by the recipient country ( ) and the year fixed
effects ( ) respectively. The standard error is clustered at borrower country level to
account for potential serial correlations within that country. Moreover, loan
commitments could also be path-dependent, as loans to developing countries often
follow schedules spanning over years (Kraay, 2014). To alleviate such concern, we
include lagged loan amount in some specifications. We also present results
incorporating the lagged country controls.
 To substantiate our argument that the change in China’s overseas lending is solely
due to the OBOR initiative, we adopt the following time-varying DD model that treats
the OBOR agreement year as the shock year:

 = 0 + 1 + + + + (2)

 where is a dummy variable and equals to 1 after country i signs the
agreement with China in year t, and 0 otherwise. Other notations and the cluster
standard error are the same as model (1). The coefficient of interest, 1 , estimates how
loan amount changes for signatory i.

 4
3. Empirical Results

 [Figure 1 about here]

 Figure 1 presents the coefficients of year fixed effect from 2011 to 2017, using 2010
as the base year. The advantage of this standard approach is to control for countries’
unobserved time-invariant heterogeneities (Schularick, et al., 2012). It is observed that
the OBOR countries tend to receive more loans and the growth rate also increases after
2014. In contrast, the non-OBOR countries have relative steady experience through
2011 to 2017, reflecting the fact that the OBOR strategy neither promotes nor harms
their loans.

 [Table 2 about here]

 Next, we turn to our DD analysis. Table 2 shows the result of the pre-trend analysis.
As all pre-shock year interaction terms are not significant, the parallel trend assumption
of our DD strategy is thus valid. That is, the commitment loan amounts between the
OBOR and the non-OBOR countries exhibit no statistical differences for the years prior
to the policy announcement.

 [Table 3 about here]

 Then we turn to our main results examining the impact of the OBOR initiative on
China’s overseas lending. Column (1) and (2) of Table 3 show significant and
consistent positive effects of this national strategy by comparing the changes between
the OBOR countries and the non-OBOR countries, regardless of whether lagged

 5
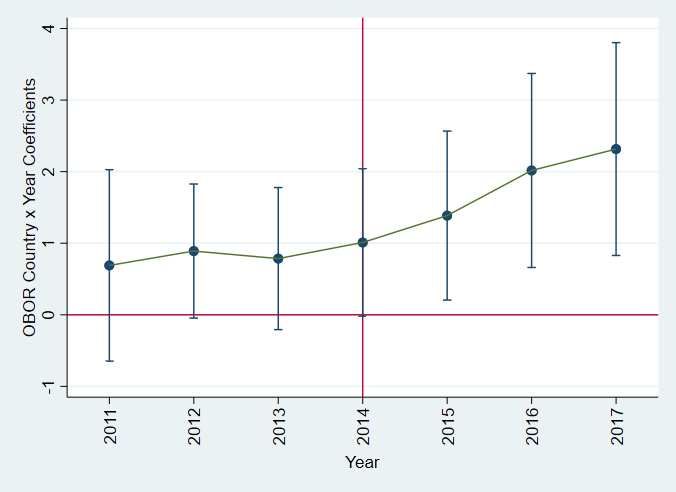
country controls are included or not.5 The results still hold in column (3) and (4) when
controlling for the lagged loans, ruling out the possibility that the increased lending
after the policy initiative is purely due to the previous loan agreements. In particular,
the positive significant coefficient of lagged one lending supports the argument that
China’s policy loans could be path-dependent (Kraay, 2014; Mattlin & Nojonen, 2015).
Quantitatively, the coefficient in column (4) shows that on average, China’s oversea
lending to the OBOR countries increases by 98 percent after this grant policy initiative.
 Next, we explore the potential heterogeneities on loans to the continental and the
maritime routes. Columns (5) to (8) exhibit a strong inclination on loans to the land belt
countries, after controlling country lagged controls and/or lagged loans. It implies,
according to column (8), that the land belt countries’ loans are about 1.3 times higher
in the post-strategy years relative to those of sea road countries. Such drastic expansion
might be justified by the large-scale infrastructure projects in the land belt countries
(Cerutti & Zhou, 2018), which is consistent with the findings regarding China’s
outward direct investments (ODI) (Du & Zhang, 2018).

 [Figure 2 about here]

 We further show the dynamic effect of the OBOR initiative on China’s overseas
loans in Fig. 2, using 2010 as the base year. Despite the insignificant differences
between the OBOR and the non-OBOR countries in pre-shock years, it is observed that
the aggregate lending upsurges instantaneously in response to the policy announcement
in year 2014. Moreover, such effect persists and escalates until the end our sample
period. A plausible explanation is that a government’s official lending program may
send a positive signal to state-owned banks (Kawai & Liu, 2001), which encourages
them to involve more heavily in the OBOR countries. Overall, the dynamic analysis

5
 Note that the number of observations of our results does not decrease when including lagged
variables, as Horn et al. (2019)’s data starts in 2000 while the first year in our estimations is 2010.
 6
suggests the long run vision of this national strategy and the increasing commitments
from Chinese official creditors.

 4. Robustness check

 [Table 4 about here]

 One potential critique could be that our results might be purely driven by other
factors rather than the OBOR initiative itself, as many other confounding incidents
affecting China’s official lending could take place in model (1)’s common shock year
setting. To address the concern, we employ an extended DD model incorporating one
crucial recipient country time-varying factor, the signature year of the OBOR
agreement, into the benchmark model, as China signed the OBOR agreements with
countries in various years.
 The impacts of loans on the OBOR countries and the land-based countries are
presented in Table 4. Column (1) and (2) indicate that the agreement to join the initiative
causes a strongly positive effect on China’s overseas lending relative to their non-
signatory and sea-road peers respectively, suggesting the substantial supports from
Chinese official creditors in advocating this national strategy. Both specifications
control for the lagged treatment up to three years, and no significant
changes of China’s lending are found prior to the year of signature. Thus, they alleviate
the reverse causality concerns and show the robustness of our estimations. That is, it is
not the loan commitments per se that entice countries to join the OBOR initiative and
to sign the agreements.

 5. Conclusion

 Using a novel and rigorous aggregate loan data, this paper investigates whether
China’s overseas lending favors the One Belt One Road countries. Our difference-in-

 7
differences results show that the initiative does promote China’s outbound lending, and

especially to the land belt countries. The impact intensifies and continues throughout

our sample period. Our results are robust if adopting the year of signature as an
alternative shock. Overall, our findings contribute to the literature that a national
strategy’s launch could be a critical determinant of one country’s overseas loans.

 8
References

Balding, C., 2017. Can China Afford Its Belt and Road? Bloomberg.
https://www.bloomberg.com/view/articles/2017-05-17/can-china-afford-its-belt-and-
road (accessed 19 December 2019).

Berger, A. N., 2007. International comparisons of banking efficiency. Financial
Markets, Institutions & Instruments, 16(3), 119-144. https://doi.org/10.1111/j.1468-
0416.2007.00121.x

Berger, A. N., Demirgüç-Kunt, A., Levine, R., Haubrich, J. G., 2004. Bank
concentration and competition: An evolution in the making. J. Money Credit Bank.
433-451. https://www.jstor.org/stable/3838945

Bräutigam, D., 2011. Aid ‘with Chinese characteristics’: Chinese foreign aid and
development finance meet the OECD‐DAC aid regime. J. Int. Dev. 23(5), 752-764.
https://doi.org/10.1002/jid.1798

Cerutti, E., & Zhou, H., 2018. The Chinese Banking System: Much more than a
Domestic Giant. VoxEU. https://voxeu.org/article/chinese-banking-system
(accessed 19 December 2019).

Cheng, L. K., 2016. Three questions on China's “Belt and Road Initiative”. China
Econ. Rev. 40, 309-313. https://doi.org/10.1016/j.chieco.2016.07.008

Coppola, A., Maggiori, M., Neiman, B., Schreger, J., 2019. Redrawing the Map of
Global Capital Flows: The Role of Cross-Border Financing and Tax Havens. Mimeo.
https://faculty.chicagobooth.edu/brent.neiman/research/CMNS.pdf

Dinc, S., 2005. Politicians and banks: political influences on government-owned
banks in emerging countries. J. Financ. Econ. 77, 453–479.
https://doi.org/10.1016/j.jfineco.2004.06.011

Dreher, A., & Fuchs, A., 2016. Rogue aid? An empirical analysis of China’s aid
allocation. Canadian J. Econ. 48(3), 988-1023. https://doi.org/10.1111/caje.12166

Dreher, A., Fuchs, A., Parks, b., Strange, A. M., Tierney, M. J., 2018. Apples and
Dragon Fruits: The Determinants of Aid and Other Forms of State Financing from
China to Africa. Int. Stud. Q. 62(1), 182 – 194. https://doi.org/10.1093/isq/sqx052

Du, J., & Zhang, Y., 2018. Does one belt one road initiative promote Chinese
overseas direct investment?. China Econ. Rev. 47, 189-205.
https://doi.org/10.1016/j.chieco.2017.05.010

 9
Dymski, G., 2003. The International Debt Crisis, in: Michie, J. (ed.), The Hand Book
of Globalisation, Cheltenham: Edward Elgar, pp. 117-134.

Feenstra, R. C., Inklaar, R., Timmer M. P., 2015. The Next Generation of the Penn
World Table. Am. Econ. Rev. 105(10), 3150-3182.DOI: 10.1257/aer.20130954

Goldberg, L. S., 2002. When is US bank lending to emerging markets volatile?.
In Preventing currency crises in emerging markets (pp. 171-196). University of
Chicago Press. http://www.nber.org/chapters/c10636

Healey, H., 1995. The International Debt Crisis, in Ghatak, S. (ed.), Introduction to
Development Economics. London: TJ Press, pp. 424-448.

Herrero, A. G., & Xu, J., 2017. China's Belt and Road Initiative: Can Europe Expect
Trade Gains?. China & World Econ. 25(6), 84-99. https://doi.org/10.1111/cwe.12222

Horn, S., Reinhart, C. M., Trebesch, C., 2019. China's Overseas Lending. NBER
Working Paper No. 26050. http://www.nber.org/papers/w26050

Hurley, J., Morris, S., Portelance, G., 2019. Examining the debt implications of the
Belt and Road Initiative from a policy perspective. J. Infrastruct. Policy Dev. 3(1),
139-175. http://dx.doi.org/10.24294/jipd.v3i1.1123

Inklaar, R., Woltjer, P., Albarrán, D. G., 2019. The composition of capital and cross-
country productivity comparisons. Int. Productivity Monitor. (36), 34-52.

Kawai, M., & Liu, L. G., 2001. Determinants of International Commercial Bank
Loans to Developing Countries. In Far Eastern Meeting of the Econometric Society,
Kobe, Japan, July (pp. 20-21).

Kraay, A., 2014. Government spending multipliers in developing countries: evidence
from lending by official creditors. Am. Econ. J.: Macroecon. 6(4), 170-208. DOI:
10.1257/mac.6.4.170

Kynge, J., 2015. Chinese overseas lending dominated by One Belt, One Road
strategy. Financial Times, 18. https://www.ft.com/content/e9dcd674-15d8-11e5-be54-
00144feabdc0 (accessed 19 December 2019).

Li, Z., Huang, Z., Dong, H., 2019. The Influential Factors on Outward Foreign Direct
Investment: Evidence from the “The Belt and Road”. Emerg. Markets Financ. Trade.
1-16. https://doi.org/10.1080/1540496X.2019.1569512

Lin, J. Y., & Wang, Y., 2017. Development beyond aid: Utilizing comparative
advantage in the belt and road initiative to achieve win-win. J. Infrastruct. Policy
Dev. 1(2), 149-167. http://dx.doi.org/10.24294/jipd.v1i2.68
 10
Mao, H., Liu, G., Zhang, C., Atif, R. M., 2019. Does belt and road initiative hurt node
countries? A study from export perspective. Emerg. Markets Financ. Trade. 55(7),
1472-1485. https://doi.org/10.1080/1540496X.2018.1553711

Mattlin, M., & Nojonen, M., 2015. Conditionality and path dependence in Chinese
lending. J. Contemporary China. 24(94), 701-720.
https://doi.org/10.1080/10670564.2014.978154

Moser, J., 2017. China’s Bridge to Nowhere. Forbes.
https://www.forbes.com/sites/joelmoser/2017/09/07/chinas-bridge-to-
nowhere/#41f713951568 (accessed 19 December 2019).

Porzecanski, A. C., 1981. The international financial role of US commercial banks:
Past and future. J. Bank. Financ. 5(1), 5-16. https://doi.org/10.1016/0378-
4266(81)90004-2

Schularick, Moritz, and Alan M. Taylor. 2012. "Credit Booms Gone Bust: Monetary
Policy, Leverage Cycles, and Financial Crises, 1870-2008." Am. Econ. Rev. 102 (2):
1029-61. DOI: 10.1257/aer.102.2.1029

Yu, H., 2017. Motivation behind China’s ‘One Belt, One Road ‘initiatives and
establishment of the Asian infrastructure investment bank. J. Contemporary
China. 26(105), 353-368. https://doi.org/10.1080/10670564.2016.1245894

Zucman, G., 2013. The Missing Wealth of Nations: Are Europe and the U.S. Net
Debtors or Net Creditors? Q. J. Econ. 128 (3), 1321-64.
https://doi.org/10.1093/qje/qjt012

 11
Table 1 Descriptive statistics.
This table presents the summary statistics. Detailed definitions of all the variables are
listed in Appendix Table A.
Variable Obs Mean Std. Dev. Min Max
Loan Amount (Log) 839 19.384 4.744 0.000 24.344
GDP (Log) 839 26.310 1.912 21.294 30.894
Population (Log) 776 18.568 1.750 13.454 23.318
Capital Stock (Log) 776 28.424 1.870 23.535 33.333
Depreciation Rate (Ratio) 776 0.049 0.014 0.021 0.102
Exchange Rate (Ratio) 776 1129.850 3510.052 0.088 33226.300
Capital Services (Ratio) 560 1.132 0.239 0.137 3.034

 12
Table 2 Parallel trend test.
This table presents the results of the parallel trend test. The dependent variable is the logarithm of
China’s aggregate loan amount to the recipient country i. Each pre-shock year dummy is interacted
with the OBOR country dummy before the policy announcement. For brevity, we do not report the
estimate for × . Country fixed effect is also included. Robust standard errors, clustered
at recipient country level, are reported in parentheses. *, **, and *** denote significance at the 10%,
5% and 1% level, respectively.
 (1)
VARIABLES Loans
Year 2011 * -0.705
 (0.564)
Year 2012 * -0.365
 (0.467)
Year 2013 * -0.781
 (0.568)
Constant 18.27***
 (0.220)
Country FE Yes
Observations 839
Adjusted R-squared 0.698

 13
Table 3 The impact of the OBOR policy on China’s overseas lending.
This table shows the DD results investigating the impact of the OBOR policy on China’s overseas lending. The dependent
variable is the logarithm of China’s aggregate loan amount to the recipient country i. Both country controls, country and
year fixed effects are included in all specifications. Column (1) to (4) are the DD results of all countries. Column (1) is the
baseline and column (2) adds the country lagged controls. Column (3) and (4) include the lagged loans up to 3 years with
and without lagged country controls. Columns (5) to (8) show the corresponding results for land belt countries. Robust
standard errors, clustered at recipient country level, are reported in parentheses. *, **, and *** denote significance at the
10%, 5% and 1% level, respectively.
 All Countries The OBOR Countries
 (1) (2) (3) (4) (5) (6) (7) (8)
VARIABLES Loans Loans Loans Loans Loans Loans Loans Loans
 * 1.378** 1.376*** 1.010*** 0.981**
 (0.525) (0.509) (0.371) (0.399)
 * 2.653*** 2.893*** 1.323** 1.347*
 (0.908) (0.965) (0.636) (0.713)
 (-1) 0.494*** 0.502*** 0.504*** 0.488***
 (0.0731) (0.0755) (0.0870) (0.0756)
 (-2) 0.0376*** -0.0203 -0.0313 0.0371
 (0.0138) (0.0276) (0.0254) (0.0672)
 (-3) -0.0173 -0.0133 -0.0163 -0.0170
 (0.0206) (0.0194) (0.0505) (0.0624)
Constant 70.70 36.5 -17.41 -60.58 135.1 54.53 -5.156 -235.5
 (158.1) (164.8) (123.5) (123.6) (292.3) (300.9) (229.6) (238.8)
Country FE Yes Yes Yes Yes Yes Yes Yes Yes
Year FE Yes Yes Yes Yes Yes Yes Yes Yes
Country Controls Yes Yes Yes Yes Yes Yes Yes Yes
Country Lag Controls No Yes No Yes No Yes No Yes
Observations 560 560 560 560 280 280 280 280
Adjusted R-squared 0.807 0.812 0.855 0.859 0.820 0.825 0.859 0.868

 14
Table 4 The impact of signing the OBOR agreement on China’s overseas
lending.
This table shows the time-varying DD results investigating the impact of the OBOR agreement
on China’s overseas lending. The dependent variable is the logarithm of China’s aggregate loan
amount to the recipient country i. it is a dummy variable and equals 1 after country
i signs the agreement with China in year t, and 0 otherwise. * is a dummy
variable and equals 1 after land-based country i signs the agreement with China in year t, and
0 otherwise. The country fixed effect, the year fixed effect, country controls and lagged
treatment variables it up to three years are included in all specifications. Column (1)
presents the result for the OBOR countries and column (2) is for the land belt countries. Robust
standard errors, clustered at recipient country level, are reported in parentheses. *, **, and ***
denote significance at the 10%, 5% and 1% level, respectively.

 (1) (2)
 VARIABLES Loans Loans
 1.066*
 (0.562)
 * 1.959*
 (1.007)
 (-1) 0.298 0.539
 (0.413) (0.946)
 (-2) -1.037 0.545
 (0.699) (1.464)
 (-3) -0.135 0.0471
 (0.672) (1.599)
 Constant 3.994 199.2
 (157.7) (337.3)
 Country FE Yes Yes
 Year FE Yes Yes
 Country Controls Yes Yes
 Country Lag Controls Yes Yes
 Observations 560 280
 Adjusted R-squared 0.812 0.826

 15
Figure 1 The trend of China’s over sea lending to the OBOR and the non-OBOR
countries.

 16
Figure 2 The dynamic effects of the OBOR initiative in China’s oversea loans.

 17
Appendix Table A Variable Definitions and Sources

Variable Sources Definition
Loan Amount (Log) Horn et al. (2019) Natural logarithm of the estimated total external debt owed to China (USD).
GDP (log) Horn et al. (2019) Natural logarithm of Nominal GDP in USD.
Population (log) Penn World Table 9.0 Natural logarithm of the country’s population.
Capital Stock (log) Penn World Table 9.0 Natural logarithm of the capital stock at constant 2011 prices in USD.
Depreciation Rate Penn World Table 9.0 Average depreciation rate of the capital stock.
Exchange Rate Penn World Table 9.0 Official exchange rate (national currency / USD).
Capital Services Penn World Table 9.0 Capital services at constant 2011 national prices (2011=1).

 18
Table A1 Loan recipient country list.
This table lists all the recipient countries in our analysis, as to their alphabetical orders.
Countries denoted by # and * are the land-road countries and the sea-belt countries
respectively.

 Albania* Dominica Mauritius Tanzania
 Algeria Ecuador Mexico Togo
 Angola Egypt* Mongolia# Tonga#
 Argentina Equatorial Guinea Montenegro* Turkey#
 Armenia# Eritrea Morocco Turkmenistan#
 Azerbaijan# Ethiopia Mozambique Uganda
 Bahamas Fiji* Myanmar* Ukraine#
 Bangladesh* Gabon Namibia Uruguay
 Belarus# Ghana Nepal# Uzbekistan#
 Benin# Guinea Niger Vanuatu
 Bolivia Guyana Nigeria* Venezuela
 Bosnia# India* Oman# Vietnam*
 Botswana Indonesia* Pakistan# Yemen, Rep.*
 Brazil Iran# Papua New Guinea Zambia
 Bulgaria# Jamaica Peru Zimbabwe
 Burkina Faso# Jordan# Philippines*
 Burundi# Kazakhstan# Romania#
 Cabo Verde# Kenya* Russia#
 Cambodia* Kyrgyzstan# Rwanda
 Cameroon Laos* Samoa
 Central African Republic Lebanon# Senegal
 Chad Lesotho Serbia*
 Chile Liberia Seychelles
 Colombia Macedonia, FYR# Sierra Leone
 Comoros# Madagascar South Africa
 Congo, Dem. Rep. Malawi# South Sudan#
 Congo, Rep. Malaysia* Sri Lanka*
 Costa Rica Maldives# Sudan#
 Cote d'Ivoire# Mali Suriname
 Djibouti Mauritania Tajikistan#

 19
Table A2 The signatory years of the One Belt One Road countries.
This table illustrates the signatory years of the recipient countries, as to their alphabetical orders and the news sources respectively.

 Country Sign year Sources
 Albania 2017 http://wmzh.china.com.cn/2018-11/29/content_40596228.htm
 Armenia 2016 https://www.baidu.com/link?url=2lDm00NjrtMTZMwmOQaGNtJ3Nk8-
 cx4ERPZqGlxErGuGXO7lMAnpfJCvIpLVb_kP1IoiXPz3l5moRti2cunAQESgI2iLSHYtKkSsHmARYIm&wd=&eqid=d49
 af4dd0006d564000000065dde42c7
 Azerbaijan 2015 https://www.baidu.com/link?url=7-
 iWERPnubMphUG6FKia0mtuVJvGmFD_vtG7Ynyz8TIGBujozJpNrWDkrYZ1AmkIgJwFUr91iUfgXTdiO_4-
 P15jYSpjf__GBh77qT0DoIK&wd=&eqid=fb3fbe1c00045fc8000000065dde37d2
 Bangladesh 2016 https://www.baidu.com/link?url=z9gsN2EIlLu68wij7bK0YG14Y5LEWOBks5JVIBmd9EEYLa9JBMQOKJ-
 ODSrT1watS7ei6nuIaAwyda9vy7nemGpweRhjq7jVjOxrqqL43ge&wd=&eqid=91fa8848000a81a0000000065dde434e
 Belarus 2015 https://www.baidu.com/link?url=vMXenUY-
 Fr8deYEQTzl0K4bHCq1_4GtW9vLAfR5608484cCQiTUBs4KD3ddzK_4fxIYjKOvHWqXMsBMY20EU3a&wd=&eqid=a
 596823b0005850f000000065dde43b1
 Benin 2019 https://weibo.com/5282792576/IbzXx8hSm?type=comment
 Bosnia 2017 https://www.baidu.com/link?url=29hhs94yPOE3Hd2Ppiut8k8Ieav9of3mER1sDpTf2e2OTvtSqPmkfmNVSV5S_aQE15PM4
 PQ0uX1l5rYURRyf6WIHmcE_ceuEQXxcZOrKm87&wd=&eqid=8f3561a6002f0610000000065ddd3e31
 Bulgaria 2015 https://www.baidu.com/link?url=0htgAwkyqnx_Q8WXraqpIAf7nc315TAl3bPEz3RbKSIO6QPt9zWY0W5s3En4uaxYT53
 X9Tw1tXHmcw7iNeJLL03zGuwz-aeqAJWMo86bvae&wd=&eqid=906f81eb000439a9000000065dde387d
 Burkina Faso N.A.
 Burundi 2018 http://special.chinadevelopment.com.cn/2018zt/zflt/2018/09/1348183.shtml
 Cabo Verde 2018 http://special.chinadevelopment.com.cn/2018zt/zflt/2018/09/1348183.shtml
 Cambodia 2016 https://www.baidu.com/link?url=j52AtMrK8o8pDZDalaRTY-
 RvwHnPAANLJipxUQTWeecwJN3PyjmzLnqhsI1EitAq8TcQ1aJl-daQ-
 LHrR3zb8K&wd=&eqid=abe6d41b0009147f000000065dde44a7
 Comoros 2018 http://news.eastday.com/eastday/13news/auto/news/china/20180831/u7ai8024912.html
 Cote d'Ivoire 2018 http://special.chinadevelopment.com.cn/2018zt/zflt/2018/09/1348183.shtml
 Egypt 2016 https://www.baidu.com/link?url=GtFxG7zpuokIMyqCRjM-zGPSyEvnXaW2CH7Kd6RyPRVUds-LPwI2SF-
 R9_D_VgRb6OuWlqxNVM6Gwz3weqexzNkRqfgkIF2qO7Eaa9vS2m2rzm_BeecBILilWLaDLgBv&wd=&eqid=f24339c9
 0003a223000000065dde3240

 20
Fiji 2018 http://srcf.urumqi.gov.cn/2016n/cxdt/409980.htm
India N.A.
Indonesia 2018 https://www.baidu.com/link?url=5GpeYKUQgiLrcNUqQKuxSylYjz5EbsPe8EJvH_3ojsCwwkEnALJ22Mm3l1nAIk_2&wd
 =&eqid=d06c2e4700000ab6000000065dde45a3
Iran 2016 http://mil.chinanews.com/gn/2016/01-23/7729188.shtml
Jordan 2018 https://www.baidu.com/link?url=Rwq2kDmFhcJsS0lsYU9KOYXa0Fpl3rEDw3Z4pfWvGBfypDIAo-
 dWWa9MH0q304kT&wd=&eqid=e6f89cc60001e63a000000065dde4b98
Kazakhstan 2014 http://www.ebrun.com/20170522/231917.shtml
Kenya 2018 http://special.chinadevelopment.com.cn/2018zt/zflt/2018/09/1348183.shtml
Kyrgyzstan 2015 https://www.baidu.com/link?url=rDdsiSPdpEQEuPCADxuW2ynNwj7d5zuXjeZpZaZ1OywJYoAbMWoTTuWdZ-
 ZVprbaw3qvCxWA78v2yOvtYuJtX1ASYG8yPq7bSqWrNNDNUwe&wd=&eqid=c328310a00020cdf000000065dde4cf7
Laos 2016 https://www.baidu.com/link?url=mYzaGPysR2c68eyfZtvAA4Pi8PG69qz8rD2DsPXF0_2gLKFK9Q-
 GWxoKDCPhr4jtsjDfNbi5iEC60oItftNDrq&wd=&eqid=a8f54561000288fa000000065dde4d0d
Lebanon 2017 https://www.baidu.com/link?url=QwFd6ucKLE1mninPyMm639hyBJWZhYckqZHmcvIX8HLO665yVpOTcoq3D1a18n4Z
 _NgBYKmIdaogm-2c8wYkSa&wd=&eqid=e1455fed0001bca1000000065dde31b3
Macedonia, 2015 https://www.baidu.com/link?url=xTtW4xjQVf80jsY0XozgksE1QPGgDsW4TO8vMUjmz7fwMaSUdW4pVU0YYPgVzPan
FYR IIh1ttZEtZRnlzm9S0V4Uq&wd=&eqid=f1ad3737000336ec000000065dde4d30
Malawi N.A.
Malaysia 2015 https://www.baidu.com/link?url=ek2op9k3tjrDnMjkJ9qNQIa6ox1WoAdMdzAIy3vb8MdIg5gaa1KbgCzgA3_fdm_SE1EFk
 Tf2_VLVmEA_dADLeq&wd=&eqid=a47ef08700068b93000000065dde5485
Maldives 2014 http://www.ebrun.com/20170522/231917.shtml
Mongolia 2016 http://www.ebrun.com/20170522/231917.shtml
Montenegro 2017 http://finance.sina.com.cn/roll/2019-08-09/doc-ihytcitm7873343.shtml
Myanmar 2017 http://www.nanhai.org.cn/review_c/291.html
Nepal 2017 https://www.baidu.com/link?url=XrRVArV4oshIzXWvpuGlDRwLq2UznNZH_cJOJU4KQz6_QRUzXyAKBmImH4onYO
 T1nPK-ZX0F8Q_1GuSjyUvo3keUoBnIPxXtjgbJTljfEs3&wd=&eqid=be07c28000055581000000065dde5597
Nigeria 2018 http://special.chinadevelopment.com.cn/2018zt/zflt/2018/09/1348183.shtml
Oman 2018 https://www.baidu.com/link?url=MJpMc1KzrHukDgsJmzaoeME0sccFsGqsdL6o8WyyLufw9h3Kc_4X7TGxe5bp7RW1aJi
 dCquUTEDrl_-CfudJq_O7x5INbTEoTU7UyLzg-RC&wd=&eqid=ecda24460001d6f4000000065dde4923
Pakistan 2015 http://dy.163.com/v2/article/detail/EDNN11L50538107F.html
Philippines 2018 https://www.baidu.com/link?url=XfWRpXTsGPUWwYKbnHu9uFEPIXKVbWBOG1W4yzKD8i9oiLlNQg2az2S5Burb6V
 5l&wd=&eqid=f9a763e40004d967000000065dde3458

 21
Romania 2015 https://www.baidu.com/link?url=zuYLez9JDuyS3Pmb9MWuIwnh13iifzWfUHYdXJuH7XkGnVDPM08hN7ix36hpwVudb
 nIxHp3GWbAzEt0hZr-
 GfBfqGZZwfWeUaTmvrXwShimu_qsiDYn3KVOrb26yccd7&wd=&eqid=bd488c660007cba7000000065dde3b7a
Russia 2015 https://www.baidu.com/link?url=Z7yrihrARc9WZjGK_A8OCAeU82qvK7tkd0Xbr0ElK-
 msIJnsfcVUTlm5KG48BOD6XKCnm2E-EHpizIEvXIE-
 9HkYOGlyRRO9SeNqgcq12oy&wd=&eqid=a3b2178e0000d426000000065dde4181
Serbia 2015 http://www.chinanews.com/tp/hd2011/2015/11-26/585506.shtml
South Sudan 2018 http://special.chinadevelopment.com.cn/2018zt/zflt/2018/09/1348183.shtml
Sri Lanka 2017 https://www.baidu.com/link?url=Gr6F23BtFzejCinPL1v6X4o2vNR61fsqjarr--dnXKPHFdebJdR4C0kB-
 adBzgjYDbckkHEbyfWRl0xiNf1UuoEtv_f9CYlM8LGuxEYTNka&wd=&eqid=85f91dbb000531cf000000065dde39a0
Sudan 2018 http://m.haiwainet.cn/middle/3542291/2018/0716/content_31353989_1.html
Tajikistan 2015 https://www.baidu.com/link?url=4BDYsida3IwQuIgXuoeGJ_Lz0kD1LEBOWKjZRw8szIdvNshnq8CB-x_Qo--
 NlxRH&wd=&eqid=fb85773f0003171d000000065dde4f2a
Tonga 2018 http://sputniknews.cn/politics/201811181026869322/
Turkey 2015 https://www.baidu.com/link?url=sU7LiD9NyPaDoZSAMPSdRScyPXBbLEPpTcMIY8S55_URmUb4J92Tde_R1D6_VTR
 AQc-JAeZxWJFNvQWzQfK16BlpoRlT6kBlqmRHSZmdLKK&wd=&eqid=d3796e600008d3e5000000065dde4026
Turkmenistan 2015 http://www.scio.gov.cn/m/31773/35507/35515/35523/Document/1625566/1625566.htm
Ukraine 2014 https://www.baidu.com/link?url=5MYTGGoXKxyiCF7MEGlpVKZFrWnOh4-
 62GoqS4PNwBexqrl8q_L9Gwg4VFbSpz69&wd=&eqid=c328310a0004696d000000065dde5707
Uzbekistan 2015 https://www.baidu.com/link?url=SOSCA3A7QpEU5uvwcA2sZ127LraXljI99DtF7bZ7PDLt8Qn4subXf8T92qhYVg8V34Dr
 hPgS6rdG20G7JQazvKUD9gW_By4VzIA22ZVfPxYjgUCzRAZXTJHTo4peEZZF&wd=&eqid=e372ea5b000b9a0b00000
 0065dde5291
Vietnam 2017 https://www.baidu.com/link?url=qzFsJP2xwugHNkaPJJbePsKrIAV9h5jSbEBRzp_fi6rqfKNCg7XHYs37FHrIX7unWMzQl
 4bOJNfV-mI4QTArHZjpRetvYW-3YHH91CALP9e&wd=&eqid=f499a51a000563e2000000065dde3a83
Yemen, Rep. 2019 http://finance.sina.com.cn/roll/2019-04-28/doc-ihvhiewr8617644.shtml

 22
You can also read