The differing role of weather systems in southern Australian rainfall between 1979-1996 and 1997-2015
←
→
Page content transcription
If your browser does not render page correctly, please read the page content below
Climate Dynamics (2021) 56:2289–2302
https://doi.org/10.1007/s00382-020-05588-6

The differing role of weather systems in southern Australian rainfall
between 1979–1996 and 1997–2015
Acacia S. Pepler1       · Andrew J. Dowdy1 · Pandora Hope1

Received: 8 June 2020 / Accepted: 14 December 2020 / Published online: 2 January 2021
© Crown 2021

Abstract
Most of the rainfall in southern Australia is associated with cyclones, cold fronts, and thunderstorms, and cases when these
weather systems co-occur are particularly likely to cause extreme rainfall. Rainfall declines in some parts of southern Aus-
tralia during the cool half of the year in recent decades have previously been attributed to decreases in the rainfall from fronts
and/or cyclones, while thunderstorm-related rainfall has been observed to increase, particularly in the warm half of the year.
However, the co-occurrence of these systems, particularly the co-occurrence of cyclones or fronts with thunderstorms, can
be very important for rainfall in some areas, particularly heavy rainfall, and changes in the frequency of these combined
weather systems have not been previously assessed. In this paper we show that the majority of the observed cool season
rainfall decline between 1979–1996 and 1997–2015 in southeast Australia is associated with a decrease in the frequency of
fronts and cyclones that produce rainfall, while there has simultaneously been an increase in the frequency of cold fronts
and thunderstorms that do not produce rainfall in some regions. Thunderstorm rainfall has increased in much of southern
Australia, particularly during the warm half of the year, including an increase in rainfall where a thunderstorm environment
occurs at the same time as a cyclone or front.

Keywords Cyclone · Front · Thunderstorm · Change · Australia · Midlatitude

1 Introduction                                                             southeast Australia (Murphy and Timbal 2008; Timbal and
                                                                           Drosdowsky 2013). These declines have previously been
Southern Australia is located at the equatorward edge of the               attributed to a number of causes, including a long-term
midlatitude storm tracks, where annual rainfall is dominated               intensification of the subtropical ridge (Timbal and Dros-
by the passage of rain-bearing fronts and cut off lows, par-               dowsky 2013) and poleward expansion of the Hadley Cell
ticularly during the cooler months of the year (Pook et al.                (Nguyen et al. 2015) as well as an increase in the propor-
2011, 2014; Risbey et al. 2009). Thunderstorms are also                    tion of the time influenced by anticyclonic conditions in the
important for rainfall in this region, particularly during the             southeast (Pepler et al. 2019). Increasing levels of atmos-
warmer months, as well as the cooler months in parts of the                pheric greenhouse gases have contributed to changes in
eastern seaboard (Dowdy 2020; Dowdy and Kuleshov 2014),                    Southern Hemisphere circulation including the intensifying
and the co-occurrence of fronts, cyclones and thunderstorms                subtropical ridge, playing a role in recent rainfall declines in
is particularly important for the most extreme rainfall totals             southeast Australia (Rauniyar and Power 2020; Timbal et al.
(Dowdy and Catto 2017; Pepler et al. 2020).                                2010) and southwest Australia (Timbal et al. 2006).
   In recent decades, cool season rainfall has declined in                    The contributions of changing synoptic types to rainfall
parts of southern Australia, with large decreases since the                changes has also been investigated for parts of these regions.
late 1960s in southwestern Western Australia (Hope et al.                  Cool season rainfall declines in southeast Australia between
2006) and a significant drought between 1997 and 2009 in                   1956–2009 have been attributed primarily to a decrease in
                                                                           the rainfall arising from cut-off lows, with a smaller propor-
                                                                           tion of the decline arising from a decrease in the average
* Acacia S. Pepler                                                         rainfall per frontal system (Risbey et al. 2013a). Fronts were
  acacia.pepler@bom.gov.au                                                 found to play a stronger role in winter rainfall declines in
1
                                                                           southwest Australia (Risbey et al. 2013b), although there
    Australian Bureau of Meteorology, Melbourne, Australia

                                                                                                                                13
                                                                                                                           Vol.:(0123456789)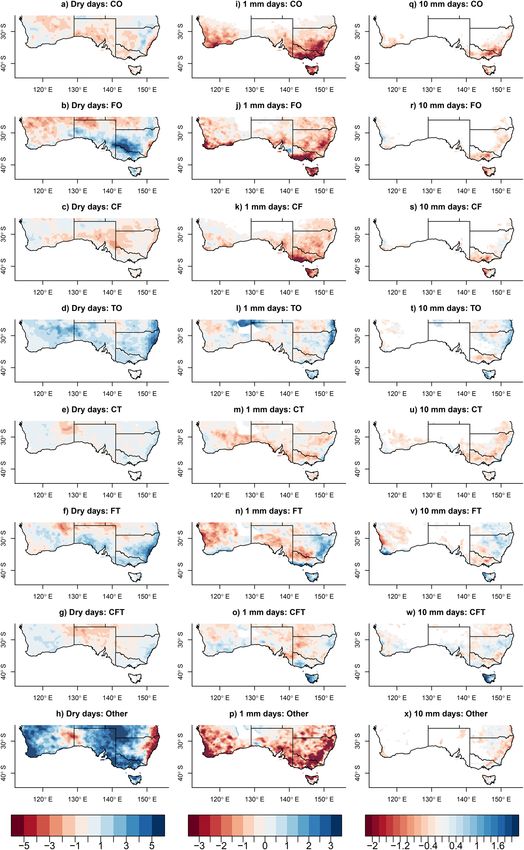
2290                                                                                                              A. S. Pepler et al.

are no statistically significant trends in frontal frequency in       Cyclone centres were identified using the University
either western Australia (Hope et al. 2014) or the Southern       of Melbourne cyclone identification and tracking scheme
Hemisphere (Rudeva and Simmonds 2015). While these                (Murray and Simmonds 1991; Simmonds et al. 1999), and
studies have provided useful insights into the synoptic sys-      cyclone areas enclosed within a closed contour were identi-
tems influencing rainfall change, they typically classified       fied using the Wernli and Schwierz (2006) method. These
events into either a front or a cut-off low, and have not con-    are combined to give a dataset of "Confirmed cyclones",
sidered cases when these systems co-occur, which can lead         where a cyclone region contains a cyclone centre identified
to more significant impacts (Dowdy and Catto 2017).               using the Murray and Simmonds (1991) method. A 5° radius
   Thunderstorms also make an important contribution to           of influence is then added to capture all rainfall associated
rainfall in southern Australia, particularly during the warmer    with the cyclone, which is slightly larger than the 3° area
months. Dowdy (2020) identified significant increases over        used in Dowdy and Catto (2017) but was chosen in order
recent decades in convection-related rainfall through many        to capture all rain associated with the cyclone region based
parts of Australia, including large increases in the intensity    on previous composite studies (e.g. Hawcroft et al. 2012).
of rainfall per thunderstorm. Additionally, that paper also       The Murray and Simmonds (1991) method is also used to
indicated an increase in southeast Australia in the frequency     identify surface anticyclones, with a 10° area of influence.
of thunderstorms that produce little rainfall (‘dry thunder-          We also use two distinct datasets of cold fronts, also run
storms’), (Dowdy and Mills 2012). An increase in atmos-           using ERAI. The approach of Simmonds et al. (2012) and
pheric moisture associated with the observed warming trend        Rudeva and Simmonds (2015) approach identified cold
has also been associated with an increase in the frequency        fronts based on a shift in the 10 m wind direction from a
of thunderstorm-related extreme rainfall, which is expected       northwesterly to southwesterly quadrant. Cold and warm
to continue into the future (Barbero et al. 2018; Guerreiro       fronts are also identified using the thermal front parameter
et al. 2018; Osburn et al. 2020).                                 calculated from the ERAI 850 hPa wet bulb potential tem-
   A new dataset of the synoptic systems influencing Aus-         perature (Berry et al. 2011; Catto et al. 2012a). A 5° radius
tralian weather has recently been developed for 1979–2015         of influence is added to all fronts to identify front-related
(Pepler et al. 2020), which objectively identifies the occur-     rainfall, consistent with similar studies (Catto et al. 2012a;
rence of cyclones, cold fronts, thunderstorms, as well as         Dowdy and Catto 2017), with “Confirmed cold fronts” iden-
when multiple systems co-occur. Using this dataset, we can        tified where the areas detected using both cold front methods
assess how changes in cyclones, cold fronts, thunderstorms,       overlap.
as well as their interactions, have contributed to changes            We also employ a new dataset of thunderstorm environ-
in southern Australian rainfall between 1979 and 2015. In         ments for Australia (Dowdy 2020). This dataset is based on
addition, we decompose the change in rainfall from each           the thunderstorm parameter (CAPE*S061.67) as calculated
weather type to the change in rainfall arising from changes       from the ERAI convective available potential energy (CAPE;
in the frequency and the intensity of the system, allowing        using the most unstable level based on maximum equivalent
us to identify which factors are most important for different     potential temperature) and bulk wind shear from 0–6 km
seasons and regions in southern Australia.                        (S06). The dataset was calibrated against two observed
                                                                  lightning products to identify local thresholds that give the
                                                                  same annual thunderstorm frequency as observed. Appli-
2 Data                                                           cation of the method to every 0.05° grid cell throughout
                                                                  Australia between 2005 and 2015 results in a Probability
The weather types dataset used here is described in detail        of Detection of approximately 50% in identifying observed
in Pepler et al. (2020), and is based on the approach used in     lightning events. The False Alarm Ratio and the fraction of
Dowdy and Catto (2017). Briefly, we combine two datasets          missed lightning events from the total number of lightning
of cyclone tracks, each of which were run for 1979–2015           events are also approximately 50% across Australia, not-
using 6-hourly 0.75° MSLP fields from the ERA-Interim             ing that as thunderstorms are small in scale it is common
(ERAI) reanalysis (Dee et al. 2011). While this is an older       for only small parts of a region to experience lighting even
reanalysis, which has now been superseded by the higher-          when conditions are favourable. These verification statistics
resolution ERA5 reanalysis (Hersbach et al. 2020), the new        as detailed in Dowdy (2020) demonstrate that this dataset of
reanalysis was not available when the component datasets          thunderstorm environments performs well against observa-
were developed. This paper focuses on results for Australia       tions. While thunderstorm environments are most common
south of 25° S, as the methods used for identifying cyclones      in the warmer months, they can occur at any time of year,
and fronts are more effective at identifying midlatitude          with wind shear playing a larger role in some low-CAPE
weather systems than they are in the tropics (Pepler et al.       environments during the cooler months of the year (Dowdy
2020).                                                            et al. 2020).

13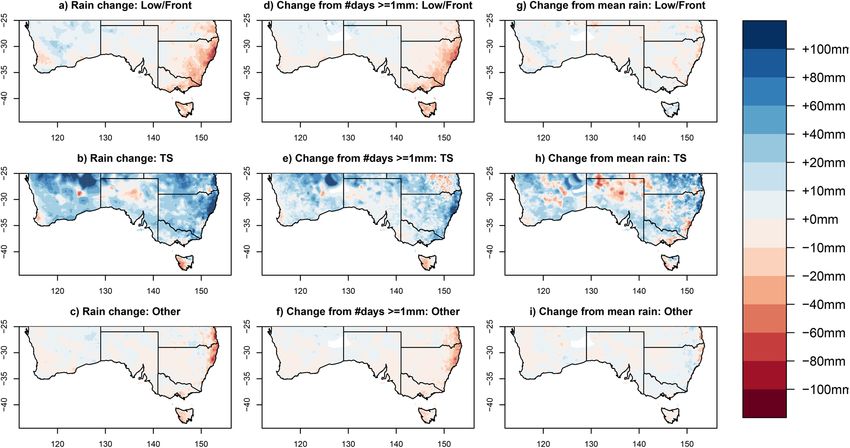
The differing role of weather systems in southern Australian rainfall between 1979–1996 and…                                            2291

    These four datasets are combined to create a 6-hourly,                 of the combined weather types, which results in a general
0.75° resolution grid across Australia that classifies each                increase in the frequency of the combined weather types
point into one of eight categories (Table 1), with a focus on              and a decrease in undefined days, although the overall spa-
the intersections between cyclones, fronts and thunderstorms               tial characteristics for each type are similar to those using
following the approach of Dowdy and Catto (2017). In this                  6-hourly data (Pepler et al. 2020).
study, the co-occurrence of a cyclone and front (CF) requires                  The rainfall recorded at 9 a.m. local time (~ 2300 UTC) at
a gridpoint to have been influenced by both a cyclone area                 each gridpoint is then attributed to the nearest weather type
and a front area on the same day; the front-only and front-                from the ERAI gridded data, which is identified by convert-
thunderstorm types will in many cases be trailing fronts                   ing each weather type to a 0/1 flag and bilinearly regridding
associated with an extratropical cyclone on the poleward                   to the AWAP resolution. This allows us to identify important
side, as is common in the extratropical storm tracks (Bjerk-               spatial features of rainfall, such as the influence of topog-
nes and Solberg 1922).                                                     raphy, while linking local rainfall to broader-scale synoptic
    The seven main weather types collectively explain 91% of               patterns.
total rainfall in southern Australia (Pepler et al. 2020), not-                Assessing change can be achieved by examining trends,
ing that there are a large number of different ways of iden-               however, given that the breadth of weather types reduces the
tifying weather systems that will overlap between studies.                 number of events in each type, a comparison of two periods
For instance, the methods used in this paper may incorrectly               will be more robust. The period from 1979–2015 divides
identify a low pressure trough as a cold front, and many cold              at 1996/7 into two periods of 18 and 19 years. The year
fronts may be associated with other systems such as atmos-                 1997 also aligns with a further downturn in rainfall in the
pheric rivers and Northwest Cloudbands (Reid et al. 2019).                 late 1990s in south-west Western Australia and the start of
Similarly, many surface lows will also be associated with a                the Millennium Drought in south-east Australia, which is
strong upper-level system such as a cut-off low, particularly              considered by some to have ended with the 2010–2012 La
those which produce heavy rainfall (Dowdy et al. 2013; Pep-                Niña but by others to continue into the present (Rauniyar
ler and Dowdy 2020; Pook et al. 2006), and warm conveyer                   and Power 2020). We thus assess the changes in rainfall
belts can play an important role in the generation of rainfall             and weather systems between 1979–1996 and 1997–2015,
from fronts and cyclones (Catto et al. 2015; Madonna et al.                and identify statistically significant changes using a two-
2014). The “Other” category can be further subdivided into                 sided Student’s t test for p < 0.05. To check the robustness
days with high pressure systems (H), warm fronts (WF),                     of results to this choice of start year, in some cases we add
cyclones or fronts that are identified by a single method                  additional comparisons by instead dividing at 1995/1996,
(Unconf), and remaining undefined days (Undef), resulting                  1997/1998, or comparing the period 1980–1999 with
in a total of 11 types.                                                    2000–2015. These make little difference to results for SEA
    Rainfall analyses use the Australian Water Availability                and SWWA which have experienced strong cool season
Product (AWAP) daily rainfall grids for Australia at 0.05°                 declines, but the choice of start year is more important for
resolution (Jones et al. 2009). Note that data in the central              trends in smaller regions such as Tasmania (TAS) and the
north-west of the country has few stations contributing to                 Eastern Seaboard (ESB).
the gridded product, and results can be less reliable in that                  The changes seen in Australian rainfall over the last few
region (King et al. 2013). Each synoptic system dataset is                 decades are quite different in the cool season compared to
first aggregated across the four observations at 0000, 0600,               the warm season in many places (Bates et al. 2008; Hope
1200 and 1800 UTC before regenerating a daily version                      et al. 2017), and thus two six month seasons (May–October

Table 1  Description of weather      Name       Long name                   Description
types used in this paper,
following Dowdy and Catto            CO         Cyclone-only                A cyclone/low is present in both datasets
(2017)
                                     FO         Front-only                  A cold front is present in both datasets
                                     TO         Thunderstorm-only           A thunderstorm environment is present
                                     CF         Cyclone-Front               Both a cyclone and a cold front are present
                                     CT         Cyclone-Thunderstorm        Both a cyclone and a thunderstorm environment are present
                                     FT         Front-thunderstorm          Both a cold front and a thunderstorm environment are present
                                     CFT        Triple storm                A cyclone, cold front, and thunderstorm are all present
                                     Other      Other                       Days with Highs (H), Warm Fronts (WF), Fronts or Lows identi-
                                                                             fied by only one method (Unconf) and when no weather system is
                                                                             defined (Undef)

                                                                                                                                 13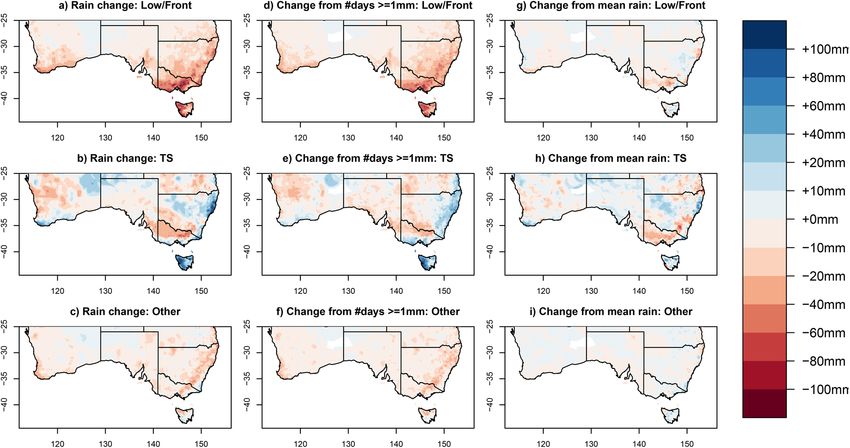
2292 A. S. Pepler et al.
and November–April) are considered in this study. Results days where at least 1 mm of rainfall is recorded, as at least
are broadly comparable if we instead define the cool sea- 95% of annual rainfall falls on these days. This allows us to
son as April-September or April–October (not shown). As distinguish the changes in the overall frequency of weather
well as showing spatial changes, we also show changes for systems from changes in the number of rain days associated
four key regions (Fig. 1): southwestern Western Australia with a given system, as these trends can differ. In addition,
(SWWA) and southeast Australia (SEA), which have expe- we separately assess changes in the number of dry days
rienced long-term cool season rainfall declines (Hope et al. (< 1 mm), rain days (all days ≥ 1 mm) and moderate rainfall
2006; Rauniyar and Power 2020; Timbal et al. 2006, 2010); days (> = 10 mm) associated with each weather type. The
the eastern seaboard (ESB), where rainfall influences and gridded rainfall data is considered adequate for examining
trends differ from elsewhere in SEA (Dowdy et al. 2015; moderate rainfall extremes of this nature (King et al. 2013).
Pepler et al. 2014; Timbal 2010), and Tasmania, which is
located in the main midlatitude storm tracks with distinctly
different projected future changes (Hope et al. 2015). 3 Results
The change in rainfall from each weather type can be
further decomposed into the change resulting from a change Figure 1 shows the change in the average rainfall for each
in the overall weather-type frequency (Δf), and the change season between 1979–1996 and 1997–2015. Broadly, rain-
resulting from a change in the average rainfall per system fall has declined across much of southern mainland Aus-
(Δr) (e.g. Hassim and Timbal 2019). The rainfall change tralia during the cool season (May–October), and rainfall
due to a change in frequency of a given weather type can has increased in the northern tropics during the warm season
be calculated as r 1 × Δf: the multiple of the absolute change (November–April). Averaged across four regions of inter-
in the seasonal mean number of days (Δf) and the average est in southern Australia, there is a statistically significant
rainfall expected per day for that weather type during the decline of 50 mm (16%) in southeast Australia (SEA) during
first period (r1). The difference between this and the total the cool season. There is also a decline in cool season rain
change is considered to arise from changes in the mean rain- in SWWA of 28 mm (9%, p = 0.09), predominantly due to
fall per weather system, noting that these two components a 31 mm (16%) decline during May–July (p = 0.01), not-
can have opposite signs in some cases. This is a simplified ing that our period of analysis begins after rainfall declines
version of the approach used in Catto et al. (2012b), as the in SWWA first began in the 1960s (Hope et al. 2010). In
contribution to rainfall declines arising from the interaction comparison to elsewhere in southern Australia, there is lit-
between frequency and intensity is very small compared to tle change between the two periods in Tasmania (TAS) or
the other two terms. averaged across the eastern seaboard (ESB).
These two components are first calculated both across all During the warm season (November–April) there have
days with a weather type, which includes some days with been large increases in rainfall across northern Australia,
no rainfall. We also repeat this process for just the subset of which extends into much of mainland southern Australia, as
Fig. 1 May–October (cool season: left) and November–April (warm season: right) rainfall change (in mm) between 1979–1996 and 1997–2015
for Australia, with four regions of interest marked with coloured contours
13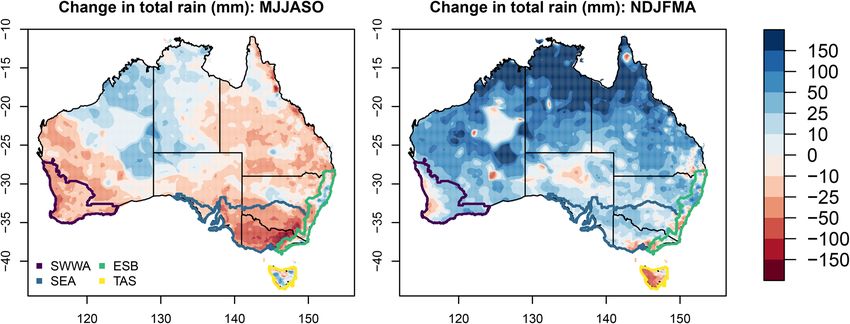
The differing role of weather systems in southern Australian rainfall between 1979–1996 and…                                            2293

well as decreases in rainfall in Tasmania, although changes                total rainfall associated with these types (p < 0.01), which
are not statistically significant in any of our four subregions.           is statistically significant for all start years. This is due to a
                                                                           decrease in both the frequency and the intensity of CO days,
3.1 May–October rainfall change                                           while the change in frontal rain is dominated by a decrease
                                                                           in intensity. SEA also recorded a decrease in the intensity of
The decline in total May–October rainfall across southern                  rainfall on Other days (Fig. 3), primarily due to a decrease
Australia can be separated into the rainfall associated with               in the average rainfall on days with high pressure systems
each of the 11 weather types (Fig. 2). There is a widespread               (not shown). There is no statistically significant change in
decrease in cool season rainfall associated with cyclones                  thunderstorm-related rainfall in SEA during this season.
and fronts (CO, FO and CF), with a decline in CT rainfall                      In SWWA there is a statistically significant decrease in
on the Great Dividing Range near the east coast and much                   rain from the CO type, predominantly due to a decrease in
of inland southeast Australia contrasting with pockets of                  the mean rainfall per CO day, but smaller declines in front-
increases along the coastline. In contrast, changes in cool                related types FO and CF during this period. SWWA also
season thunderstorm-related rainfall are mixed, with some                  has a decrease in Other rainfall, driven by a decrease in the
areas of increases in rainfall from TO, FT and CFT types,                  rainfall intensity on Other days.
particularly in the east and Tasmania. The total rainfall from                 The ESB and Tasmania also have decreases in non-
the four other types is generally small (Pepler et al. 2020),              thunderstorm rainfall (CO, FO and CF) in recent decades,
with the highest contribution to seasonal rainfall arising                 associated with both a change in frequency and intensity.
from high pressure systems, which produce 6% of rainfall                   The decline in total rainfall from these three weather types
in Australia south of 25° S. This is a consequence of the very             between 1979–1996 and 1997–2015 is 25% in the ESB
large frequency of high pressure systems during this season                (p < 0.01), which is robust to the choice of start year. There
(33% of days), as their mean daily rainfall is the smallest of             is a weaker 14% decline in rainfall from these systems in
any weather type, with rainfall typically only recorded in the             Tasmania (p = 0.04), which is not statistically significant
outer edges of the high, particularly in cases where the high              if we choose different time periods (e.g. 1980–1999 vs
is small or directs moist onshore winds into coastal regions.              2000–2015). Declines in these regions are balanced by an
The overall changes in rainfall from these four types are                  increase in rainfall associated with thunderstorms, although
correspondingly small (Fig. 2h–k). Consequently, the major-                this is generally not statistically significant, so there is no
ity of the paper will focus on the seven main rain-bearing                 significant change in the total seasonal rainfall. Interestingly,
weather types, with the other four types clustered together                there has been little change in the total number of cyclones
and termed ‘Other’.                                                        and fronts in either region, but the proportion of those days
    Aggregated across SEA, there are statistically signifi-                which are also associated with thunderstorms has increased.
cant declines in the rainfall from CO, FO and CF-related                   In Tasmania the number of CFT days has increased from 7 to
types in the cool season (Fig. 3), with a 27% decline in the               9.2 days per season, resulting in a 36% increase in CFT rain,

Fig. 2  May–October rainfall change (in mm) between 1979–1996 and 1997–2015 for the 11 weather types

                                                                                                                                 13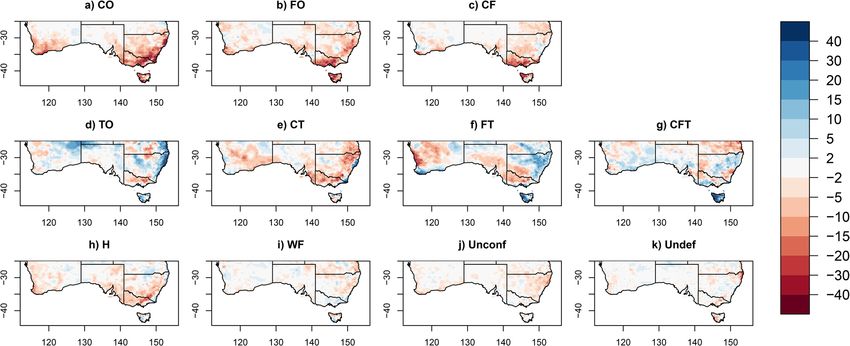
2294 A. S. Pepler et al.
noting that CFT events have the highest average daily rain- Fig. 4 Change in the average number of days of each weather type in ▸
fall of any weather type in this season (Pepler et al. 2020). May–October between 1979–1996 and 1997–2015 separated by rain-
fall rate: < 1 mm rainfall (left), ≥ 1 mm of rainfall (middle), ≥ 10 mm
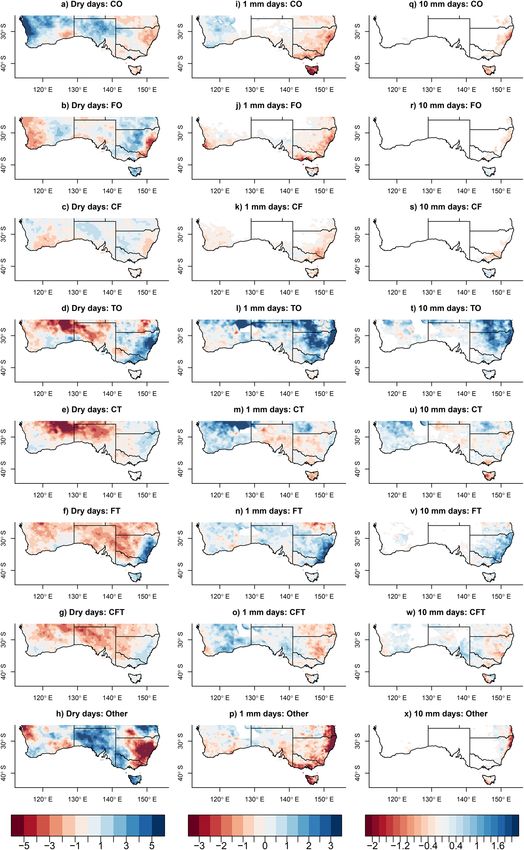
Figure 4 shows, for each weather type, the change in the of rainfall (right). Colours are only shown where there is an average
number of dry days (rainfall < 1 mm) as well as the num- of at least 0.2 days/year in the 1979–1996 period, and 0.25° of spatial
ber of wet days (> = 1 mm) and days with at least 10 mm smoothing has been added to make spatial patterns clearer
of rainfall. Consistent with previous studies, there are large
decreases in the number of CO, FO and CF days that pro-
duce at least 1 mm of rain across most of southern Australia The stark difference in change in dry vs wet days for
(Fig. 4i–k), with parts of the southeast experiencing more the front-related systems in Fig. 4b, j raises the question
than 10 fewer rain days per year arising from these three of whether the apparent decrease in the rainfall intensity
weather types. Averaged across SEA there are 8.1 fewer rain of fronts and cyclones was primarily due to a decrease in
days per season in recent decades, including 4.7 fewer rain the likelihood of a system producing rainfall, rather than
days from the CO, FO and CF weather types, as well as a the intensity of rainfall events. To assess this, in Fig. 5 we
decrease in rain days from Other systems. There are also show the rainfall change separated into the proportion due
broad declines in the frequency of days with at least 10 mm to changes in the frequency of rain days from a weather
of rain associated with these weather types (Fig. 4q–s), par- system and the average rainfall intensity if rainfall occurs.
ticularly in Victoria and western Tasmania, although these Using this approach, the majority of the observed rainfall
changes are not statistically significant. Interestingly, in SEA declines across southern Australia can be seen to result from
there is an increase in the total number of FO days despite a decrease in the frequency of cyclones and fronts that pro-
a statistically significant 17% decrease in the number of FO duce at least 1 mm of rain (Fig. 5d), with much weaker and
days with rainfall, due to an increase in the number of FO more inconsistent changes in the average rain rate across all
days with no rainfall (Fig. 4b). rain days. The weak increases in rainfall on the east coast
Thunderstorms are less common during the cool season, from thunderstorms (TO and FT) are also primarily due to
but most of southern Australia has seen an increase in the an increase in the frequency of thunderstorms associated
number of TO and FT days with rainfall totals below 1 mm with rainfall (Fig. 5h), although there is an increase in the
(Fig. 4d, f). Changes in thunderstorms associated with rain- mean rainfall on thunderstorm days on parts of the east
fall are less spatially coherent, but there are indications of coast, particularly TO days (not shown).
an increase in TO and FT rain days on parts of the south and
east coasts (Fig. 4l, n), as well as an increase in CFT days 3.2 November–April rainfall change
associated with rainfall in Tasmania (Fig. 4o), but decreases
in these types further inland. Spatial patterns of changes During November–April, there is an increase in total rainfall
in 10 mm days and 25 mm days (not shown) are broadly across southern mainland Australia and a decrease in Tasma-
consistent with 1 mm days, with parts of western Tasmania nia (Fig. 1b), but the changes in total rainfall during this season
experiencing one additional CFT day with at least 10 mm of are not statistically significant for any of our four subregions
rainfall per year in the recent period.
40
CO CF CT CFT Frequency Intensity
FO TO FT Other *
30
Difference in rain (mm)
20
*
10
*
0
−10
* * * *
* *
*
−20
SEA SWWA ESB TAS
Fig. 3 Change (mm) in average May–October rainfall between 1979– the change in frequency and lighter colours indicate the component
1996 and 1997–2015 for the four regions indicated in Fig. 1, sepa- from the change in rain rate, noting that where these oppose the total
rated into the seven main weather types and Other days. Darker shad- change is smaller. Changes with an asterisk (*) are statistically sig-
ing indicates the portion of the change that would be expected from nificant for p < 0.05 using a two-tailed t test
13The differing role of weather systems in southern Australian rainfall between 1979–1996 and… 2295
132296 A. S. Pepler et al.
Fig. 5 May–October rainfall change (in mm) between 1979–1996 and for the combined cyclone and front types (CO/FO/CF, top), thunder-
1997–2015 (left column), and the change divided into components storm-related rainfall (TO/CT/FT/ CFT, middle) and Other rain (bot-
from the change in the frequency of 1 mm days (central), and from tom)
change in average rain rate on those days (right). Results are shown
40
CO CF CT CFT Frequency Intensity
FO TO FT Other
30
*
Difference in rain (mm)
20
10
0
−10
* *
*
−20
*
SEA SWWA ESB TAS
Fig. 6 Change (mm) in average November–April rainfall between lighter colours indicate the component from the change in rain rate,
1979–1996 and 1997–2015 for the four regions indicated in Fig. 1, noting that where these oppose the total change is smaller. Changes
separated into weather types. Darker shading indicates the portion of with an asterisk (*) are statistically significant for p < 0.05 using a
the change that would be expected from the change in frequency and two-tailed t test
using a t test. On the ESB, there is a statistically significant comparing 1980–1999 and 2000–2015 (+ 23%). In contrast,
37% decline in non-thunderstorm (CO, FO and CF) rainfall, in Tasmania there is a 13% decrease in cyclone-related rain-
but this is balanced by a statistically significant 18% increase fall during the warm season, particularly due to a decrease
in all thunderstorm-related rainfall, predominantly due to in rainfall from CO and CT days, but this is not statistically
increases in the frequency of TO and FT days (Fig. 6). These significant. Increases in the intensity of thunderstorm-related
differences are statistically significant for all start years, and rainfall are also observed in SEA and SWWA, and increases
the increase in thunderstorm-related rainfall is larger when in the intensity of cyclone-related rainfall in SWWA, although
13The differing role of weather systems in southern Australian rainfall between 1979–1996 and… 2297
these are not statistically significant, noting that warm season lows, and one third of the decline to a decrease in the rain-
rainfall is lower in these regions. fall arising from cold fronts. Although this study identifies
Consistent with results for the cool season, there is a cyclones at the surface, those cyclones with the heaviest
decrease in the number of CO, FO and CF days associ- rainfall are likely to be associated with upper level cyclones
ated with rainfall across much of southern Australia dur- such as cut-off lows, and further research will investigate
ing November–April (Fig. 7i–k). However, these weather the role of upper-level systems in declining cyclone rainfall
systems make a smaller contribution to total rainfall dur- in more detail.
ing the warm season, where declines in rain days associated Using computer-assisted methods to identify weather
with these weather systems are balanced by increases in the types over a long period of time allows for broad-scale stud-
number of rain days from TO and FT weather types (Fig. 7l, ies such as this one. To assess the robustness of our results,
n), so there are no significant changes in the total number we briefly compared our results with the weather types as
of rain days in SEA, SWWA or ESB. Large areas of the identified by a trained synoptician on days with heavy rain-
east also have 2 or more additional days where a TO or FT fall at a particular location in western Victoria (35.92° S,
produces at least 10 mm of rainfall during recent decades 142.85° E) for the common period 1979–2009 (Pook et al.
(Fig. 7t, v), with on average 1.9 extra thunderstorm-related 2006; Risbey et al. 2009, 2013a, b). Although this study
days with more than 10 mm of rainfall on the ESB in recent identifies cyclones at the surface, those cyclones with the
decades (p = 0.03). This is consistent with results from heaviest rainfall are likely to be associated with upper level
Dowdy (2020), as well as observations of an increase in cyclones such as cut-off lows. For days with at least 10 mm
the frequency of extreme rainfall across southern Australia of rainfall, 85% of the manually defined cut-off lows are
(Osburn et al. 2020). However, as the ESB also experienced associated with a low pressure system in our dataset, espe-
a decrease in heavy rain events from cyclones and fronts, cially lows with a thunderstorm (CT/CFT, 62%). Similarly,
the overall change in days with at least 10 mm of rain is not 84% of their frontal waves/fronts are identified here as a
statistically significant (+ 0.6 days). cold front, particularly a front combined with a thunderstorm
Consistent with Dowdy (2020), during the warm season (FT, 47%). This brief comparison provides further confi-
we see strong increases in the frequency of dry thunder- dence in the methods described here to faithfully represent
storms (notably TO and FT) across much of the southeast these weather systems. Further research will investigate the
(Fig. 7d–g), particularly in the ESB, which can be a risk role of upper-level systems in declining cyclone rainfall in
factor for bushfire ignition. There are also increases in the more detail.
frequency of cold fronts that do not produce rainfall (FO and Consistent with global studies we found little change in
CF) in inland areas of SEA (Fig. 7b, c). the total frequency of cold fronts (Rudeva and Simmonds
When we combine all thunderstorm-related types (Fig. 8), 2015), with a decrease in the frequency of rain-bearing
there is an increase in thunderstorm-related rainfall across fronts but an increase in the frequency of dry fronts in parts
most of mainland southern Australia during the warm sea- of southeastern Australia. There is also a statistically signifi-
son, and this is a result of both an increase in the number cant decrease in the average rainfall from high pressure sys-
of thunderstorm days associated with rainfall, as well as tems, consistent with the longer-term declines in anticyclone
an increase in the average rainfall on thunderstorm days in frequency shown in Pepler et al. (2019); however, the overall
many locations. In comparison, there is a decrease in rainfall contribution of highs to rainfall changes are smaller in this
from cyclones and fronts in the ESB and Tasmania, which paper, as the change in the relative proportion of anticyclone
is due to a decrease in the number of rain days from these vs non-anticyclone days has been captured by the decreased
weather systems rather than any change in intensity. frequency of other weather systems we analyse.
Changes in cool season rainfall on the ESB and in Tas-
mania are weaker than elsewhere in southeast Australia (e.g.
4 Discussion and conclusions Fig. 1). While these regions have similar declines in cyclone
and front-related rainfall to areas elsewhere in southeast
In southeast Australia, average cool season rainfall declined Australia, there is a simultaneous increase in cool-season
by 50 mm (16%) between 1979–1996 and 1997–2015. This rainfall associated with thunderstorms, consistent with
decline is predominantly due to a decrease in rainfall from results presented by Dowdy (2020). As well as an increase
fronts and cyclones, and in particular a decrease in the fre- in the number of thunderstorm-only days that produce rain-
quency of cyclones and fronts that produce at least 1 mm of fall, there is also an increase in the proportion of cyclones
rain. This is consistent with earlier studies by Risbey et al. and fronts that co-occur with a thunderstorm environment
(2013a), who attributed two-thirds of the decline in cool in these regions, resulting in an increase in rainfall on FT
season rainfall in southeast Australia between 1956 and 2009 and CFT days. Tasmania experienced a particularly strong
to a change in both the frequency and intensity of cut-off increase in CFT days over the period, which are the weather
132298 A. S. Pepler et al. 13
The differing role of weather systems in southern Australian rainfall between 1979–1996 and…                                                2299

◂ Fig. 7  Change in the average number of days of each weather type          southern Australia, particularly from the TO and FT types.
  in November–April between 1979–1996 and 1997–2015 separated                There are also increases in the average rainfall on days with
  by rainfall rate: < 1 mm rainfall (left), ≥ 1 mm of rainfall (mid-
  dle), ≥ 10 mm of rainfall (right). Colours are only shown where there
                                                                             thunderstorms in the warm season across large areas of
  is an average of at least 0.2 days/year in the 1979–1996 period, and       southern Australia, including an increase in the number of
  0.25° of spatial smoothing has been added to make spatial patterns         thunderstorm days that produce at least 10 mm of rainfall.
  clearer                                                                    At the same time, throughout the year we see an increase in
                                                                             the frequency of dry thunderstorms, particularly on the east
  systems most likely to produce heavy rainfall (Pepler et al.               and southeast coasts, consistent with the results presented
  2020; Dowdy and Catto 2017).                                               by Dowdy (2020). This could potentially lead to additional
     Compared to earlier studies (Hope et al. 2006; Pook et al.              bushfire hazards associated with ignitions from dry lightning
  2011), we observed weaker cool season rainfall changes in                  as an important driver for area burnt by wildfires in south-
  SWWA than in SEA, with a statistically significant decline                 east Australia (Dowdy and Mills 2012).
  during May–July but not the longer May–October season.                        Projections from global climate models consistently show
  This may be because the period of SWWA rainfall declines                   a continued future decline in cool season rainfall in both
  begins in the 1960s, prior to the earliest year in our analysis.           SWWA and SEA (Grose et al. 2020; Hope et al. 2015). The
  As in SEA, rainfall declines are attributed to a decline in the            frequency of cyclones is also expected to decline in Aus-
  rainfall from cyclones and fronts, particularly a decline in               tralian latitudes (Grieger et al. 2014; Utsumi et al. 2016),
  the average number of days with a cyclone that produces at                 although projections of all fronts (both cold and warm) are
  least 1 mm of rainfall.                                                    less certain (Catto et al. 2014). In contrast, the frequency
     In contrast to the clearer changes during the cool sea-                 of heavy rainfall is expected to increase (Alexander and
  son, during the warm season November–April rainfall has                    Arblaster 2017), particularly for higher-intensity and short-
  increased in northern Australia, with weak but non-signifi-                duration extremes that are associated with convection and
  cant increases in rainfall in southern Australia. While there              thunderstorms (Westra et al. 2014; Osburn et al. 2020).
  are also declines in cyclone-related rainfall in the southeast             The observed changes shown in this paper are consistent
  during this season, particularly on the ESB, there are larger              with these expected future changes, particularly as we have
  increases in rainfall associated with thunderstorms across                 shown that there can be a decrease in the rainfall due to

  Fig. 8  November–April rainfall change (in mm) between 1979–1996           the average rain rate on those days (right). Results are shown for the
  and 1997–2015 (left column), and the change divided into compo-            combined cyclone and front types (CO/FO/CF, top), thunderstorm-
  nents from the change in frequency (central), and from change in           related rainfall (TO/CT/FT/CFT, middle) and Other rain (bottom)

                                                                                                                                       13
2300 A. S. Pepler et al.
fronts without any change in the total number of fronts in References
southern Australia.
This paper shows changes in weather systems over the Alexander LV, Arblaster JM (2017) Historical and projected trends in
period 1979–2015, which is sufficient to identify significant temperature and precipitation extremes in Australia in observa-
tions and CMIP5. Weather Climate Extremes 15:34–56. https://
recent changes in cool season rainfall, particularly in SEA doi.org/10.1016/j.wace.2017.02.001
which experienced a major drought between 1997–2009 and Barbero R, Westra S, Lenderink G, Fowler HJ (2018) Temperature-
continued below-average cool season rainfall in subsequent extreme precipitation scaling: a two-way causality? Int J Climatol
years. However, the emergence of new high-quality reanaly- 38:e1274–e1279. https://doi.org/10.1002/joc.5370
Bates BC, Hope P, Ryan B, Smith I, Charles S (2008) Key findings
ses such as ERA5 and JRA55, and the upcoming extension from the Indian Ocean Climate Initiative and their impact on
of ERA5 to the period 1950–1978, will enable future work policy development in Australia. Clim Change 89(3–4):339–354.
to assess the robustness of these observed changes to both https://doi.org/10.1007/s10584-007-9390-9
the time periods used and the choice of reanalysis, particu- Berry G, Reeder MJ, Jakob C (2011) A global climatology of
atmospheric fronts. Geophys Res Lett 38:L04809. https://doi.
larly for southwestern Western Australia where rainfall org/10.1029/2010GL046451
declines begin in the late 1960s. Bjerknes J, Solberg H (1922) Life cycle of cyclones and the polar front
theory of atmospheric circulation. Geophys Publ 3:1–18
Acknowledgements The authors would like to thank Bertrand Timbal, Catto JL, Jakob C, Berry G, Nicholls N (2012a) Relating global precip-
Peter van Rensch and two anonymous reviewers for their measured itation to atmospheric fronts. Geophys Res Lett 39(10):L10805.
and insightful internal reviews. We also thank Irina Rudeva and Jen https://doi.org/10.1029/2012GL051736
Catto for their collaboration in developing the weather types dataset, Catto JL, Jakob C, Nicholls N (2012b) The influence of changes in
including providing some of the component cyclone and front datasets, synoptic regimes on north Australian wet season rainfall trends. J
and James Risbey and Michael Pook for additional data and advice Geophys Res Atmos 117(10):1–9. https://doi.org/10.1029/2012J
regarding cut-off lows. All authors were supported by the Victorian D017472
Department of Environment, Land, Water and Planning as part of the Catto JL, Nicholls N, Jakob C, Shelton KL (2014) Atmospheric fronts
Victorian Water and Climate Initiative. in current and future climates. Geophys Res Lett 41(21):7642–
7650. https://doi.org/10.1002/2014GL061943
Funding This project is funded by the Victorian Department of Envi- Catto JL, Madonna E, Joos H, Rudeva I, Simmonds I (2015) Global
ronment, Land, Water and Planning, and was assisted by resources relationship between fronts and warm conveyor belts and the
from the Australian National Computational Infrastructure (NCI). impact on extreme precipitation. J Clim 28(21):8411–8429. https
://doi.org/10.1175/JCLI-D-15-0171.1
Dee DP, Uppala SM, Simmons AJ, Berrisford P, Poli P, Kobayashi S
Code availability The cyclone, front and thunderstorm datasets used et al (2011) The ERA-Interim reanalysis: configuration and per-
in this paper are based on a variety of pre-existing routines which are formance of the data assimilation system. Q J R Meteorol Soc
available by contacting the authors of the papers cited in the Methods 137(656):553–597. https://doi.org/10.1002/qj.828
section. Analysis and figures for this paper were performed using the Dowdy AJ (2020) Climatology of thunderstorms, convective rain-
R programming language. fall and dry lightning environments in Australia. Clim Dyn
54(0123456789):1–12. https: //doi.org/10.1007/s00382 -020-05167
Availability of data ERAI is available from the ECMWF at http://apps. -9
ecmwf.int/datasets/data/interim-full-invariant/, and Australian gridded Dowdy AJ, Catto JL (2017) Extreme weather caused by concurrent
rainfall datasets are available from the Australian Bureau of Meteorol- cyclone, front and thunderstorm occurrences. Sci Rep 7:40359.
ogy. The weather type dataset is available for research use by contact- https://doi.org/10.1038/srep40359
ing the authors, and will be shared for research purposes as an output Dowdy AJ, Kuleshov Y (2014) Climatology of lightning activity in
of the Victorian Water and Climate Initiative. Australia: spatial and seasonal variability. Aust Meteorol Ocean-
ogr J 64(2):103–108
Compliance with ethical standards Dowdy AJ, Mills GA (2012) Atmospheric and fuel moisture char-
acteristics associated with lightning-attributed fires. J Appl
Meteorol Climatol 51(11):2025–2037. https://doi.org/10.1175/
Conflict of interest The authors declare that they have no conflict of JAMC-D-11-0219.1
interest. Dowdy AJ, Mills GA, Timbal B (2013) Large-scale diagnostics of
extratropical cyclogenesis in eastern Australia. Int J Climatol
Open Access This article is licensed under a Creative Commons Attri- 33(10):2318–2327. https://doi.org/10.1002/joc.3599
bution 4.0 International License, which permits use, sharing, adapta- Dowdy AJ, Grose MR, Timbal B, Moise A, Ekstrom M, Bhend J,
tion, distribution and reproduction in any medium or format, as long Wilson L (2015) Rainfall in Australia’s eastern seaboard: a review
as you give appropriate credit to the original author(s) and the source, of confidence in projections based on observations and physical
provide a link to the Creative Commons licence, and indicate if changes processes. Aust Meteorol Oceanogr J 65(1):107–126. https://doi.
were made. The images or other third party material in this article are org/10.22499/2.6501.008
included in the article’s Creative Commons licence, unless indicated Dowdy AJ, Soderholm J, Brook J, Brown A, McGowan H (2020)
otherwise in a credit line to the material. If material is not included in Quantifying hail and lightning risk factors using long-term
the article’s Creative Commons licence and your intended use is not observations around Australia. J Geophys Res Atmos. https://doi.
permitted by statutory regulation or exceeds the permitted use, you will org/10.1029/2020JD033101
need to obtain permission directly from the copyright holder. To view a Grieger J, Leckebusch GC, Donat MG, Schuster M, Ulbrich U (2014)
copy of this licence, visit http://creativecommons.org/licenses/by/4.0/. Southern Hemisphere winter cyclone activity under recent and
13The differing role of weather systems in southern Australian rainfall between 1979–1996 and… 2301
future climate conditions in multi-model AOGCM simulations. Pepler A, Coutts-Smith A, Timbal B (2014) The role of East Coast
Int J Climatol 34(12):3400–3416. https: //doi.org/10.1002/joc.3917 Lows on rainfall patterns and inter-annual variability across the
Grose MR, Narsey S, Delage FP, Dowdy AJ, Bador M, Boschat G et al East Coast of Australia. Int J Climatol 34(4):1011–1021. https://
(2020) Insights from CMIP6 for Australia’s future climate. Earth’s doi.org/10.1002/joc.3741
Future. https://doi.org/10.1029/2019ef001469 Pepler A, Hope P, Dowdy A (2019) Long-term changes in southern
Guerreiro SB, Fowler HJ, Barbero R, Westra S, Lenderink G, Blen- Australian anticyclones and their impacts. Clim Dyn 53:4701–
kinsop S et al (2018) Detection of continental-scale intensifica- 4714. https://doi.org/10.1007/s00382-019-04819-9
tion of hourly rainfall extremes. Nat Clim Change 8(Septem- Pepler AS, Dowdy AJ, van Rensch P, Rudeva I, Catto JL, Hope P
ber):803–808. https://doi.org/10.1038/s41558-018-0245-3 (2020) The contributions of fronts, lows and thunderstorms to
Hassim MEE, Timbal B (2019) Observed rainfall trends over Singapore southern Australian rainfall. Clim Dyn 55(5–6):1489–1505. https
and the Maritime Continent from the perspective of regional-scale ://doi.org/10.1007/s00382-020-05338-8
weather regimes. J Appl Meteorol Climatol 58(2):365–384. https Pook MJ, McIntosh PC, Meyers GA (2006) The synoptic decomposi-
://doi.org/10.1175/JAMC-D-18-0136.1 tion of cool-season rainfall in the southeastern Australian crop-
Hawcroft MK, Shaffrey LC, Hodges KI, Dacre HF (2012) How much ping region. J Appl Meteorol Climatol 45(8):1156–1170. https://
Northern Hemisphere precipitation is associated with extra- doi.org/10.1175/JAM2394.1
tropical cyclones? Geophys Res Lett 39:L24809. https://doi. Pook MJ, Risbey JS, McIntosh PC (2011) The synoptic climatology of
org/10.1029/2012GL053866 cool-season rainfall in the central Wheatbelt of Western Australia.
Hersbach H, Bell B, Berrisford P, Hirahara S, Horányi A, Muñoz- Mon Weather Rev 140:28–43. https://doi.org/10.1175/MWR-D-
Sabater J et al (2020) The ERA5 global reanalysis. Q J R Meteorol 11-00048.1
Soc. https://doi.org/10.1002/qj.3803 Pook MJ, Risbey JS, McIntosh PC (2014) A comparative synoptic cli-
Hope PK, Drosdowsky W, Nicholls N (2006) Shifts in the synoptic matology of cool-season rainfall in major grain-growing regions
systems influencing southwest Western Australia. Clim Dyn of southern Australia. Theor Appl Climatol 117(3–4):521–533.
26(7):751–764. https://doi.org/10.1007/s00382-006-0115-y https://doi.org/10.1007/s00704-013-1021-y
Hope P, Timbal B, Fawcett R (2010) Associations between rainfall Rauniyar SP, Power SB (2020) The impact of anthropogenic forc-
variability in the southwest and southeast of Australia and their ing and natural processes on past, present and future rainfall
evolution through time. Int J Climatol 30(9):1360–1371. https:// over Victoria, Australia. J Clim 33(18):8087–8106. https://doi.
doi.org/10.1002/joc.1964 org/10.1175/JCLI-D-19-0759.1
Hope P, Keay K, Pook M, Catto J, Simmonds I, Mills G et al (2014) Reid KJ, Simmonds I, Vincent CL, King AD (2019) The Australian
A comparison of automated methods of front recognition for cli- Northwest Cloudband: climatology, mechanisms and associa-
mate studies: a case study in Southwest Western Australia. Mon tion with precipitation. J Clim 32:1–48. https://doi.org/10.1175/
Weather Rev 142(1):343–363. https://doi.org/10.1175/MWR-D- jcli-d-19-0031.1
12-00252.1 Risbey JS, Pook MJ, McIntosh PC, Ummenhofer CC, Meyers G (2009)
Hope P, Grose MR, Timbal B, Dowdy AJ, Bhend J, Katzfey JJ et al Characteristics and variability of synoptic features associated
(2015) Seasonal and regional signature of the projected southern with cool season rainfall in southeastern Australia. Int J Climatol
Australian rainfall reduction. Aust Meteorol Oceanogr J 65(1):54– 29(11):1595–1613. https://doi.org/10.1002/joc.1775
71. https://doi.org/10.22499/2.6501.005 Risbey JS, Pook MJ, McIntosh PC (2013a) Spatial trends in synoptic
Hope P, Timbal B, Hendon H, Ekström M, Potter N (2017) A synthe- rainfall in southern Australia. Geophys Res Lett 40(14):3781–
sis of findings from the Victorian Climate Initiative. Bureau of 3785. https://doi.org/10.1002/grl.50739
Meteorology, Australia Risbey JS, Mcintosh PC, Pook MJ (2013b) Synoptic components of
Jones DA, Wang W, Fawcett R (2009) High-quality spatial climate rainfall variability and trends in southeast Australia. Int J Climatol
data-sets for Australia. Aust Meteorol Oceanogr J 58(4):233–248 33(11):2459–2472. https://doi.org/10.1002/joc.3597
King AD, Alexander LV, Donat MG (2013) The efficacy of using Rudeva I, Simmonds I (2015) Variability and trends of global atmos-
gridded data to examine extreme rainfall characteristics: a case pheric frontal activity and links with large-scale modes of vari-
study for Australia. Int J Climatol 33(10):2376–2387. https://doi. ability. J Clim 28(8):3311–3330. https://doi.org/10.1175/JCLI-
org/10.1002/joc.3588 D-14-00458.1
Madonna E, Wernli H, Joos H, Martius O (2014) Warm conveyor belts Simmonds I, Murray RJ, Leighton R M (1999) A refinement of cyclone
in the ERA-Interim Dataset (1979–2010). Part I: climatology tracking methods with data from FROST. Aust Meteorol Mag,
and potential vorticity evolution. J Clim 27(1):3–26. https://doi. Special Issue, 35–49
org/10.1175/JCLI-D-12-00720.1 Simmonds I, Keay K, Bye JAT (2012) Identification and climatology of
Murphy BF, Timbal B (2008) A review of recent climate variability and Southern Hemisphere mobile fronts in a modern reanalysis. J Clim
climate change in southeastern Australia. Int J Climat 28:859–879 25(6):1945–1962. https://doi.org/10.1175/JCLI-D-11-00100.1
Murray RJ, Simmonds I (1991) A numerical scheme for tracking Timbal B (2010) The climate of the Eastern Seaboard of Australia:
cyclone centres from digital data. Part I: development and opera- a challenging entity now and for future projections. IOP Conf
tion of the scheme. Aust Meteorol Mag 39(3):155–166 Ser Earth Environ Sci 11:12013. https://doi.org/10.1088/1755-
Nguyen H, Lucas C, Evans A, Timbal B, Hanson L (2015) Expansion 1315/11/1/012013
of the Southern Hemisphere hadley cell in response to greenhouse Timbal B, Drosdowsky W (2013) The relationship between the decline
gas forcing. J Clim 28(20):8067–8077. https://doi.org/10.1175/ of Southeastern Australian rainfall and the strengthening of the
JCLI-D-15-0139.1 subtropical ridge. Int J Climatol 33(4):1021–1034. https://doi.
Osburn L, Hope P, Dowdy A (2021) Changes in hourly extreme pre- org/10.1002/joc.3492
cipitation in Victoria, Australia, from the observational record. Timbal B, Arblaster JM, Power S (2006) Attribution of the late-
Weather Clim Extrem 31:100294. https: //doi.org/10.1016/j. twentieth-century rainfall decline in southwest Australia. J Clim
wace.2020.100294 19(10):2046–2062. https://doi.org/10.1175/JCLI3817.1
Pepler A, Dowdy A (2020) A Three-dimensional perspective on extra- Timbal B, Arblaster J, Braganza K, Fernandez E, Hendon H, Mur-
tropical cyclone impacts. J Clim 33(13):5635–5649. https://doi. phy B et al (2010) Understanding the anthropogenic nature of the
org/10.1175/JCLI-D-19-0445.1
132302 A. S. Pepler et al.
observed rainfall decline across South Eastern Australia. CAWCR Westra S, Fowler HJ, Evans JP, Alexander LV, Berg P, Johnson F et al
Technical Report 26. http://www.cawcr.gov.au/technical-reports/ (2014) Future changes to the intensity and frequency of short-
CTR_026.pdf duration extreme rainfall. Rev Geophys 52(3):522–555. https://
Utsumi N, Kim H, Kanae S, Oki T (2016) Which weather systems are doi.org/10.1002/2014RG000464
projected to cause future changes in mean and extreme precipita-
tion in CMIP5 simulations? J Geophys Res Atmos. https://doi. Publisher’s Note Springer Nature remains neutral with regard to
org/10.1002/2016JD024939 jurisdictional claims in published maps and institutional affiliations.
Wernli H, Schwierz C (2006) Surface Cyclones in the ERA-40 Dataset
(1958–2001). Part I: novel identification method and global clima-
tology. J Atmos Sci 63(10):2486–2507. https://doi.org/10.1175/
JAS3766.1
13You can also read