Impact of aerosol-radiation interaction on new particle formation
←
→
Page content transcription
If your browser does not render page correctly, please read the page content below
Atmos. Chem. Phys., 21, 9995–10004, 2021
https://doi.org/10.5194/acp-21-9995-2021
© Author(s) 2021. This work is distributed under
the Creative Commons Attribution 4.0 License.

Impact of aerosol–radiation interaction on new particle formation
Gang Zhao1 , Yishu Zhu1 , Zhijun Wu1 , Taomou Zong1 , Jingchuan Chen1 , Tianyi Tan1 , Haichao Wang1 , Xin Fang1 ,
Keding Lu1 , Chunsheng Zhao2 , and Min Hu1
1 StateKey Joint Laboratory of Environmental Simulation and Pollution Control, International Joint Laboratory for Regional
Pollution Control, Ministry of Education (IJRC), College of Environmental Sciences and Engineering, Peking University,
Beijing, 100871, China
2 Department of Atmospheric and Oceanic Sciences, School of Physics, Peking University, Beijing, 100871, China

Correspondence: Min Hu (minhu@pku.edu.cn)

Received: 21 December 2020 – Discussion started: 4 February 2021
Revised: 15 April 2021 – Accepted: 9 June 2021 – Published: 6 July 2021

Abstract. New particle formation (NPF) is thought to con-          1   Introduction
tribute half of the global cloud condensation nuclei. A better
understanding of the NPF at different altitudes can help as-
sess the impact of NPF on cloud formation and correspond-          Atmospheric particles influence the earth’s energy balance
ing physical properties. However, NPF is not sufficiently un-      by directly interacting with the solar radiation and indirectly
derstood in the upper mixing layer because previous studies        being activated as cloud condensation nucleation (CCN)
mainly focused on ground-level measurements. In this study,        (Ghan and Schwartz, 2007). New particle formation (NPF)
the developments of aerosol size distribution at different alti-   in the atmosphere and the coagulation herein may enable
tudes are characterized based on the field measurement con-        particles to grow larger than 60 nm, at which point aerosols
ducted in January 2019 in Beijing, China. We find that the         can exert radiative effects on the solar radiation and act as
partition of nucleation-mode particles in the upper mixing         CCN (Williamson et al., 2019; Shang et al., 2021). Some re-
layer is larger than that at the ground, which implies that the    searchers find that the NPF is responsible for around half of
nucleation processing is more likely to happen in the upper        the global CCN (Merikanto et al., 2009; Du et al., 2017; Kul-
mixing layer than that at the ground. Results of the radiative     mala et al., 2014). However, there is still considerable uncer-
transfer model show that the photolysis rates of the nitrogen      tainty about the magnitude that the NPF attributes to CCN
dioxide and ozone increase with altitude within the mixing         (Kulmala et al., 2004; Merikanto et al., 2009; Zhang et al.,
layer, which leads to a higher concentration of sulfuric acid      2012). A better understanding of the NPF at different alti-
in the upper mixing layer than that at the ground. Therefore,      tudes can help assess the impact of NPF on cloud formation
the nucleation processing in the upper mixing layer should be      and corresponding radiative effects. However, the underlying
stronger than that at the ground, which is consistent with our     mechanism of NPF at different altitudes has not been well
measurement results. Our study emphasizes the influence of         studied yet.
aerosol–radiation interaction on the NPF. These results have          Nucleation requires sufficient amounts of precursor gases
the potential to improve our understanding of the source of        (Kulmala et al., 2004). Sulfuric acid (H2 SO4 ) is thought to be
cloud condensation nuclei on a global scale due to the im-         the most important precursor for NPF events (Weber et al.,
pacts of aerosol–radiation interaction.                            1997, 1996, 2001; Stolzenburg et al., 2005; Kulmala et al.,
                                                                   2013). Knowledge of the profile of H2 SO4 number concen-
                                                                   trations ([H2 SO4 ]) can help understand the NPF mechanism,
                                                                   while the profile of the sulfuric acid is not well known due to
                                                                   the limitation of measurements.
                                                                      The content of H2 SO4 in a pseudo-steady state can be
                                                                   estimated by the number concentration of hydroxyl radical
                                                                   [OH], sulfur dioxide [SO2 ], and aerosol condensation sink

Published by Copernicus Publications on behalf of the European Geosciences Union.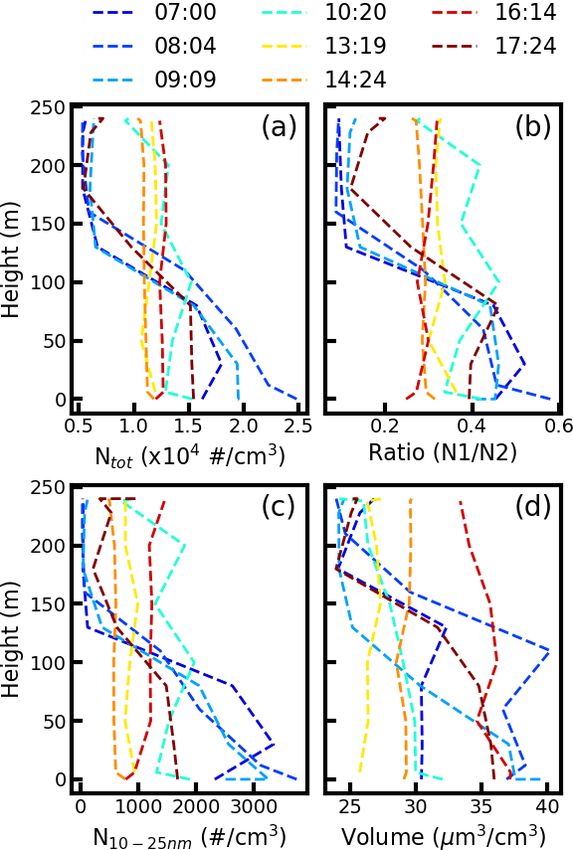
9996                                       G. Zhao et al.: Impact of aerosol–radiation interaction on new particle formation

(CS) (Kulmala et al., 2001; Shang et al., 2021). The [OH] is         every 5 min. Aerosol scattering coefficient (σsca ) at the wave-
related to solar ultraviolet radiation (Rohrer and Berresheim,       lengths of 450, 525, and 635 nm were measured by an Au-
2006). Previous studies found that the profile of photolysis         rora 3000 nephelometer (Müller et al., 2011) with a time res-
radiation varies significantly for different aerosol vertical dis-   olution of 1 min. The nitrogen dioxide (NO2 ) was measured
tributions and that the ultraviolet radiation is highly related      every minute based on its absorbance at 405 nm with a low-
to the aerosol optical properties (Tao et al., 2014). Therefore,     power lightweight instrument (model 405 nm, 2B Technol-
the ambient aerosol–radiation interaction may exert a signif-        ogy, USA). The nitrogen monoxide (NO) was measured by
icant influence on the NPF by determining the [OH] vertical          adding an excess of ozone with another power lightweight
profile. However, the influence of ultraviolet radiation on the      instrument (model 106-L, 2B Technology, USA) with a time
NPF is not well understood.                                          resolution of 1 min. The wind speed, wind direction, ambi-
   In the past few decades, extensive measurements have              ent relative humidity, and temperature were measured by a
been conducted at ground level to characterize the ambient           small auto meteorology station. This instrument can record
aerosol particle number size distribution (PNSD) and then            the atmosphere pressure, which was used to retrieve the alti-
NPF events (Bullard et al., 2017; Du et al., 2018; Peng et al.,      tude information. All of the data were averaged with a time
2017; Malinina et al., 2018). Some studies suggest that the          resolution of 5 min.
nucleation of fine particles can be altitude-dependent (Shang
et al., 2018). High concentrations of nucleation-mode par-           2.2   Lognormal fit of PSND
ticles were found in the upper parts of the mixing layer
(Schobesberger et al., 2013). It is observed that the particle       For each of the measured PSNDs, it is fitted by three lognor-
growth rate in the upper mixing layer is larger than that on         mal distribution modes by
the ground (Du et al., 2017). Measurements from the tethered                                               "                      #
balloon also show that a large partition of 11–16 nm particles                  X              Ni             log(Dp) − log(Dpi )
                                                                     N (Dp) =              √            exp −                       , (1)
was generated from the top region of the mixing layer and                                                         2log2 σg,i
                                                                                    i=1,2,3 2π log(σ )

                                                                                                    g,i
was then rapidly mixed down throughout the mixing layer
(Chen et al., 2018; Platis et al., 2016). Aircraft measurements      where Ni , σg,i , and Dpi are the number concentration, geo-
(Wang et al., 2016; Zhao et al., 2020) also found that the free      metric standard deviation, and geometric mean diameter of
troposphere favors the NPF. Most of these studies, to the best       mode i, respectively. Two examples of fitting the measured
of our best knowledge, focus on the concentration of precur-         PNSD are shown in Fig. S1. The three modes with geometric
sor gases but not on the aerosol–radiation interaction.              diameter ranges of 10–25, 25–100, and 100–700 nm corre-
   In this study, we first demonstrate that the NPF is more          spond to the nucleation mode, Aitken mode, and accumula-
likely to happen in the upper mixing layer than in the near-         tion mode, respectively. The nucleation particles mainly re-
ground surface layer based on field measurement of the               sult from the nucleation process, and the Aitken-mode parti-
aerosol PNSD profiles. We find that the tendency of NPF              cles are from primary sources, such as traffic sources (Shang
is well related to ultraviolet radiation, implying that the          et al., 2018). The accumulation-mode particles are correlated
aerosol–radiation interaction is an important factor that in-        with secondary formation, which mainly represents the am-
fluences the NPF.                                                    bient pollution conditions (Wu et al., 2008).

                                                                     2.3   Mie model
2     Data and methods
                                                                     The Mie scattering model (Bohren and Huffman, 2007) is
2.1    Field measurement                                             used to estimate the aerosol optical properties. When run-
                                                                     ning the Mie model, aerosol PNSD, aerosol black carbon
The field measurements were carried from 17 to 19 Jan-               mass size distribution, and refractive index are essential. The
uary 2019 at the Institute of Atmospheric Physics (IAP),             measured mean black carbon mass size distribution from
Chinese Academy of Sciences (39◦ 180 N, 116◦ 220 E), an ur-          Zhao et al. (2019) is adopted in this study, which is mea-
ban site in Beijing, China. Details of the measurement site          sured around 3 km away from this site. The refractive index
can be found in H. Wang et al. (2018), Chen et al. (2015),           of the non-black carbon and black carbon aerosol compo-
and Q. Wang et al. (2018). Vertical measurements were con-           nents is 1.64 + 0i, which is the measured mean aerosol re-
ducted from the tower-based platform, with a maximum                 fractive index measured at Beijing (paper in preparation),
height of 350 m, on the IAP campus. All of the instruments           and 1.96+0.66i (Zhao et al., 2017), respectively. The aerosol
were installed on a moving cabin of the tower, which moves           hygroscopic growth is not considered here because the am-
up and down at altitudes between 0 and 240 m. The cabin              bient relative humidity during the measurement was all the
moved around 10 m every minute in altitude. Aerosol PNSD             way lower than 30 % as shown in Fig. 1b. With the measured
in the size range between 10 and 700 nm was measured us-             different aerosol PNSD and above-mentioned information,
ing a scanning mobility particle size (SMPS; TSI Inc. 3010)          we can calculate the corresponding aerosol optical proper-

Atmos. Chem. Phys., 21, 9995–10004, 2021                                                 https://doi.org/10.5194/acp-21-9995-2021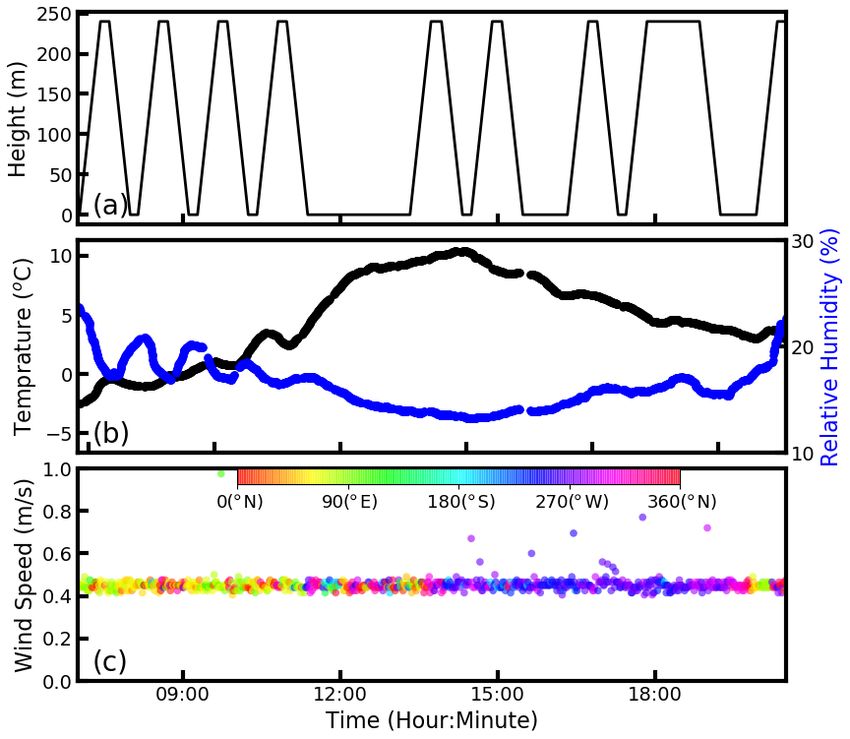
G. Zhao et al.: Impact of aerosol–radiation interaction on new particle formation                                                9997

                                                                     2.5    Influence of photolysis ratio on the [H2 SO4 ]

                                                                     The content of H2 SO4 in a pseudo-steady state can be calcu-
                                                                     lated (Kulmala et al., 2001) with

                                                                     [H2 SO4 ] = k [OH] [SO2 ] /CS,                                (2)

                                                                     where [OH] and [SO2 ] are the number concentrations of hy-
                                                                     droxyl radical and sulfur dioxide, respectively; CS is the con-
                                                                     densation sink, which quantifies the limitation of NPF from
                                                                     existing particles. It is calculated as (Maso et al., 2005)
                                                                                 X
                                                                     CS = 2π D       βm (Dp,i )Dpi Ni ,                          (3)

                                                                     where Ni is the particle concentration in size Dp,i . The D is
                                                                     the diffusion coefficient of the H2 SO4 , and the βm is the tran-
                                                                     sition regime correction factor. Based on the work of Ehhalt
                                                                     and Rohrer (2000), the [OH] can be calculated by
                                                                             h      iα                     b [NO2 ] + 1
Figure 1. Time series of the (a) measurement altitude, (b) temper-   [OH] = a J O1 D     [J (NO2 )]β                             , (4)
ature (black line) and relative humidity (blue line), and (c) wind                                     c[NO2 ]2 + d [NO2 ] + 1
speed and wind direction.
                                                                     with α, β, a, b, c, and d equaling 0.83, 0.19, 4.1 × 10⁹ , 140,
                                                                     0.41, and 1.7, respectively.
ties, which contain the aerosol σsca , aerosol single scattering
albedo (SSA), and asymmetry factor (g).
                                                                     3     Results and discussions
2.4   Tropospheric Ultraviolet-Visible radiation model
                                                                     3.1    Aerosol PNSD at different altitudes and times
The Tropospheric Ultraviolet-Visible radiation (TUV)
model, developed by Madronich and Flocke (1997), is an               The measured aerosol PNSD profiles in the time range be-
advanced transfer model with an eight-stream, discrete ordi-         tween 07:00 and 18:50 LT on 18 January were used for anal-
nate solver. This model can calculate the spectral irradiance,       ysis, which contained eight different upward and downward
spectral actinic flux, and photo-dissociation frequencies in         movements of the cabin, respectively. Figure 1a gives de-
the wavelength range between 121 and 735 nm. In this study,          tailed time–altitude information of each measurement. All of
the photolysis frequency of the nitrogen dioxide (J(NO2 ))           the time mentioned in the research corresponds to the local
and ozone (J(O1 D)) was used for further study. Inputs of the        time zone.
TUV model are the aerosol optical depth and single scatter-             On 18 January, the measured ambient temperature and rel-
ing albedo (Tao et al., 2014). The cloud aerosol optical depth       ative humidity ranges were −3–10 ◦ C and 13 %–24 %, re-
is set to be zero in this study. The output of the TUV model         spectively, which implied that the ambient air in the winter
includes the profiles of J(NO2 ) and J(O1 D).                        of Beijing is dry and cold. Aerosol hygroscopic growth was
   In the TUV model, the inputs of the aerosol optical prop-         thus not considered in this study. The wind speeds during the
erties are the aerosol optical depths at the wavelength of           measurement were lower than 1 m s−1 , and thus the measure-
550 nm and the column-averaged SSA. The profiles of the              ment results of aerosol microphysical properties were hardly
σsca are calculated assuming that the aerosol σsca is propor-        influenced by transport.
tional to those measured by Elterman et al. (1968). The g val-          During the measurement, the σsca varied between 0 and
ues are set to be fixed as 0.61. Some changes were made in           400 M m−1 . It ranged between 100 and 200 M m−1 on
the source code of the TUV model. In our model, the author-          18 January. We compared the measured σsca using the neph-
defined aerosol σsca profiles, SSA profiles, and g profiles can      elometer and calculated σsca using the Mie scattering model
be used as the input of the model. Therefore, the J(NO2 )            and measured PNSD. The measured and calculated σsca show
and J(O1 D) profiles with different aerosol optical profiles (in-    good consistency, with slopevalu es of 1.00, 0.95, and 0.89
cluding aerosol σsca , SSA, and g) can be estimated.                 for wavelengths of 450, 525, and 635 nm, respectively, as
                                                                     shown in Fig. S2. The calculated σsca values are slightly
                                                                     smaller than that of the measured ones because the mea-
                                                                     sured aerosol PNSD only covers the aerosol diameter be-
                                                                     tween 10 and 700 nm, while the measured σsca represents
                                                                     the optical properties of the whole population. The squares

https://doi.org/10.5194/acp-21-9995-2021                                             Atmos. Chem. Phys., 21, 9995–10004, 2021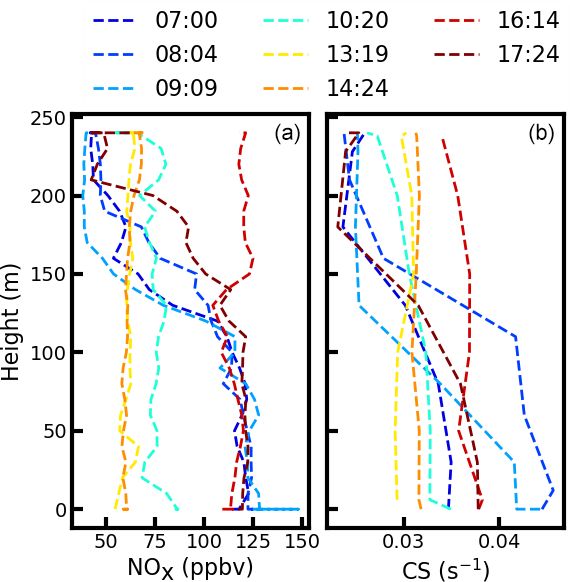
9998 G. Zhao et al.: Impact of aerosol–radiation interaction on new particle formation
of the correlation coefficients are 0.97, 0.97, and 0.97 for the 3.2 Nucleation process in the upper mixing layer
above-mentioned different wavelengths. Our results demon-
strate that the measured ambient aerosol PNSDs are reliable We calculated aerosol total number concentration for each
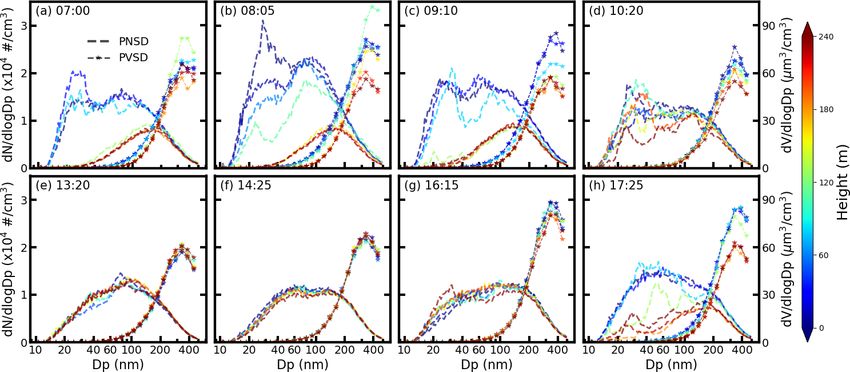
for further analysis. measured PNSD (Ntot ), and the profiles of Ntot are shown
The measured aerosol PNSD varied significantly for dif- in Fig. 3a. All of the profiles in Fig. 3 corresponded to
ferent altitudes and times. PNSD profiles in Fig. 2 corre- these cases when the cabin is moving up. The Ntot pro-
sponded to these periods when the cabin moved upward. files varied significantly with the development of the mix-
The corresponding downward PNSD profiles are shown in ing layer. In the morning, the Ntot in the surface (larger than
Fig. S2. In the early morning, the PNSD on the ground sur- 2 × 104 cm−3 ) was larger than that at a higher level (lower
face is substantially different for different altitudes. Parti- than 1 × 104 cm−3 ) because the turbulence is so weak that
cle number concentration on the ground surface can reach the initially emitted particles on the surface cannot be trans-
1.5 × 104 cm−3 , and the number concentrations peaked at ported to the upper level. In the afternoon around 14:00 and
less than 100 nm. It was only 8 × 103 cm−3 , with a peak- 16:00, the aerosol was well mixed in the mixing layer and
ing aerosol diameter at around 200 nm at a higher altitude of Ntot was almost uniform, with around 1.2 × 10⁴ per cubic
around 200 m. The solar radiation in the morning was very centimeter. Afterward, the turbulence was weaker than that
weak; therefore, the turbulence mixing of the aerosol among in the early afternoon, and again the emitted aerosols cannot
different altitudes was very weak. The initial emission from reach the higher level. The profile of Ntot in the morning was
the ground surface cannot be mixed up to higher locations, similar to that in the late afternoon and night.
and thus the aerosol number concentrations at the surface The number ratio profiles of nucleation mode to Aitken
were larger than that at a higher level as shown in Fig. 2a. mode (N1 /N2 ) for different times are shown in Fig. 3b and
With the increment of solar radiation and ambient tem- summarized in Table 1. In the morning of 07:00, the ratio
perature, the turbulence mixing of ambient particles became decreased from around 0.6 to 0.04 when the cabin moved up
stronger. The aerosol PNSD at the surface decreased with from 0 to 240 m. The ratio on the ground surface decreased
time because the near-ground particles were mixed up to over time because the temperature and turbulence increased
a higher location as shown in Fig. 2b and c. However, the when it came to 08:00–10:00 in the morning. However, the
aerosol PNSD at higher altitude increased with time due to turbulence was not strong enough to mix all of the particles
the upcoming mixed aerosol particles from lower altitude. to upper levels to 240 nm. The ratio still decreased with alti-
Therefore, the difference between the aerosol PNSD at dif- tude. In the afternoon, the mixing layer developed well, and
ferent altitudes became smaller with the development of the the ratios between 13:20 and 14:25 were almost uniformly
mixing layer as shown in Fig. 2b, c, and d. These particles distributed at different altitudes. However, we found that the
were still not well mixed in the range between 0 and 240 m ratio increased with altitude from 0.21 to 0.34 when it came
until 10:20. to 16:15, which implied that more nucleation-mode particles
In the afternoon, the mixing layer was well mixed with were formed in the upper level in the mixing layer. The in-
the increment of solar radiation and ambient temperature. crement of the ratio was hardly influenced by transport be-
The aerosol PNSD and PVSD were almost uniformly dis- cause the wind speed during the measurement was all the
tributed as shown in Fig. 2e and f. However, the turbulence time lower than 1 m s−1 as shown in Fig. 1b.
was relatively weak after 15:00 as the measured PNSD and To better configure the variations of PNSD, we calculated
PVSD on the ground surface were slightly larger than that of the aerosol number concentrations with the diameter between
a higher place. After 16:00, the turbulence was weaker be- 10 and 25 nm (N10−25 nm ). The N10−25 nm profiles in Fig. 3c
cause a larger difference between the PNSD at the ground show almost the same trends with the number ratio of N1
surface and the higher level existed. The ambient particles to N2 . In the morning and late afternoon, the N10−25 nm de-
were hardly mixed after the sunset. The measured aerosol creased with the altitude. The N10−25 nm in the early after-
PNSD profiles showed almost the same properties as that noon were uniformly distributed due to the strong mixing
in the morning, with more aerosol particles located on the in the mixing layer. When it came to 16:15, the N10−25 nm
ground surface from emissions. at different altitudes was larger than that in the early after-
Overall, the measured PNSD profiles were highly related noon. Most importantly, N10−25 nm increases with altitude.
to the intensity of turbulence. When the turbulence was weak, The aerosol total volume at 16:15 does not increase with al-
the PNSD at the surface was different from that of upper lev- titude because the nucleation-produced particles are so small
els because the initially emitted particles cannot be mixed that they contribute negligibly to the aerosol total volume.
up to a higher location. The PNSD tended to be uniformly Based on the discussion above, we found that the to-
distributed when the turbulence within the mixing layer was tal aerosol number concentrations increased slightly with
strong. altitude at 16:15. The number ratio of N1 to N2 and the
N10−25 nm increased with altitude. The total volumes of the
aerosol particles were almost the same at different altitudes.
The variation of PNSD was hardly influenced by transport.
Atmos. Chem. Phys., 21, 9995–10004, 2021 https://doi.org/10.5194/acp-21-9995-2021G. Zhao et al.: Impact of aerosol–radiation interaction on new particle formation 9999
Figure 2. The measured aerosol PSND (dashed line) and the PVSD (dashed line with star) at (a) 07:00, (b) 08:05, (c) 09:50, (d) 10:20,
(e) 13:20, (f) 14:25, (g) 16:15, and (h) 17:25. The filled colors represent the corresponding measurement altitude above the ground.
Table 1. The number ratio of nucleation mode to Aitken mode.
Altitude Time
07:00 08:05 09:10 10:20 13:20 14:25 16:15 17:25
0 0.56 0.52 0.43 0.36 0.21 0.20 0.21 0.32
30 0.63 0.44 0.42 0.35 0.21 0.19 0.23 0.30
60 0.61 0.34 0.40 0.40 0.22 0.19 0.27 0.28
110 0.05 0.26 0.25 0.46 0.27 0.19 0.28 0.14
160 0.04 0.03 0.07 0.39 0.20 0.17 0.27 0.17
210 0.03 0.03 0.08 0.51 0.20 0.17 0.30 0.31
240 0.04 0.03 0.09 0.26 0.21 0.16 0.34 0.37
Therefore, we concluded that the nucleation process was 3.3 Influence of aerosol–radiation interaction on NPF
more likely to happen in the upper level of the mixing layer
than the ground surface. This phenomenon was not observed
in the early afternoon because the turbulence in the early af- Based on Eq. (2), the nucleation rate mainly depends on
ternoon is so strong that the aerosol particles are well mixed [OH], [SO2 ], and CS. The [SO2 ] is not available at this mea-
in the mixing layer. surement. However, we measured the [NOx ], which is the
Many previous studies have reported the NPF events in sum of NO and NO2 . Both the [NOx ] and [SO2 ] were mainly
the upper mixing layer. The study in Platis et al. (2016) re- from the ground emission. The [SO2 ] tends to have a longer
ported that the NPF originated at elevated altitude and then lifetime than that of [NOx ] (Steinfeld, 1998). Thus, the [SO2 ]
was mixed down to the ground in Germany. The higher tends to be more uniformly distributed within the boundary
nucleation-mode particle number concentrations were ob- layer than [NOx ] when the turbulence is strong. The [NOx ]
served in the top region of the mixing layer and were then in the afternoon is almost uniformly distributed as shown in
rapidly mixed throughout the mixing layer in South America Fig. 4a. Thus, the [SO2 ] should be uniformly distributed in
(Chen et al., 2018). Qi et al. (2019) also found the NPF at the the afternoon within the mixing layer. The CS profiles, in
top of the mixing layer based on tethered airship measure- Fig. 4b, were almost uniformly distributed in the afternoon.
ments in eastern China. The NPF events were also observed Therefore, the [OH] is the only main factor that may result in
at different altitudes in the North China Plain (Zhu et al., different characteristics of NPF at different
altitudes. From
2019). Eq. (4), the vertical distribution of J O1 D and J (NO2 ) had
a significant influence on [OH] and further influences the
NPF. However, the J O1 D and J (NO2 ) were not measured.
https://doi.org/10.5194/acp-21-9995-2021 Atmos. Chem. Phys., 21, 9995–10004, 202110000 G. Zhao et al.: Impact of aerosol–radiation interaction on new particle formation
Figure 4. The measured (a) NOx and (b) CS at different altitudes.
The filled colors of different lines denote the different measurement
times.
and J (NO2 ) increase with altitude within the mixing layer.
The J O1 D increases from 8.9 × 10⁻³ to 14.3 × 10⁻³ s−1 ,
and J (NO2 ) increases from 3.0 × 10⁻⁵ to 6.2 × 10⁻⁵ s−1 in
Figure 3. The measured (a) aerosol number concentrations,
the mixing layer. The corresponding [OH] increased from
(b) number ratio of the nucleation-mode aerosol number concen- 6.2 × 10⁶ to 11.9 × 106 cm−3 based on Eq. (4). Thus, the
trations to Aitken-mode aerosol number concentrations, (c) aerosol [OH] at the top of the mixing layer is 2 times that on the
number concentrations for 10–25 nm, and (d) measured aerosol vol- ground surface due to the variation in photolysis rate. Our
ume concentrations at different altitudes. The filled colors of differ- estimated [OH] at the surface is consistent with the previ-
ent lines denote the different measurement time. ously estimated relationships between the [OH] and J O1 D
(Rohrer and Berresheim, 2006).
Overall, the aerosol profiles tend to be uniformly dis-
The TUV model was employed to estimate the J O1 D and
tributed within the mixing layer due to the strong turbulence
in the afternoon. The corresponding estimated J O1 D and
J (NO2 ) for different aerosol profiles.
The input of the TUV needs the aerosol optical proper- J (NO2 ) values increase with altitude, which leads to higher
ties in the altitude range between 0 and 20 km. The param- [OH] at the top of the mixing layer than that at the ground.
eterization of aerosol number concentration profiles by Liu Therefore, the [H2 SO4 ] should increase with altitude based
et al. (2009) with aircraft measurement in Beijing is used in on Eq. (2). There should be more nucleation processing at
this study. Liu et al. (2009) found that number concentration the top of the mixing layer than that at the ground, which is
constant within the mixing layer, linearly decreasing within consistent with our field measurement.
the transition layer and exponentially decreasing above the
transition layer when the particles within the boundary are 3.4 Impact of mixing layer development on the
well mixed. The normalized aerosol PNSD (PNSD divided photolysis rates
by total aerosol number concentration) was assumed to be
the same at different altitudes. The BC to total aerosol mass For a better understanding of the aerosol–radiation interac-
concentration ratio was also assumed to be the same at dif- tion on NPF, we estimated the photolysis rates under dif-
ferent altitudes (Ferrero et al., 2011). The σsca , SSA, and g ferent aerosol vertical profiles. Based on the work of Liu
profiles can be calculated by Mie theory under these assump- et al. (2009), two typical types of aerosol profiles exist un-
tions (Zhao et al., 2017, 2018). der different mixing layers as shown in Fig. S4. For the first
The lines with squares in Fig.5a and b provide the calcu- type of mixing layer, aerosols were not well mixed within
lated photolysis rates of J O1 D and J (NO2 ) with a mixing the mixing layer, and the aerosol number concentrations de-
layer altitude of 1000 m. Results show that both the J O1 D crease with altitude exponentially (type A). Another type of
Atmos. Chem. Phys., 21, 9995–10004, 2021 https://doi.org/10.5194/acp-21-9995-2021G. Zhao et al.: Impact of aerosol–radiation interaction on new particle formation 10001
Figure 5. The estimated (a) j (NO2 ), (b) j (O1 D), and (c) OH concentrations for different aerosol profiles. The (1) solid line, (2) solid line
marked with hexagons, (3) solid line marked with squares, and (4) solid line marked with stars represent the aerosol distribution of B1, B2,
B3, and B4, respectively.
Table 2. Details of the aerosol optical profiles and estimated photolysis values.
Profile Typea Altitudeb AOD k [J (NO2 )] k [J (O1 D)] k [OH]
(10−3 s−1 km−1 ) (10−5 s−1 km−1 ) (106 cm−3 km−1 )
B1 A 1000 0.3 2.6 1.7 3.4
B2 B 1000 0.3 3.3 2.0 4.1
B3 B 1000 0.8 5.3 3.0 5.5
B4 B 500 0.8 9.0 5.4 7.4
a Boundary layer type. b Boundary layer altitude.
mixing layer has aerosol number concentration constant in and 5.4 × 10⁻⁵ s−1 km−1 for the aerosol profile of B1, B2,
the mixing layer and then decreasing with altitude above the B3, and B4, respectively. The corresponding increase ratios
boundary (type B). For type B, we estimated the correspond- of the J (NO2 ) with altitude (kNO2 ) are 2.6×10⁻³ , 3.3×10⁻³ ,
ing photolysis rate for different mixing layer heights between 5.3×10⁻³ , and 9.0×10⁻³ s−1 km−1 for B1, B2, B3, and B4,
500 and 1000 m, which covers the mean mixing layer altitude respectively. The increase ratios of [OH] were estimated to
in the North China Plain (Zhu et al., 2018). The different be 3.4 × 10⁶ , 4.1 × 10⁶ , 5.5 × 10⁶ , and 7.4 × 106 cm−3 km−1
aerosol optical depth (AOD), which ranges between 0.3 and for B1, B2, B3, and B4, respectively (Table 2).
2, is used for different pollution conditions. These four profiles represent the typical ambient aerosol
Four different aerosol profiles are used in this study. De- profiles in the early morning, late morning, early afternoon,
tails of the four different aerosol profiles are summarized in and late afternoon, respectively. In the early morning, the tur-
Table 2. The first one corresponds to aerosol mixing layer bulence in the mixing layer is weak and the aerosol within
type A, with an exact boundary altitude of 1000 m and AOD the mixing layer is not well mixed (B1). In the late morning,
of 0.3 (B1). The second aerosol profile has the same bound- the aerosol in the boundary is well mixed and uniformly dis-
ary altitude of 1000 m and AOD of 0.3, but the mixing layer tributed due to the increasing turbulence (B2). The early af-
type is changed to B (B2). The third aerosol profile also cor- ternoon (B3) should have higher AOD when compared with
responds to mixing layer type B and a mixing layer altitude that in the late morning due to the formation of the secondary
of 1000 m, but the AOD is 0.8 (B3). The last one has a mix- aerosol. However, the mixing layer altitude decreased in the
ing layer altitude of 500 m, with an AOD of 0.8 and a mixing late afternoon (B4) because the turbulence within the mixing
layer type of B (B4). layer weakened compared with B3. The ambient aerosol pro-
The J O1 D and J (NO2 ) profiles under the above- files tend to change from B1 to B4 from early morning to late
mentioned aerosol profiles are estimated and shown in afternoon. The corresponding kO1 D and kNO2 increased with
Fig. 5a and b. For each type, both the J O1 D and J (NO2) the development of the mixing layer. In the late afternoon,
increase with altitude. The increased ratios of the J O1 D the differences of the photolysis rate at the top of the mixing
with altitude (kO1 D ) are 1.7 × 10⁻⁵ , 2.0 × 10⁻⁵ , 3.0 × 10⁻⁵ , layer and ground are the largest. Furthermore, the turbulence
https://doi.org/10.5194/acp-21-9995-2021 Atmos. Chem. Phys., 21, 9995–10004, 202110002 G. Zhao et al.: Impact of aerosol–radiation interaction on new particle formation
in the mixing layer is weakened, and the nucleation-formed Supplement. The supplement related to this article is available on-
particles cannot be mixed down to the ground. Therefore, one line at: https://doi.org/10.5194/acp-21-9995-2021-supplement.
is more likely to observe more nucleation-mode particles at
the top of the mixing layer than at the ground in the late af-
ternoon, which is consistent with our measurement. Author contributions. GZ and YZ did the analysis and wrote the
manuscript. MH, CZ, ZW, XF, and GZ discussed the results. YZ,
JC, TZ, TT, KL, and HW conducted the measurements.
4 Conclusion
Competing interests. The authors declare that they have no conflict
of interest.
In this study, we characterized the aerosol PNSD at different
times and different altitudes based on field measurements at
an urban site in Beijing, China. Our measurements show that Disclaimer. Publisher’s note: Copernicus Publications remains
the aerosol size distribution profiles varied significantly with neutral with regard to jurisdictional claims in published maps and
the development of the mixing layer. institutional affiliations.
In the morning, the turbulence in the boundary was weak,
and the initially emitted particles cannot be mixed to a higher
layer. The corresponding aerosol PNSD at the surface was Financial support. This research has been supported by the Na-
larger than that at higher locations. At noon, the particles tional Natural Science Foundation of China (grant no. 91844301)
within the boundary were well mixed and tend to be uni- and the National Key Research and Development Program of China
formly distributed at different altitudes. In the late afternoon, (grant no. 2016YFC0202000, tasks 3 and 5).
we found more nucleation-mode particles at a higher altitude
than that at the ground. The larger partitions of nucleation-
mode particles do not result from transformation. We con- Review statement. This paper was edited by Aijun Ding and re-
viewed by two anonymous referees.
cluded that the nucleation processing in the upper mixing
layer was more likely to happen than that at the ground.
The TUV model was employed to estimate the profiles of
photolysis rates for different aerosol profiles. Results showed
that both the J O1 D and J (NO2 ) values increased with al-
References
titude, which led to higher [OH] at the top of the mixing layer
than that at the ground. The corresponding [H2 SO4 ] should Bohren, C. F. and Huffman, D. R.: Absorption and Scatter-
increase with altitude based on Eq. (2), when the aerosol was ing by a Sphere, in: Absorption and Scattering of Light
well mixed and uniform in the mixing layer. Therefore, more by Small Particles, Wiley-VCH Verlag GmbH, 82–129,
nucleation processing at the top of the mixing layer may hap- https://doi.org/10.1002/9783527618156, 2007.
pen than that at the ground, which is consistent with our field Bullard, R. L., Singh, A., Anderson, S. M., Lehmann, C. M. B., and
Stanier, C. O.: 10-Month characterization of the aerosol num-
measurement.
ber size distribution and related air quality and meteorology at
We also estimate the corresponding photolysis rate pro-
the Bondville, IL Midwestern background site, Atmos. Environ.,
file under different boundary structures. The increasing ratio 154, 348–361, https://doi.org/10.1016/j.atmosenv.2016.12.055,
of the photolysis rate with altitude increases with the devel- 2017.
opment of the mixing layer from early morning to late af- Chen, C., Sun, Y. L., Xu, W. Q., Du, W., Zhou, L. B., Han, T. T.,
ternoon. In the late afternoon, the difference of the photoly- Wang, Q. Q., Fu, P. Q., Wang, Z. F., Gao, Z. Q., Zhang, Q.,
sis rate at the upper mixing layer and that at the ground are and Worsnop, D. R.: Characteristics and sources of submicron
the largest. At the same time, the turbulence is not so strong aerosols above the urban canopy (260 m) in Beijing, China, dur-
that the nucleation-mode particles formed in the upper mix- ing the 2014 APEC summit, Atmos. Chem. Phys., 15, 12879–
ing layer are not able to mix down to the ground. Therefore, 12895, https://doi.org/10.5194/acp-15-12879-2015, 2015.
it is a favor to observe a higher nucleation-mode particle con- Chen, H., Hodshire, A. L., Ortega, J., Greenberg, J., McMurry, P. H.,
Carlton, A. G., Pierce, J. R., Hanson, D. R., and Smith, J. N.: Ver-
centration at the upper mixing layer than that at the ground in
tically resolved concentration and liquid water content of atmo-
the afternoon. Our study reveals that the vertical distribution
spheric nanoparticles at the US DOE Southern Great Plains site,
of ambient aerosols would first influence the vertical profile Atmos. Chem. Phys., 18, 311–326, https://doi.org/10.5194/acp-
of the photolysis rate. Then the NPF for different altitudes is 18-311-2018, 2018.
tuned due to the different photolysis rates. Du, P., Gui, H., Zhang, J., Liu, J., Yu, T., Wang, J.,
Cheng, Y., and Shi, Z.: Number size distribution of at-
mospheric particles in a suburban Beijing in the sum-
Data availability. The data are available upon request to the corre- mer and winter of 2015, Atmos. Environ., 186, 32–44,
sponding author. https://doi.org/10.1016/j.atmosenv.2018.05.023, 2018.
Atmos. Chem. Phys., 21, 9995–10004, 2021 https://doi.org/10.5194/acp-21-9995-2021G. Zhao et al.: Impact of aerosol–radiation interaction on new particle formation 10003 Du, W., Zhao, J., Wang, Y., Zhang, Y., Wang, Q., Xu, W., Chen, Maso, M. D., Kulmala, M., Riipinen, I., Wagner, R., Hussein, T., C., Han, T., Zhang, F., Li, Z., Fu, P., Li, J., Wang, Z., and Sun, Aalto, P. P., and Lehtinen, K. E. J.: Formation and growth of fresh Y.: Simultaneous measurements of particle number size distri- atmospheric aerosols: eight years of aerosol size distribution data butions at ground level and 260 m on a meteorological tower from SMEAR II, Hyytiala, Finland, Boreal Environ. Res., 10, in urban Beijing, China, Atmos. Chem. Phys., 17, 6797–6811, 323–336, 2005. https://doi.org/10.5194/acp-17-6797-2017, 2017. Merikanto, J., Spracklen, D. V., Mann, G. W., Pickering, S. J., and Ehhalt, D. H. and Rohrer, F.: Dependence of the OH concen- Carslaw, K. S.: Impact of nucleation on global CCN, Atmos. tration on solar UV, J. Geophys.Res.-Atmos., 105, 3565–3571, Chem. Phys., 9, 8601–8616, https://doi.org/10.5194/acp-9-8601- https://doi.org/10.1029/1999JD901070, 2000. 2009, 2009. Elterman, L., Wexler, R., and Chang, D.: COMPARISON OF Müller, T., Laborde, M., Kassell, G., and Wiedensohler, A.: Design AEROSOL MEASUREMENTS OVER NEW MEXICO WITH and performance of a three-wavelength LED-based total scatter ATMOSPHERIC FEATURES, J. Opt. Soc. Am., 58, 741–746, and backscatter integrating nephelometer, Atmos. Meas. Tech., 1968. 4, 1291–1303, https://doi.org/10.5194/amt-4-1291-2011, 2011. Ferrero, L., Mocnik, G., Ferrini, B. S., Perrone, M. G., Sangiorgi, Peng, Y., Liu, X., Dai, J., Wang, Z., Dong, Z., Dong, Y., G., and Bolzacchini, E.: Vertical profiles of aerosol absorption Chen, C., Li, X., Zhao, N., and Fan, C.: Aerosol size dis- coefficient from micro-Aethalometer data and Mie calculation tribution and new particle formation events in the suburb over Milan, Sci. Total Environ., 409, 2824–2837, 2011. of Xi’an, northwest China, Atmos. Environ., 153, 194–205, Ghan, S. J. and Schwartz, S. E.: Aerosol Properties and Pro- https://doi.org/10.1016/j.atmosenv.2017.01.022, 2017. cesses: A Path from Field and Laboratory Measurements to Platis, A., Altstädter, B., Wehner, B., Wildmann, N., Lampert, A., Global Climate Models, B. Am. Meteorol. Soc., 88, 1059–1084, Hermann, M., Birmili, W., and Bange, J.: An Observational Case https://doi.org/10.1175/bams-88-7-1059, 2007. Study on the Influence of Atmospheric Boundary-Layer Dynam- Kulmala, M., Maso, M. D., Mäkelä, J. M., Pirjola, L., Väkevä, M., ics on New Particle Formation, Bound.-Lay. Meteorol., 158, 67– Aalto, P., Miikkulainen, P., Hämeri, K., and O’dowd, C. D.: On 92, https://doi.org/10.1007/s10546-015-0084-y, 2016. the formation, growth and composition of nucleation mode parti- Qi, X., Ding, A., Nie, W., Chi, X., Huang, X., Xu, Z., Wang, cles, Tellus B, 53, 479–490, 10.3402/tellusb.v53i4.16622, 2001. T., Wang, Z., Wang, J., Sun, P., Zhang, Q., Huo, J., Wang, Kulmala, M., Vehkamaki, H., Petaja, T., Dal Maso, M., Lauri, D., Bian, Q., Zhou, L., Zhang, Q., Ning, Z., Fei, D., Xiu, A., Kerminen, V. M., Birmili, W., and McMurry, P. H.: G., and Fu, Q.: Direct measurement of new particle forma- Formation and growth rates of ultrafine atmospheric parti- tion based on tethered airship around the top of the planetary cles: a review of observations, J. Aerosol Sci., 35, 143–176, boundary layer in eastern China, Atmos. Environ., 209, 92–101, https://doi.org/10.1016/j.jaerosci.2003.10.003, 2004. https://doi.org/10.1016/j.atmosenv.2019.04.024, 2019. Kulmala, M., Kontkanen, J., Junninen, H., Lehtipalo, K., Manni- Rohrer, F. and Berresheim, H.: Strong correlation between lev- nen, H. E., Nieminen, T., Petaja, T., Sipila, M., Schobesberger, els of tropospheric hydroxyl radicals and solar ultraviolet radia- S., Rantala, P., Franchin, A., Jokinen, T., Jarvinen, E., Aijala, M., tion, Nature, 442, 184–187, https://doi.org/10.1038/nature04924, Kangasluoma, J., Hakala, J., Aalto, P. P., Paasonen, P., Mikkila, 2006. J., Vanhanen, J., Aalto, J., Hakola, H., Makkonen, U., Ruuska- Schobesberger, S., Vaananen, R., and Leino, K.: Airborne measure- nen, T., Mauldin III, R. L., Duplissy, J., Vehkamaki, H., Back, ments over the boreal forest of southern Finland during new par- J., Kortelainen, A., Riipinen, I., Kurten, T., Johnston, M. V., ticle formation events in 2009 and 2010, Boreal Environ. Res., Smith, J. N., Ehn, M., Mentel, T. F., Lehtinen, K. E. J., Laak- 18, 145–163, 2013. sonen, A., Kerminen, V.-M., and Worsnop, D. R.: Direct Obser- Shang, D., Hu, M., Zheng, J., Qin, Y., Du, Z., Li, M., Fang, J., vations of Atmospheric Aerosol Nucleation, Science, 339, 943– Peng, J., Wu, Y., Lu, S., and Guo, S.: Particle number size 946, https://doi.org/10.1126/science.1227385, 2013. distribution and new particle formation under the influence of Kulmala, M., Petäjä, T., Ehn, M., Thornton, J., Sipilä, M., Worsnop, biomass burning at a high altitude background site at Mt. Yu- D. R., and Kerminen, V. M.: Chemistry of Atmospheric Nucle- long (3410 m), China, Atmos. Chem. Phys., 18, 15687–15703, ation: On the Recent Advances on Precursor Characterization https://doi.org/10.5194/acp-18-15687-2018, 2018. and Atmospheric Cluster Composition in Connection with At- Shang, D., Peng, J., Guo, S., Wu, Z., and Hu, M.: Secondary mospheric New Particle Formation, Annu. Rev. Phys. Chem., aerosol formation in winter haze over the Beijing-Tianjin- 65, 21–37, https://doi.org/10.1146/annurev-physchem-040412- Hebei Region, China, Front. Environ. Sci. Eng., 15, 34, 110014, 2014. https://doi.org/10.1007/s11783-020-1326-x, 2021. Liu, P., Zhao, C., Zhang, Q., Deng, Z., Huang, M., Xincheng, M. A., Steinfeld, J. I.: Atmospheric Chemistry and Physics: From and Tie, X.: Aircraft study of aerosol vertical distributions over Air Pollution to Climate Change, Environment: Sci- Beijing and their optical properties, Tellus B, 61, 756–767, 2009. ence and Policy for Sustainable Development, 40, 26–26, Madronich, S. and Flocke, S.: Theoretical Estimation of Biolog- https://doi.org/10.1080/00139157.1999.10544295, 1998. ically Effective UV Radiation at the Earth’s Surface, in: Solar Stolzenburg, M. R., McMurry, P. H., Sakurai, H., Smith, J. N., Ultraviolet Radiation, Berlin, Heidelberg, 23–48, 1997. Mauldin III, R. L., Eisele, F. L., and Clement, C. F.: Growth rates Malinina, E., Rozanov, A., Rozanov, V., Liebing, P., Bovens- of freshly nucleated atmospheric particles in Atlanta, J. Geophys. mann, H., and Burrows, J. P.: Aerosol particle size dis- Res.-Atmos., 110, D22, https://doi.org/10.1029/2005JD005935, tribution in the stratosphere retrieved from SCIAMACHY 2005. limb measurements, Atmos. Meas. Tech., 11, 2085–2100, Tao, J. C., Zhao, C. S., Ma, N., and Liu, P. F.: The impact of aerosol https://doi.org/10.5194/amt-11-2085-2018, 2018. hygroscopic growth on the single-scattering albedo and its ap- https://doi.org/10.5194/acp-21-9995-2021 Atmos. Chem. Phys., 21, 9995–10004, 2021
10004                                         G. Zhao et al.: Impact of aerosol–radiation interaction on new particle formation

  plication on the NO2 photolysis rate coefficient, Atmos. Chem.          Wu, Z., Hu, M., Lin, P., Liu, S., Wehner, B., and Wieden-
  Phys., 14, 12055–12067, https://doi.org/10.5194/acp-14-12055-             sohler, A.: Particle number size distribution in the urban at-
  2014, 2014.                                                               mosphere of Beijing, China, Atmos. Environ., 42, 7967–7980,
Wang, H., Lu, K., Chen, X., Zhu, Q., Wu, Z., Wu, Y., and Sun,               https://doi.org/10.1016/j.atmosenv.2008.06.022, 2008.
  K.: Fast particulate nitrate formation via N2 O5 uptake aloft           Zhang, R. Y., Khalizov, A., Wang, L., Hu, M., and Xu, W.: Nu-
  in winter in Beijing, Atmos. Chem. Phys., 18, 10483–10495,                cleation and Growth of Nanoparticles in the Atmosphere, Chem,
  https://doi.org/10.5194/acp-18-10483-2018, 2018.                          Rev„ 112, 1957–2011, https://doi.org/10.1021/cr2001756, 2012.
Wang, J., Krejci, R., Giangrande, S., Kuang, C., Barbosa, H. M.,          Zhao, B., Shrivastava, M., Donahue, N. M., Gordon, H., Schervish,
  Brito, J., Carbone, S., Chi, X., Comstock, J., Ditas, F., Lavric,         M., Shilling, J. E., Zaveri, R. A., Wang, J., Andreae, M. O., Zhao,
  J., Manninen, H. E., Mei, F., Moran-Zuloaga, D., Pohlker, C.,             C., Gaudet, B., Liu, Y., Fan, J., and Fast, J. D.: High concentra-
  Pohlker, M. L., Saturno, J., Schmid, B., Souza, R. A., Springston,        tion of ultrafine particles in the Amazon free troposphere pro-
  S. R., Tomlinson, J. M., Toto, T., Walter, D., Wimmer, D., Smith,         duced by organic new particle formation, P. Natl. Acad. Sci., 117,
  J. N., Kulmala, M., Machado, L. A., Artaxo, P., Andreae, M. O.,           25344, https://doi.org/10.1073/pnas.2006716117, 2020.
  Petaja, T., and Martin, S. T.: Amazon boundary layer aerosol con-       Zhao, G., Zhao, C., Kuang, Y., Tao, J., Tan, W., Bian, Y., Li,
  centration sustained by vertical transport during rainfall, Nature,       J., and Li, C.: Impact of aerosol hygroscopic growth on re-
  539, 416–419, https://doi.org/10.1038/nature19819, 2016.                  trieving aerosol extinction coefficient profiles from elastic-
Wang, Q., Sun, Y., Xu, W., Du, W., Zhou, L., Tang, G., Chen,                backscatter lidar signals, Atmos. Chem. Phys., 17, 12133–12143,
  C., Cheng, X., Zhao, X., Ji, D., Han, T., Wang, Z., Li, J., and           https://doi.org/10.5194/acp-17-12133-2017, 2017.
  Wang, Z.: Vertically resolved characteristics of air pollution dur-     Zhao, G., Zhao, C., Kuang, Y., Bian, Y., Tao, J., Shen, C., and
  ing two severe winter haze episodes in urban Beijing, China, At-          Yu, Y.: Calculating the aerosol asymmetry factor based on mea-
  mos. Chem. Phys., 18, 2495–2509, https://doi.org/10.5194/acp-             surements from the humidified nephelometer system, Atmos.
  18-2495-2018, 2018.                                                       Chem. Phys., 18, 9049–9060, https://doi.org/10.5194/acp-18-
Weber, R. J., Marti, J. J., McMurry, P. H., Eisele, F. L., Tanner,          9049-2018, 2018.
  D. J., and Jefferson, A.: MEASURED ATMOSPHERIC NEW                      Zhao, G., Tao, J., Kuang, Y., Shen, C., Yu, Y., and Zhao, C.:
  PARTICLE FORMATION RATES: IMPLICATIONS FOR NU-                            Role of black carbon mass size distribution in the direct
  CLEATION MECHANISMS, Chem. Eng. Commun., 151, 53–                         aerosol radiative forcing, Atmos. Chem. Phys., 19, 13175–
  64, https://doi.org/10.1080/00986449608936541, 1996.                      13188, https://doi.org/10.5194/acp-19-13175-2019, 2019.
Weber, R. J., Marti, J. J., McMurry, P. H., Eisele, F. L., Tan-           Zhu, X., Tang, G., Guo, J., Hu, B., Song, T., Wang, L., Xin, J., Gao,
  ner, D. J., and Jefferson, A.: Measurements of new parti-                 W., Münkel, C., Schäfer, K., Li, X., and Wang, Y.: Mixing layer
  cle formation and ultrafine particle growth rates at a clean              height on the North China Plain and meteorological evidence of
  continental site, J. Geophys. Res.-Atmos., 102, 4375–4385,                serious air pollution in southern Hebei, Atmos. Chem. Phys., 18,
  https://doi.org/10.1029/96JD03656, 1997.                                  4897–4910, https://doi.org/10.5194/acp-18-4897-2018, 2018.
Weber, R. J., Chen, G., Davis, D. D., Mauldin, R. L., Tanner, D. J.,      Zhu, Y., Wu, Z., Park, Y., Fan, X., Bai, D., Zong, P.,
  Eisele, F. L., Clarke, A. D., Thornton, D. C., and Bandy, A. R.:          Qin, B., Cai, X., and Ahn, K. H.: Measurements of at-
  Measurements of enhanced H2 SO4 and 3–4 nm particles near a               mospheric aerosol vertical distribution above North China
  frontal cloud during the First Aerosol Characterization Exper-            Plain using hexacopter, Sci. Total Environ., 665, 1095–1102,
  iment (ACE 1), J. Geophys. Res.-Atmos., 106, 24107–24117,                 https://doi.org/10.1016/j.scitotenv.2019.02.100, 2019.
  https://doi.org/10.1029/2000jd000109, 2001.
Williamson, C. J., Kupc, A., Axisa, D., Bilsback, K. R., Bui, T.,
  Campuzano-Jost, P., Dollner, M., Froyd, K. D., Hodshire, A. L.,
  Jimenez, J. L., Kodros, J. K., Luo, G., Murphy, D. M., Nault, B.
  A., Ray, E. A., Weinzierl, B., Wilson, J. C., Yu, F., Yu, P., Pierce,
  J. R., and Brock, C. A.: A large source of cloud condensation
  nuclei from new particle formation in the tropics, Nature, 574,
  399–403, https://doi.org/10.1038/s41586-019-1638-9, 2019.

Atmos. Chem. Phys., 21, 9995–10004, 2021                                                     https://doi.org/10.5194/acp-21-9995-2021
You can also read