Comparison of properties determined using electromechanical assessment (Arthro- BST) with macroscopic and histological properties in symptomatic ...
←
→
Page content transcription
If your browser does not render page correctly, please read the page content below
Ukai et al. Arthritis Research & Therapy  (2021) 23:227
https://doi.org/10.1186/s13075-021-02611-x

 RESEARCH ARTICLE                                                                                                                                   Open Access

Comparison of properties determined using
electromechanical assessment (Arthro-
BST™) with macroscopic and histological
properties in symptomatic human articular
cartilage of the hip
Taku Ukai1,2, Masato Sato1,2* , Shiho Wasai1,2, Takumi Takahashi1,2, Haruka Omura1,2 and Masahiko Watanabe1,2

  Abstract
  Background: Cartilage degeneration is assessed using various methods. Although macroscopic evaluation can
  directly measure cartilage degeneration, it cannot accurately assess cartilage properties. Histological examination is
  one of the most accurate methods for evaluating cartilage degeneration. However, it is invasive and requires
  collection of cartilage tissue. In contrast, the Arthro-BST™ probe can assess cartilage properties noninvasively. This
  study aimed to evaluate the effectiveness of the Arthro-BST in assessing cartilage degeneration by comparing
  macroscopic (International Cartilage Repair Society [ICRS] classification) and histological evaluations (modified
  Mankin score and Osteoarthritis Research Society International [OARSI] histological grade).
  Methods: Fourteen femoral heads were excised from 13 patients during surgery to treat hip osteoarthritis or
  femoral fracture. The ICRS score was used for macroscopic evaluation of cartilage degeneration. The Arthro-BST was
  applied at sites matching the areas of cartilage damage. The sites assessed using the ICRS classification and Arthro-
  BST were evaluated histologically (modified Mankin score and OARSI histological grade), and these were compared
  with the Arthro-BST results.
  Results: The ICRS classification identified significant differences between grades 1 and 3 (p < 0.01), between grades
  1 and 4 (p < 0.01), between grades 2 and 3 (p < 0.01), and between grades 2 and 4 (p < 0.01). Significant
  correlations were observed between the Arthro-BST results and the ICRS score, modified Mankin score (structure,
  cellularity, matrix staining, total score), and OARSI histological grade.
  Conclusions: In the assessment of hip osteoarthritis, the Arthro-BST results correlated with those of macroscopic
  and histological evaluations. The Arthro-BST is useful for assessing hip osteoarthritis and may be helpful for
  noninvasive assessment of cartilage degeneration.
  Keywords: Osteoarthritis, Arthro-BST, ICRS classification, Modified Mankin score, OARSI histological system

* Correspondence: sato-m@is.icc.u-tokai.ac.jp
1
 Department of Orthopedic Surgery, Surgical Science, Tokai University School
of Medicine, 143 Shimokasuya, Bohseidai, Isehara, Kanagawa 259-1193, Japan
2
 Center for Musculoskeletal Innovative Research and Advancement (C-MiRA),
Tokai University Graduate School, Shimokasuya, Isehara, Kanagawa 259-1193,
Japan

                                        © The Author(s). 2021 Open Access This article is licensed under a Creative Commons Attribution 4.0 International License,
                                        which permits use, sharing, adaptation, distribution and reproduction in any medium or format, as long as you give
                                        appropriate credit to the original author(s) and the source, provide a link to the Creative Commons licence, and indicate if
                                        changes were made. The images or other third party material in this article are included in the article's Creative Commons
                                        licence, unless indicated otherwise in a credit line to the material. If material is not included in the article's Creative Commons
                                        licence and your intended use is not permitted by statutory regulation or exceeds the permitted use, you will need to obtain
                                        permission directly from the copyright holder. To view a copy of this licence, visit http://creativecommons.org/licenses/by/4.0/.
                                        The Creative Commons Public Domain Dedication waiver (http://creativecommons.org/publicdomain/zero/1.0/) applies to the
                                        data made available in this article, unless otherwise stated in a credit line to the data.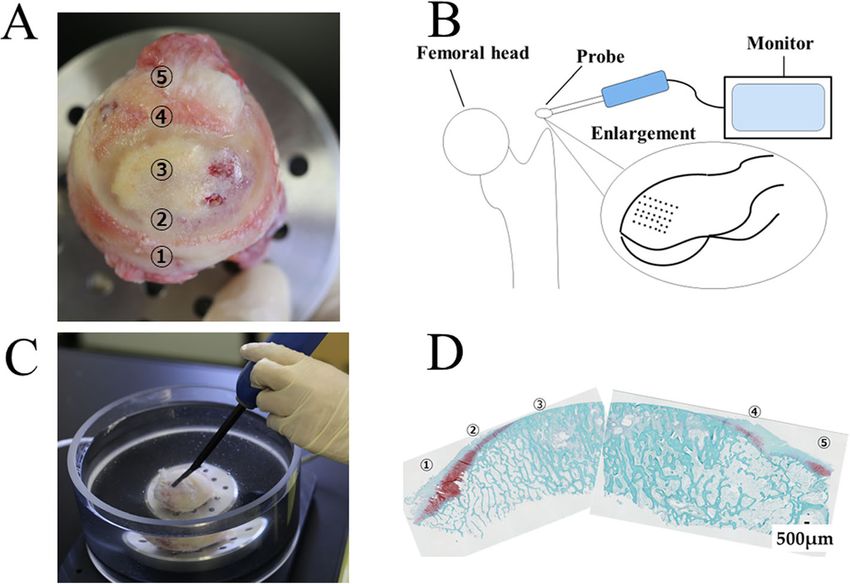
Ukai et al. Arthritis Research & Therapy   (2021) 23:227                                                         Page 2 of 10

Background                                                       microelectrodes with the help of the spherical indenter
Osteoarthritis (OA) is a common form of arthritis                of the tip. The effectiveness of the Arthro-BST for asses-
among older people, and the number of patients with              sing the properties of articular cartilage of the knee has
OA is increasing worldwide. Although OA is not a life-           been reported previously [28–31]. However, no study
threatening disease, it affects daily activities and quality     has evaluated the effectiveness of the Arthro-BST for
of life. Cartilage is one of the most difficult tissues to re-   assessing the hip by evaluating the macroscopic and
generate because of its avascular nature. Therefore, de-         histological properties simultaneously.
tecting early degeneration of articular cartilage is               This study aimed to evaluate the effectiveness of the
necessary for the prevention and treatment of OA. Vari-          Arthro-BST for evaluating the hip by comparing its find-
ous diagnostic methods, such as radiography [1], macro-          ings with macroscopic findings. We used the Inter-
scopic imaging [2], magnetic resonance imaging (MRI)             national Cartilage Repair Society (ICRS) classification
[3], and histological evaluation [4, 5], are used for evalu-     system [2] and histological findings such as the modified
ating OA.                                                        Mankin histological score [32] and Osteoarthritis Re-
   Although radiography is the most frequently used              search Society International (OARSI) histopathology as-
technique for evaluating OA through assessment of joint          sessment system [5].
space and osteophyte formation, this method cannot be
used to evaluate the macroscopic changes and properties          Methods
of articular cartilage. Arthroscopy is used widely for           Sample source
treating cartilage degeneration, and although it can be          Tissue was obtained from patients who had been diag-
used to assess cartilage degeneration directly, it cannot        nosed with OA or femoral fracture of the hip and who
be used to evaluate cartilage properties. MRI has re-            underwent total hip arthroplasty or bipolar hip arthro-
cently been used for assessing cartilage degeneration.           plasty at the authors’ institution. After resection of the
We have focused on the noninvasive assessment of car-            femoral head of the hip, 14 femoral heads of 13 patients
tilage degeneration and have reported the usefulness of          were evaluated (Table 1). This study was performed after
MRI for assessing knee OA using T2 mapping and diffu-            approval from the research review committee at the au-
sion tensor imaging [3]. Although MRI can be used to             thor’s institution (approval number: 18R-187). All pa-
assess cartilage degeneration noninvasively, it is difficult     tients provided written informed consent.
to assess cartilage degeneration when the cartilage dam-
age is of a mixed nature. Histological evaluation can be         Assessment procedure
used to assess cartilage degeneration accurately, but it         After resection of the femoral head, cartilage lesions
involves the destruction of normal cartilage.                    were assessed macroscopically using the ICRS classifica-
   To overcome these disadvantages, nondestructive de-           tion [2]. The same sites of cartilage lesions were assessed
vices have been developed to assess cartilage degener-           histologically using the modified Mankin score [32] and
ation [6–21]. We explored the literature on the                  OARSI grade [5].
assessment of cartilage degeneration that used laser-
induced photoacoustic measurement (LIPA) instruments             Macroscopic assessment
[21]. These devices can assess cartilage degeneration            After dissection of the femoral head, the assessment
without the need to collect tissue samples. We have pre-         points were marked with the help of photographs
viously compared LIPA with histological evaluation and           (Fig. 1). Two experienced orthopedic surgeons separ-
reported that LIPA can be used to assess cartilage de-           ately performed a macroscopic assessment of 14 fem-
generation and viscoelastic properties [21].                     oral heads. Sixty-one locations of the femoral head
   Articular cartilage contains proteoglycans that have          were used to assess the ICRS classification (Table 2).
electromechanical properties [22]. Interstitial water con-       Each femoral head was assessed for cartilage degener-
tains positive mobile ions, such as Na+ and K+, which            ation on the day of surgery.
balance the fixed negative electric charge from proteo-
glycans [22]. The mechanical compression of articular            Electromechanical assessment
cartilage generates streaming potentials induced by              The Arthro-BST measures streaming potentials gener-
water flowing out from articular cartilage [23], and these       ated during rapid compression of the articular cartilage
streaming potentials reflect cartilage integrity and degen-      with an array of 37 microelectrodes lying on a hemi-
eration [24–27]. Taking advantage of this property, the          spherical indenter (effective radius of the tip = 3.18 mm,
Arthro-BST instrument (Biomomentum, Laval, QC,                   5 microelectrodes/mm2) [29]. The device measures a
Canada) was invented for assessing the streaming poten-          quantitative parameter (QP), which corresponds to the
tials of articular cartilage. This apparatus is used during      number of microelectrodes in contact with the cartilage
arthroscopy and induces streaming potentials using 37            when the sum of all electrode potentials reaches 100 mV
Ukai et al. Arthritis Research & Therapy (2021) 23:227 Page 3 of 10
Table 1 Patient demographics
Patient number Age (years) Sex Body mass index (kg/m2) Diagnosis Kellgren–Lawrence classification
1 72 F 26.2 Osteoarthritis 3
2 57 F 24.4 Osteoarthritis 3
3 65 F 22 Osteoarthritis 3
4 60 F 34.9 Osteoarthritis 4
5 83 F 18.6 Osteoarthritis 4
6 74 F 23.7 Osteoarthritis 4
7 82 F 17.2 Femoral neck fracture 1
8 67 F 26 Osteoarthritis 3
9 84 F 23 Femoral neck fracture 1
10 64 F 23.1 Osteoarthritis 4
11 54 M 24.8 Osteoarthritis 4
12 70 F 27.4 Osteoarthritis 4
13 71 F 23.2 Femoral neck fracture 1
14 55 F 24.4 Osteoarthritis 3
[30]. A high QP indicates strong electromechanical using the Arthro-BST. Measurements were performed
properties and normal cartilage, and a low QP indicates on the day of surgery (Fig. 1).
weak electromechanical properties and degenerated
cartilage. Histological assessment
The resected femoral heads were placed onto a cylin- Twenty-five samples were used for histological assess-
drical platform and assembled into a testing chamber ment. Two experienced orthopedic surgeons separately
using screws. A single electromechanical measurement performed a histological assessment of each sample. The
was performed manually at each position of the grid tissue samples were cut into sections by making cuts
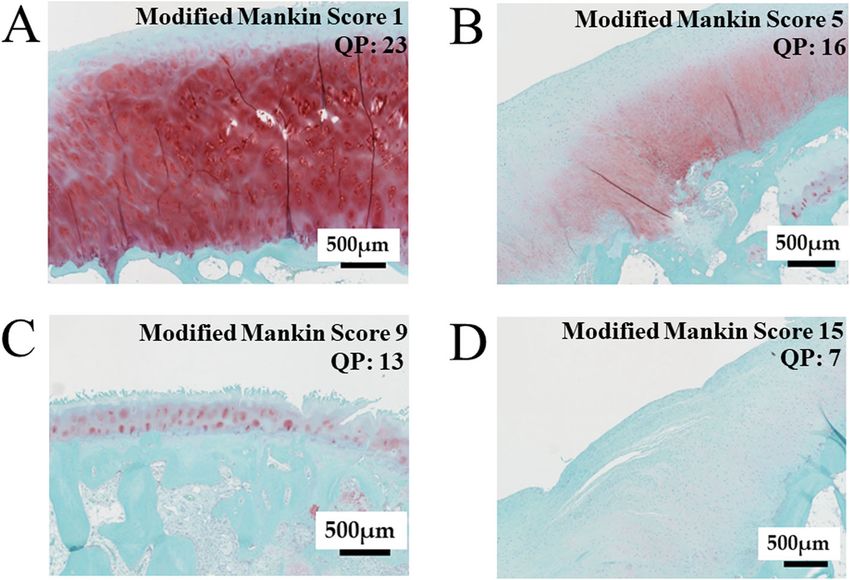
Fig. 1 Cartilage tissue assessment. A The ICRS classification was used to assess the cartilage of the femoral head (see Table 1 for the definition of
the grades). B Schematic drawing of the Arthro-BST. The Arthro-BST induces streaming potentials using 37 microelectrodes. C The Arthro-BST was
used to assess the same points assessed by the ICRS classification. D Cartilage sections were made by cutting perpendicular to the same points
assessed using the ICRS classification and Arthro-BST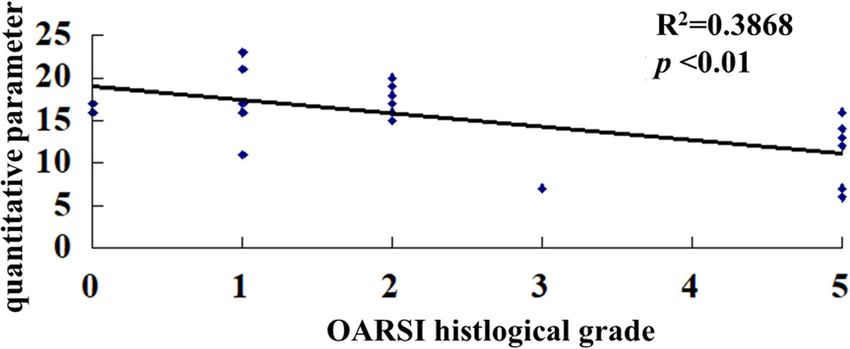
Ukai et al. Arthritis Research & Therapy       (2021) 23:227                                                                                     Page 4 of 10

Table 2 ICRS classification as described by Mainil-Varlet et al. [2]              BST QP and the ICRS grade, modified Mankin score, and
Grade               Property                                                      OARSI histological grade. Interobserver reliability was
1                   Superficial lesions, fissures and cracks, soft indentation    tested using intraclass correlation coefficients (ICCs), and
2                   Defects that extend to less than 50% in depth
                                                                                  their 95% confidence intervals (CIs) were used to assess the
                                                                                  reliability of the macroscopic and histological assessments.
3                   Defects that extend to more than 50% in depth
                                                                                  All tests were performed at a significance level of p < 0.05.
4                   Complete loss of cartilage thickness, bone only               Analyses were performed using IBM SPSS Statistics for
                                                                                  Windows version 26 (IBM Corp., Armonk, NY, USA).
perpendicular to the cartilage surface and then fixed in 4%
paraformaldehyde for 1 month. After decalcification for 2                         Results
months using distilled water (pH 7.4) containing 10% eth-                         Comparison between the Arthro-BST and the
ylenediaminetetraacetic acid, the tissue was embedded in                          macroscopic assessment results
paraffin wax and sectioned perpendicularly through the                            The ICRS grades of the cartilage lesion for all samples
center of the cartilage damage. Each section was stained                          were grade 1 (n = 23), grade 2 (n = 18), grade 3 (n = 13),
with Safranin O dye for histological evaluation of glycos-                        and grade 4 (n = 7). The interobserver reliability of the
aminoglycans [33]. For histological assessment, sections                          ICRS classification was 0.973 (95% CI, 0.956–0.984)
stained with Safranin O were assessed using the modified                          (Additional file 1). The QPs for the grades were as fol-
Mankin score [32] and the OARSI histopathology assess-                            lows: grade 1, 14.1 ± 5.5; grade 2, 15.6 ± 3.4; grade 3, 7.8
ment system (grade 0, surface intact, cartilage morphology                        ± 3.2; and grade 4, 2 ± 2.5. Significant differences were
intact; grade 1, surface intact; grade 2, surface discontinu-                     observed between grades 1 and 3 (p < 0.01), between
ity; grade 3, vertical fissures (clefts); grade 4, erosion; grade                 grades 1 and 4 (p < 0.01), between grades 2 and 3 (p <
5, denudation; grade 6, deformation) [5]. Two orthopedic                          0.01), and between grades 2 and 4 (p < 0.01) (Fig. 2).
surgeons of the Japanese Orthopedic Association inde-
pendently performed the histological assessment. The                              Relationship between the Arthro-BST QP and the
modified Mankin score was determined by adding the                                macroscopic assessment
scores of the parameters (structure, cellularity, matrix                          The QP decreased as the ICRS grade increased, and the
staining, and tidemark integrity), with 0 as the lowest                           correlation between these variables was significant (p <
score and 15 as the highest score (Table 3).                                      0.01) (Fig. 3).

Statistical analysis                                                              Relationship between the Arthro-BST and the histological
Kruskal–Wallis followed by the Bonferroni post hoc test                           assessment
was used to compare the ICRS grade and Arthro-BST re-                             Modified Mankin score: structure
sult (QP). Spearman’s rank correlational analysis was used                        The values for the structure parameter of the modified
to identify significant relationships between the Arthro-                         Mankin score were 0 (n = 3), 1 (n = 8), 2 (n = 6), 3 (n =
Table 3 Modified Mankin score for evaluation of articular cartilage degeneration as described by Henson and Vincent [32]
Score   Structure                                           Cellularity                                               Matrix staining        Tidemark
                                                                                                                                             integrity
Score   Smooth surface                                      Normal arrangement                                        Normal staining        Normal and
0                                                                                                                                            intact
        Normal appearance
Score   Roughened surface                                   Clustering in the superficial layer or loss of cells up   Slight loss of stain   Disrupted
1                                                           to 10%
        Single crack or area of delamination
Score   Multiple cracks                                     Disorganization or loss up to 25%                         Moderate loss of
2                                                                                                                     stain
        Moderate delamination
Score   Fragmentation in cartilage or severe                Cell rows absent or loss up to 50%                        Severe loss of stain
3       delamination
Score   Loss of fragments                                   Very few cells present                                    No stain present
4
Score   Complete erosion to tidemark
5
Score   Erosion beyond tidemark
6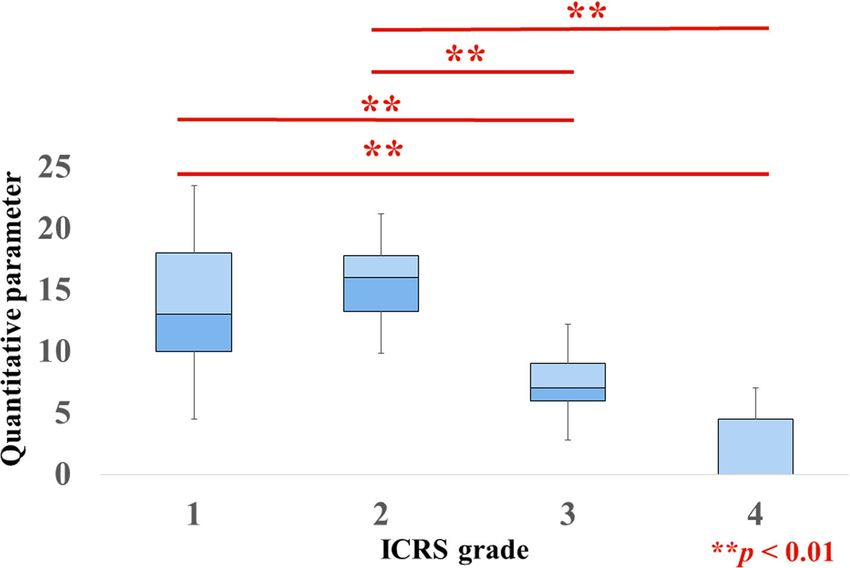
Ukai et al. Arthritis Research & Therapy    (2021) 23:227                                                                               Page 5 of 10

 Fig. 2 Arthro-BST assessment and ICRS classification. The QP decreased as the ICRS grade increased. Significant differences were observed for
 ICRS grades 1 and 3 (p < 0.01), grades 1 and 4 (p < 0.01), grades 2 and 3 (p < 0.01), and grades 2 and 4 (p < 0.01)

5), 4 (n = 1), 5 (n = 0), and 6 (n = 2). The interobserver                  4.4; score 2, 17.6 ± 2.2; score 3, 11.1 ± 4; and score
reliability of the score for structure was 0.877 (95% CI,                   4, 11.7 ± 4.5. The QP decreased as the cellularity
0.725–0.946) (Additional file 2). The QPs for the scores                    score increased, and the correlation between these
were as follows: score 0, 18 ± 2.6; score 1, 17.9 ± 3.3;                    was significant (p < 0.01) (Fig. 4).
score 2, 16 ± 2.6; score 3, 9.8 ± 4.4; score 4, 14; and
score 6, 9.5 ± 3.5. The QP decreased as the structure                       Matrix staining
score increased, and the correlation between these was                      The values for the matrix staining parameter of the
significant (p < 0.01) (Fig. 4).                                            modified Mankin score were 0 (n = 2), 1 (n = 10), 2
                                                                            (n = 8), 3 (n = 2), and 4 (n = 3). The interobserver
Cellularity                                                                 reliability for the matrix staining score was 0.874
The values for the cellularity parameter of the                             (95% CI, 0.717–0.944) (Additional file 2). The QPs for
modified Mankin score were 0 (n = 1), 1 (n = 10), 2                         the score were as follows: score 0, 20 ± 4.2; score 1,
(n = 5), 3 (n = 6), and 4 (n = 3). The interobserver                        15.9 ± 4; score 2, 14 ± 5; score 3, 13.5 ± 3.5; and
reliability of the cellularity score was 0.9 (95% CI,                       score 4, 11.7 ± 4.5. The QP decreased as the matrix
0.775–0.956) (Additional file 2). The QPs for the                           staining score increased, and the correlation between
scores were as follows: score 0, 16; score 1, 16.7 ±                        these was significant (p < 0.01) (Fig. 4).

 Fig. 3 Scatter plot of the correlation between the Arthro-BST results and the ICRS classification. Each diamond represents the QP according to
 the ICRS grade in an individual hip. A significant strong correlation was observed between the Arthro-BST and the ICRS classification (R2 = 0.4527)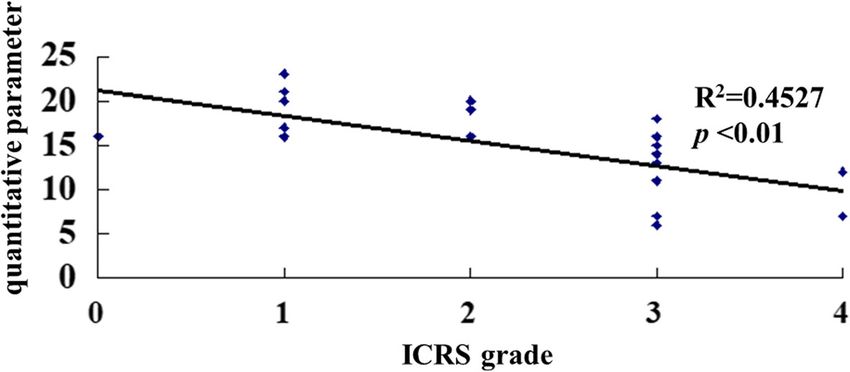
Ukai et al. Arthritis Research & Therapy      (2021) 23:227                                                                                     Page 6 of 10

 Fig. 4 Scatter plot of the correlations between the Arthro-BST and the modified Mankin score. Each diamond represents the QP values for the
 structure, cellularity, matrix staining, tidemark, and total score in an individual hip. The Arthro-BST result correlated significantly with structure (R2
 = 0.4034), cellularity (R2 = 0.2403), matrix staining (R2 = 0.1803), and total score (R2 = 0.2589)

Tidemark                                                                         for the grades were as follows: grade 0, 16.5 ± 0.7; grade
The values for the tidemark parameter of the modified                            1, 17.3 ± 4.2; grade 2, 17.6 ± 1.9; grade 3, 7; and grade 4,
Mankin score were 0 (n = 15) and 1 (n = 10). The inter-                          11 ± 3.8. The QP decreased as the OARSI grade in-
observer reliability for the tidemark score was 0.868                            creased, and the correlation between these was signifi-
(95% CI, 0.704–0.942) (Additional file 2). The QPs for                           cant (p < 0.01) (Fig. 6).
the scores were as follows: score 0, 15.1 ± 5.1; score 1,
14.7 ± 3.9. The correlation between the QP and the tide-                         Discussion
mark score was not significant (Fig. 4).                                         Our results demonstrated that the Arthro-BST can dis-
                                                                                 tinguish between ICRS grades 1 and 3, between grades 1
Total score                                                                      and 4, between grades 2 and 3, and between grades 2
The interobserver reliability of the total score was 0.93                        and 4. There was a significant correlation between the
(95% CI, 0.844–0.969) (Additional file 2). The QP de-                            Arthro-BST QP and the ICRS grades as well as between
creased as the total modified Mankin score increased,                            the Arthro-BST QP and the modified Mankin scores
and the correlation between these was significant (p <                           (structure, cellularity, matrix staining, total score) and
0.01) (Figs. 4 and 5).                                                           OARSI histological grade.
                                                                                    Various methods are used for the evaluation of cartil-
OARSI histological grade                                                         age degeneration. MRI has recently been used for the
The OARSI grades of cartilage lesions were as follows:                           evaluation of OA. We have previously reported that
grade 0 (n = 2), grade 1 (n = 6), grade 2 (n = 8), grade 3                       Outerbridge grades correlate with MRI variables such as
(n = 1), grade 4 (n = 0), and grade 5 (n = 8). The inter-                        diffusion tensor imaging and T2 mapping [3]. Although
observer reliability for the OARSI histological grade was                        the biggest advantage of MRI is its ability to assess car-
0.903 (95% CI, 0.782–0.957) (Additional file 3). The QPs                         tilage degeneration noninvasively, it is not capable of
Ukai et al. Arthritis Research & Therapy (2021) 23:227 Page 7 of 10 Fig. 5 Histological assessment: representative Safranin O-stained sections for four parameters of the modified Mankin score and the corresponding QP. A The modified Mankin score of the cartilage section was 1 (structure, 1; cellularity, 0; matrix staining, 0; tidemark, 0; total, 1). The QP of the same point was 23. B The modified Mankin score of the cartilage section was 5 (structure, 0; cellularity, 2; matrix staining, 2; tidemark, 1; total, 5). The QP of the same point was 16. C The modified Mankin score of the cartilage section was 9 (structure, 4; cellularity, 3; matrix staining, 2; tidemark, 0; total, 9). The QP of the same point was 13. D The modified Mankin score of the cartilage section was 15 (structure, 6; cellularity, 4; matrix staining, 4; tidemark, 1; total, 15). The QP of the same point was 7 assessing cartilage properties; hence, other methods that and 2, which seems reasonable because the ICRS grading can evaluate cartilage properties without the need to system cannot distinguish small differences in cartilage sample cartilage tissue are needed. damage [36] and because tissues affected by OA can Some studies have reported that the Arthro-BST QP have lesions with mixed grades of cartilage degeneration. correlates with the ICRS grade [29, 30, 34, 35] and Man- We did not measure cartilage thickness in this study, kin score [29, 30]. Although the Arthro-BST could not and we found no significant differences between ICRS distinguish ICRS grade 1 from 2 and grade 3 from 4 in grades 1 and 2 or between grades 3 and 4. However, a our results, the QP correlated significantly with the ICRS comparison of the Arthro-BST results and the ICRS grade. Similarly, Hadjab et al. [28] reported that the QP score is important. The Arthro-BST must be used under did not correlate significantly between ICRS grades 0 arthroscopy because the embedded sensors must be in Fig. 6 Scatter plot of the correlation between the Arthro-BST results and the OARSI histopathological score. Each diamond represents the QP according to the OARSI grade in an individual hip. A significant correlation was observed between the Arthro-BST results and the OARSI histopathological score (R2 = 0.3868)
Ukai et al. Arthritis Research & Therapy   (2021) 23:227                                                                        Page 8 of 10

direct contact with the cartilage. Although the Arthro-        early and moderate OA [2]. Subchondral bone changes
BST could not distinguish between ICRS grades 1 and 2          occur during the first stage of OA [48, 49], and these
or between grades 3 and 4 in our study, we consider that       changes affect the pathogenesis of OA [50–53]. Finnilä
this apparatus would be useful for hip OA because it can       et al. [54] reported a high correlation between the
distinguish early OA (ICRS grade 1) from moderate OA           OARSI grade and subchondral plate thickness. There-
(ICRS grade 2), early OA from severe OA (ICRS grade 3          fore, we used both histological scores in this study to as-
or 4), and moderate OA from severe OA.                         sess each stage of OA accurately. We found a significant
   Cartilage tissue is classified into articular or hyaline    correlation between the QP and the OARSI histological
cartilage and fibrous cartilage. Healthy articular cartilage   grade and that the Arthro-BST was able to assess all
comprises mainly hyaline cartilage, fibrous cartilage          grades of OA. Therefore, we believe that the Arthro-
comprises mainly type I collagen, and hyaline cartilage        BST is useful for the simultaneous evaluation of macro-
comprises mainly type II collagen. Fibrous cartilage is        scopic and cartilage properties. This device may also
frequently seen after injury and in degenerated cartilage      help in decision-making about the best method for car-
tissue. The deposition of fibrous cartilage in place of ar-    tilage regeneration and for assessing regenerating tissue.
ticular cartilage is an inferior change that can lead to          There are some limitations to this study. First, some
secondary OA. Distinguishing between fibrous and hya-          authors have already reported an association between
line cartilage is difficult when using only the ICRS classi-   the Arthro-BST results and the measures of OA. How-
fication, but assessing the composition of regenerative        ever, some of these authors have used cartilage from
tissue is necessary to prevent secondary OA. Chondro-          goats [31] or from human knees for evaluation [27–30].
cyte proliferation appears during the early stages of OA       To our knowledge, no studies have reported on the asso-
[37], and the proteoglycan content decreases before col-       ciations between the Arthro-BST results and OA mea-
lagen content decreases [37–39]. These changes induce          sures in human cartilage of the hip. In addition, other
fibrillation and fissures, which affect the mechanical         authors have used human cartilage that underwent
strength of articular cartilage [40, 41]. Therefore, it is     freeze–thaw cycles, which may have influenced the
important to determine whether the Arthro-BST results          macroscopic appearance and histological properties of
correlate with the histological data.                          the cartilage tissue. Second, the assessments of the ICRS
   As for the results of the histological assessment, some     classification score, modified Mankin score, and OARSI
authors have reported that the QP correlates signifi-          histological score varied somewhat, which may have af-
cantly with the total Mankin score [29, 30]. The Mankin        fected the results. However, the assessments were per-
score includes five parameters (structure, cellularity,        formed by two different evaluators, and all ICCs were >
matrix staining, tidemark, total score), and most reports      0.7, which indicates high reproducibility.
have assessed only the QP and total score. We found
that the total score and other parameters correlated sig-      Conclusions
nificantly with the QP (Fig. 4). We have previously stud-      The Arthro-BST can distinguish between ICRS grades 1
ied the effectiveness of LIPA [21]. LIPA is based on the       and 3, grades 1 and 4, grades 2 and 3, and grades 1 and
use of photoacoustic waves and can assess viscoelastic         3. The Arthro-BST findings correlated with the macro-
properties without sampling cartilage tissue. We previ-        scopic and histological assessment results. This appar-
ously reported that the LIPA results correlated strongly       atus may be helpful for performing macroscopic and
with the ICRS grade, although we found no correlation          histological assessments simultaneously, which may be
between the LIPA results and the overall Mankin score          useful for the noninvasive diagnosis of OA.
[21]. Compared with LIPA, the Arthro-BST QP had
                                                               Abbreviations
stronger correlations with the total score as well as with     CI: Confidence interval; ICC: Intraclass correlation coefficient;
structure, cellularity, and matrix staining. Therefore, we     ICRS: International Cartilage Repair Society; LIPA: Laser-induced pulse
believe that the Arthro-BST is preferable to the LIPA for      acoustic; MRI: Magnetic resonance imaging; OA: Osteoarthritis;
                                                               OARSI: Osteoarthritis Research Society International; QP: Quantitative
assessing cartilage degeneration.                              parameter
   Pritzker et al. [5] were the first to report the OARSI
histological system. Some studies have reported excellent      Supplementary Information
correlations between the Mankin score and the OARSI            The online version contains supplementary material available at https://doi.
histological grade [42–46]. Compared with the modified         org/10.1186/s13075-021-02611-x.
Mankin score, the OARSI histological grade focuses
                                                                Additional file 1. Individual scoring data of the ICRS classification.
more on structural parameters. The Mankin score does
                                                                Additional file 2. Individual scoring data of the modified Mankin score.
not have a staging component [42] and has limited use-
                                                                Additional file 3. Individual scoring data of the OARSI histopathological
fulness for assessing mild and moderate OA [47]. In             system.
contrast, the OARSI system can distinguish between
Ukai et al. Arthritis Research & Therapy (2021) 23:227 Page 9 of 10
Acknowledgements tissue-engineered cartilage. Tissue Eng. 2005;11(7–8):1234–43. https://doi.
The authors wish to acknowledge the Support Center for Medical Research org/10.1089/ten.2005.11.1234.
and Education of Tokai University Hospital for technical assistance. The 9. Ishihara M, Sato M, Ishihara M, Mochida J, Kikuchi M. Multifunctional
authors wish to acknowledge Professor Hiroyuki Kobayashi for statistical evaluation of tissue engineered cartilage using nano-pulsed light for
analysis advice. validation of regenerative medicine. In: Magjarevic R, Nagel JH, editors.
World Congress on Medical Physics and Biomedical Engineering 2006.
Authors’ contributions IFMBE Proceedings, vol. 14. Berlin: Springer; 2007. p. 3319–21. https://doi.
MS contributed to the conception and design of the study. TU, SW, and HO org/10.1007/978-3-540-36841-0_838.
acquired and analyzed the data. TU and SW performed the orthopedic 10. Ishihara M, Sato M, Kaneshiro N, Mitani G, Sato S, Ishihara M, et al.
surgery and graded the cartilage damage. SW and TT operated the Arthro- Development of a noninvasive multifunctional measurement method using
BST. TU, SW, and TT contributed to the interpretation of the data. TU wrote nanosecond pulsed laser for evaluation of regenerative medicine for
the first version of the manuscript, and all other authors revised it critically articular cartilage. Proc SPIE. 2006;6084:60840V. https://doi.org/10.1117/12.64
for important intellectual content. All authors have read and approved the 5888.
final manuscript. All authors agreed to be accountable for all aspects of the 11. Ishihara M, Sato M, Kaneshiro N, Mitani G, Nagai T, Kutsuna T, et al.
work. Usefulness and limitation of measurement methods for evaluation of
tissue-engineered cartilage function and characterization using
Funding nanosecond pulsed laser. Proc SPIE. 2007;6439:643909. https://doi.org/1
This work was supported by a grant from the Japan Orthopaedics and 0.1117/12.701489.
Traumatology Research Foundation (no. 458). 12. Ishihara M, Sato M, Mitani G, Mochida J, Kikuchi M. Monitoring of
extracellular matrix formation using nanosecond pulsed laser. J Inst Elect
Availability of data and materials Engnr Jpn. 2007;127(12):2166–70.
The datasets used and/or analyzed during the current study are available 13. Ishihara M, Sato M, Mochida J, Kikuchi M. Measurement and image
from the corresponding author on reasonable request. engineering for fundamental technology of regenerative medicine. In:
Akaike T, editor. Regeneration medicine 4: bioengineering for regeneration
Declarations medicine. Tokyo: Corona Publishing; 2007. p. 147–67.
14. Ishihara M, Sato M, Mochida J, Kikuchi M. Noninvasive measurement for the
Ethics approval and consent to participate evaluation and validation of regeneration medicine. J Biosci Biotechnol.
This study was performed in accordance with the Declaration of Helsinki and 2007;85:438–41.
its later amendments. The study was approved by the ethics committee of 15. Ishihara M, Sato M, Kutsuna T, Ishihara M, Mochida J, Kikuchi M. Modification
the Institutional Review Board (18R-187). Written informed consent was of measurement methods for evaluation of tissue engineered cartilage
obtained from all participants. function and biochemical properties using nanosecond pulsed laser. Proc
SPIE. 2008;6858:685805. https://doi.org/10.1117/12.762481.
Consent for publication 16. Ishihara M, Sato M, Kaneshiro N, Mitani G, Sato S, Mochida J. Development
Not applicable. of a photoacoustic measurement method for the evaluation of regenerative
medicine and tissue engineering for articular cartilage. J Jpn Soc Laser Surg
Competing interests Med. 2005;26(1):53–9. https://doi.org/10.2530/jslsm.26.53.
The authors declare that they have no competing interests. 17. Ishihara M, Sato M, Kaneshiro N, Mitani G, Sato S, Mochida J, et al.
Development of a diagnostic system for osteoarthritis using a
Received: 18 February 2021 Accepted: 20 August 2021 photoacoustic measurement method. Lasers Surg Med. 2006;38(3):249–55.
https://doi.org/10.1002/lsm.20285.
18. Kutsuna T, Sato M, Ishihara M, Furukawa KS, Nagai T, Kikuchi M, et al.
References Noninvasive evaluation of tissue-engineered cartilage with time-resolved
1. Altman RD, Fries JF, Bloch DA, Carstens J, Cooke TD, Genant H, et al. laser-induced fluorescence spectroscopy. Tissue Eng. 2010;16(3):365–73.
Radiographic assessment of progression in osteoarthritis. Arthritis Rheum. https://doi.org/10.1089/ten.tec.2009.0008.
1987;30(11):1214–25. https://doi.org/10.1002/art.1780301103. 19. Changoor A, Fereydoonzad L, Yaroshinsky A, Buschmann MD. Effects of
2. Mainil-Varlet P, Aigner T, Brittberg M, Bullough P, Hollander A, Hunziker E, refrigeration and freezing on the electromechanical and biomechanical
et al. Histological assessment of cartilage repair: a report by the Histology properties of articular cartilage. J Biomech Eng. 2010;132(6):064502. https://
Endpoint Committee of the International Cartilage Repair Society (ICRS). J doi.org/10.1115/1.4000991.
Bone Jt Surg Am. 2003;85-A(Suppl 2):45–57. 20. Changoor A, Coutu JP, Garon M, Quenneville E, Hurtig MB, Buschmann MD.
3. Ukai T, Sato M, Yamashita T, Imai Y, Mitani G, Takagaki T, et al. Diffusion Streaming potential-based arthroscopic device is sensitive to cartilage
tensor imaging can detect the early stages of cartilage damage: a changes immediately post-impact in an equine cartilage injury model. J
comparison study. BMC Musculoskelet Disord. 2015;16(1):35. https://doi. Biomech Eng. 2011;133(6):061005. https://doi.org/10.1115/1.4004230.
org/10.1186/s12891-015-0499-0. 21. Ukai T, Sato M, Ishihara M, Yokoyama M, Takagaki T, Mitani G, et al.
4. Mankin HJ, Dorfman H, Lippiello L, Zarins A. Biochemical and metabolic Usefulness of using laser-induced photoacoustic measurement and 3.0 Tesla
abnormalities in articular cartilage from osteo-arthritic human hips. II. MRI to assess knee cartilage damage: a comparison study. Arthritis Res Ther.
Correlation of morphology with biochemical and metabolic data. J Bone 2015;17:383.
Joint Surg Am. 1971;53(3):523–37. https://doi.org/10.2106/00004623-197153 22. Frank EH, Grodzinsky AJ. Cartilage electromechanics—1. Electrokinetic
030-00009. transduction and the effects of electrolyte pH and ionic strength. J
5. Pritzker KP, Gay S, Jimenez SA, Ostergaard K, Pelletier JP, Revell PA, et al. Biomech. 1987;20(6):615–27. https://doi.org/10.1016/0021-9290(87)90282-X.
Osteoarthritis cartilage histopathology: grading and staging. Osteoarthr 23. Buschmann MD, Grodzinsky AJ. A molecular model of proteoglycan-
Cartil. 2006;14(1):13–29. https://doi.org/10.1016/j.joca.2005.07.014. associated electrostatic forces in cartilage mechanics. J Biomech Eng. 1995;
6. Ishihara M, Sato M, Sato S, Kikuchi T, Fujikawa K, Kikuchi M. Viscoelastic 117(2):179–92. https://doi.org/10.1115/1.2796000.
characterization of biological tissue by photoacoustic measurement. Jpn J 24. Bonassar LJ, Jeffries KA, Paguio CG, Grodzinsky AJ. Cartilage degradation
Appl Phys. 2003;42(5B):L556–8. https://doi.org/10.1143/JJAP.42.L556. and associated changes in biochemical and electromechanical properties.
7. Ishihara M, Sato M, Sato S, Kikuchi T, Mitani G, Kaneshiro N, et al. Usefulness Acta Orthop Scand Suppl. 1995;66(Suppl 266):38–44. https://doi.org/10.31
of the photoacoustic measurement method for monitoring the 09/17453679509157645.
regenerative process of full-thickness defects in articular cartilage using 25. Frank EH, Grodzinsky AJ, Koob TJ, Eyre DR. Streaming potentials: a sensitive
tissue-engineering technology. Proc SPIE. 2005;5695. https://doi.org/10.111 index of enzymatic degradation in articular cartilage. J Orthop Res. 1987;
7/12.591890. 5(4):497–508. https://doi.org/10.1002/jor.1100050405.
8. Ishihara M, Sato M, Sato S, Kikuchi T, Mochida J, Kikuchi M. Usefulness of 26. Légaré A, Garon M, Guardo R, Savard P, Poole AR, Buschmann MD.
photoacoustic measurements for evaluation of biomechanical properties of Detection and analysis of cartilage degeneration by spatially resolvedUkai et al. Arthritis Research & Therapy (2021) 23:227 Page 10 of 10
streaming potentials. J Orthop Res. 2002;20(4):819–26. https://doi.org/10.101 44. Pearson RG, Kurien T, Shu KS, Scammell BE. Histopathology grading systems
6/S0736-0266(02)00002-5. for characterisation of human knee osteoarthritis–reproducibility, variability,
27. Sim S, Chevrier A, Garon M, Quenneville E, Lavigne P, Yaroshinsky A, reliability, correlation, and validity. Osteoarthr Cartil. 2011;19(3):324–31.
et al. Electromechanical probe and automated indentation maps are https://doi.org/10.1016/j.joca.2010.12.005.
sensitive techniques in assessing early degenerated human articular 45. Rout R, McDonnell S, Benson R, Athanasou N, Carr A, Doll H, et al. The
cartilage. J Orthop Res. 2017;35(4):858–67. https://doi.org/10.1002/ histological features of anteromedial gonarthrosis—the comparison of two
jor.23330. grading systems in a human phenotype of osteoarthritis. Knee. 2011;18(3):
28. Hadjab I, Sim S, Karhula SS, Kauppinen S, Garon M, Quenneville E, et al. 172–6. https://doi.org/10.1016/j.knee.2010.04.010.
Electromechanical properties of human osteoarthritic and asymptomatic 46. Waldstein W, Perino G, Gilbert SL, Maher SA, Windhager R, Boettner F.
articular cartilage are sensitive and early detectors of degeneration. OARSI osteoarthritis cartilage histopathology assessment system: a
Osteoarthr Cartil. 2018;26(3):405–13. https://doi.org/10.1016/j.joca.2017.12. biomechanical evaluation in the human knee. J Orthop Res. 2016;34(1):135–
002. 40. https://doi.org/10.1002/jor.23010.
29. Sim S, Chevrier A, Garon M, Quenneville E, Yaroshinsky A, Hoemann CD, 47. Ostergaard K, Andersen CB, Petersen J, Bendtzen K, Salter DM. Validity
et al. Non-destructive electromechanical assessment (Arthro-BST) of human of histopathological grading of articular cartilage from osteoarthritic
articular cartilage correlates with histological scores and biomechanical knee joints. Ann Rheum Dis. 1999;58(4):208–13. https://doi.org/10.1136/a
properties. Osteoarthr Cartil. 2014;22(11):1926–35. https://doi.org/10.1016/j. rd.58.4.208.
joca.2014.08.008. 48. Burr DB, Gallant MA. Bone remodelling in osteoarthritis. Nat Rev Rheumatol.
30. Sim S, Hadjab I, Garon M, Quenneville E, Lavigne P, Buschmann MD. 2012;8(11):665–73. https://doi.org/10.1038/nrrheum.2012.130.
Development of an electromechanical grade to assess human knee articular 49. Radin EL, Paul IL, Tolkoff MJ. Subchondral bone changes in patients with
cartilage quality. Biomed Eng. 2017;45(10):2410–21. early degenerative joint disease. Arthritis Rheum. 1970;13(4):400–5. https://
31. Mickevicius T, Pockevicius A, Kucinskas A, Gudas R, Maciulaitis J, Noreikaite doi.org/10.1002/art.1780130406.
A, et al. Impact of storage conditions on electromechanical, histological and 50. Burr DB. Anatomy and physiology of the mineralized tissues: role in the
histochemical properties of osteochondral allografts. BMC Musculoskelet pathogenesis of osteoarthrosis. Osteoarthr Cartil. 2004;12(Suppl A):S20–30.
Disord. 2015;16(1):314. https://doi.org/10.1186/s12891-015-0776-y. 51. Goldring MB, Goldring SR. Articular cartilage and subchondral bone in the
32. Henson FMD, Vincent TA. Alterations in the vimentin cytoskeleton in pathogenesis of osteoarthritis. Ann N Y Acad Sci. 2010;1192(1):230–7.
response to single impact load in an in vitro model of cartilage damage in https://doi.org/10.1111/j.1749-6632.2009.05240.x.
the rat. BMC Musculoskelet Disord. 2008;9(1):94. https://doi.org/10.1186/14 52. Castañeda S, Roman-Blas JA, Largo R, Herrero-Beaumont G. Subchondral
71-2474-9-94. bone as a key target for osteoarthritis treatment. Biochem Pharmacol. 2012;
33. Takaku Y, Murai K, Ukai T, Ito S, Kokubo M, Satoh M, et al. In vivo cell 83(3):315–23. https://doi.org/10.1016/j.bcp.2011.09.018.
tracking by bioluminescence imaging after transplantation of bioengineered 53. Li G, Yin J, Gao J, Cheng TS, Pavlos NJ, Zhang C, et al. Subchondral bone in
cell sheets to the knee joint. Biomaterials. 2014;35(7):2199–206. https://doi. osteoarthritis: insight into risk factors and microstructural changes. Arthritis
org/10.1016/j.biomaterials.2013.11.071. Res Ther. 2013;15(6):223. https://doi.org/10.1186/ar4405.
34. Abedian R, Willbold E, Becher C, Hurschler C. In vitro electro-mechanical 54. Finnilä MAJ, Thevenot J, Aho OM, Tiitu V, Rautiainen J, Kauppinen S, et al.
characterization of human knee articular cartilage of different degeneration Association between subchondral bone structure and osteoarthritis
levels: a comparison with ICRS and Mankin scores. J Biomech. 2013;46(7): histopathological grade. J Orthop Res. 2017;35(4):785–92. https://doi.org/1
1328–34. https://doi.org/10.1016/j.jbiomech.2013.02.004. 0.1002/jor.23312.
35. Becher C, Ricklefs M, Willbold E, Hurschler C, Abedian R. Electromechanical
assessment of human knee articular cartilage with compression-induced Publisher’s Note
streaming potentials. Cartilage. 2016;7(1):62–9. https://doi.org/10.1177/194 Springer Nature remains neutral with regard to jurisdictional claims in
7603515599191. published maps and institutional affiliations.
36. Spahn G, Klinger HM, Baums M, Pinkepank U, Hofmann GO. Reliability in
arthroscopic grading of cartilage lesions: results of a prospective blinded
study for evaluation of inter-observer reliability. Arch Orthop Trauma Surg.
2011;131(3):377–81. https://doi.org/10.1007/s00402-011-1259-8.
37. Pearle AD, Warren RF, Rodeo SA. Basic science of articular cartilage and
osteoarthritis. Clin Sports Med. 2005;24(1):1–12. https://doi.org/10.1016/j.
csm.2004.08.007.
38. Lark MW, Bayne EK, Flanagan J, Harper CF, Hoerrner LA, Hutchinson NI, et al.
Aggrecan degradation in human cartilage. Evidence for both matrix
metalloproteinase and aggrecanase activity in normal, osteoarthritic, and
rheumatoid joints. J Clin Invest. 1997;100(1):93–106. https://doi.org/10.1172/
JCI119526.
39. Martel-Pelletier J, Boileau C, Pelletier JP, Roughley PJ. Cartilage in normal
and osteoarthritis conditions. Best Pract Res Clin Rheumatol. 2008;22(2):351–
84. https://doi.org/10.1016/j.berh.2008.02.001.
40. Poole AR, Kobayashi M, Yasuda T, Laverty S, Mwale F, Kojima T, et al. Type II
collagen degradation and its regulation in articular cartilage in
osteoarthritis. Ann Rheum Dis. 2002;61(Suppl 2):ii78–81.
41. Silver FH, Bradica G, Tria A. Elastic energy storage in human articular
cartilage: estimation of the elastic modulus for type II collagen and changes
associated with osteoarthritis. Matrix Biol. 2002;21(2):129–37. https://doi.
org/10.1016/S0945-053X(01)00195-0.
42. Pauli C, Whiteside R, Heras FL, Nesic D, Koziol J, Grogan SP, et al.
Comparison of cartilage histopathology assessment systems on human
knee joints at all stages of osteoarthritis development. Osteoarthr Cartil.
2012;20(6):476–85. https://doi.org/10.1016/j.joca.2011.12.018.
43. Custers RJ, Creemers LB, Verbout AJ, van Rijen MH, Dhert WJA, Saris DBF.
Reliability, reproducibility and variability of the traditional Histologic/
Histochemical Grading System vs the new OARSI Osteoarthritis Cartilage
Histopathology Assessment System. Osteoarthr Cartil. 2007;15(11):1241–8.
https://doi.org/10.1016/j.joca.2007.04.017.You can also read