Technical note: Measurement of chemically resolved volume equivalent diameter and effective density of particles by AAC-SPAMS
←
→
Page content transcription
If your browser does not render page correctly, please read the page content below
Atmos. Chem. Phys., 21, 5605–5613, 2021
https://doi.org/10.5194/acp-21-5605-2021
© Author(s) 2021. This work is distributed under
the Creative Commons Attribution 4.0 License.

Technical note: Measurement of chemically resolved
volume equivalent diameter and effective density of
particles by AAC-SPAMS
Long Peng1,2 , Lei Li4 , Guohua Zhang1,3 , Xubing Du4 , Xinming Wang1,3 , Ping’an Peng1,3 , Guoying Sheng1 , and
Xinhui Bi1,3
1 State Key Laboratory of Organic Geochemistry and Guangdong Provincial Key Laboratory of Environmental Protection and
Resources Utilization, Guangzhou Institute of Geochemistry, Chinese Academy of Sciences, Guangzhou 510640, China
2 University of Chinese Academy of Sciences, Beijing 100049, China
3 Guangdong-Hong Kong-Macao Joint Laboratory for Environmental Pollution and Control, Guangzhou 510640, China
4 Institute of Mass Spectrometer and Atmospheric Environment, Jinan University, Guangzhou 510632, China

Correspondence: Xinhui Bi (bixh@gig.ac.cn) and Guohua Zhang (zhanggh@gig.ac.cn)

Received: 7 October 2020 – Discussion started: 26 October 2020
Revised: 26 February 2021 – Accepted: 2 March 2021 – Published: 12 April 2021

Abstract. Size and effective density (ρe ) are important prop-      1   Introduction
erties of aerosol particles and are related to their influences
on human health and the global climate. The volume equiv-           Size and particle density (ρp ) are critical parameters of
alent diameter (Dve ) is an intrinsic property that is used to      aerosol particles in quantifying the impact of aerosols on air
evaluate particle size. Three definitions of ρe are generally       quality, human health and global climate change (Buseck and
used to characterize the physical property of a particle as an      Posfai, 1999; Pöschl, 2005; Pitz et al., 2003). Effective den-
alternative to particle density, in which only the ρeII , defined   sity (ρe ) has been adopted to characterize the physical prop-
as the ratio of particle density (ρp ) to a dynamic shape fac-      erty of a particle as an alternative to ρp , since ρp for aspheri-
tor (χ), has the characteristic of being independent of par-        cal aerosol particles is hardly measured (Sumlin et al., 2018;
ticle size. However, it is still challenging to simultaneously      Katrib et al., 2005). Size and ρe govern the transport proper-
characterize the Dve and ρeII of aspherical particles. Here, we     ties of a particle both in the atmosphere and in the human res-
present a novel system that classifies particles with their aero-   piratory system (Seinfeld and Pandis, 1998; Liu and Daum,
dynamic diameter (Da ) by aerodynamic aerosol classifier            2008) and directly and/or indirectly influence the potential of
(AAC) and determines their vacuum aerodynamic diameter              the particle to absorb or reflect solar radiation (Tang, 1997;
(Dva ) by single-particle aerosol mass spectrometry (SPAMS)         Zhao et al., 2019; Liu and Daum, 2008). ρe can also pro-
to achieve a measurement of Dve and ρeII . The reliability of       vide information concerning particle morphology (Yon et al.,
the AAC-SPAMS system for accurately obtaining Dve and               2015) and serve as a tracer for atmospheric processing (Guo
ρeII is verified based on the result that the deviation between     et al., 2014; Yin et al., 2015; Liu et al., 2015). However, the
the measured and theoretical values is less than 6 % for the        quantitative relationship between aerosol properties, namely
size-resolved spherical polystyrene latex (PSL). The AAC-           size and ρe , and their effects on air quality, human health, and
SPAMS system was applied to characterize the Dve and ρeII           global climate change are not yet well understood, which is
of (NH4 )2 SO4 and NaNO3 particles, suggesting that these           partly because important aerosol properties cannot be mea-
particles are aspherical and their ρeII is independent of parti-    sured by current techniques.
cle size. Finally, the AAC-SPAMS system was deployed in a
field measurement, showing that it is a powerful technique to
characterize the chemically resolved Dve and ρeII of particles
in real time.

Published by Copernicus Publications on behalf of the European Geosciences Union.
5606                                        L. Peng et al.: Measurement of volume equivalent diameter and effective density

1.1     Size                                                             Equation (7) is derived from combining Eq. (1) with
                                                                      Eq. (4), in which mp is equal to 1/6ρ · Dve      3 . The detailed
Size is a fundamental property of particles and can be pa-            derivation of Eq. (8) is presented in Schneider et al. (2006).
rameterized by the physical quantity of volume equivalent             A variety of methods are developed to characterize ρeI
diameter (Dve ). Defined as the diameter of a spherical par-          and ρeIII , among which the more advanced methods are to
ticle with the same volume as the particle (DeCarlo et al.,           achieve the measurement of the chemically resolved effec-
2004), Dve is an intrinsic physical quantity that can be used         tive density. Combining a single-particle soot photometer
to evaluate the actual size of the particle. However, to date,        (SP2) with a (volatility) tandem differential mobility ana-
atmospheric science usually describes particle size by other          lyzer ((VT)DMA) can measure the ρeI of particles mixed
diameter definitions, such as the electric mobility diameter          with soot (Y. Zhang et al., 2016; Wu et al., 2019; Han et
(Dm ), aerodynamic equivalent diameter (Da ), and vacuum              al., 2019). The measurement of chemically resolved ρeIII can
aerodynamic equivalent diameter (Dva ), whose relationships           be achieved by coupling a DMA with an online aerosol
with Dve are shown in Eqs. (1)–(3), respectively:                     mass spectrometer such as the Single-Particle Laser Abla-
  Dm          Dve                                                     tion Time-of-Flight Mass Spectrometer (SPLAT) (Zelenyuk
        =             χt ,                                     (1)    et al., 2005, 2006; Alexander et al., 2016), aerosol mass
Cc (Dm ) Cc (Dve )
         s                                                            spectrometer (AMS) (Dinar et al., 2006; Schneider et al.,
             ρp Cc (Dve )                                             2006; Kiselev et al., 2010), aerosol time-of-flight mass spec-
Da = Dve                      ,                                (2)
           χt · ρ0 · Cc (Da )                                         trometer (ATOFMS) (Spencer and Prather, 2006; Spencer
      ρp Dve                                                          et al., 2007), and single-particle aerosol mass spectrometry
Dva =        ,                                                 (3)    (SPAMS) (G. Zhang et al., 2016; Zhai et al., 2017). However,
      ρ0 χv
                                                                      the ρeI and ρeIII are demonstrated to have the inherent char-
where Cc (D) is the Cunningham slip correction factor, χt             acteristic of decreasing with increasing particle size, which
and χv represent the aerosol dynamic shape factor (χ) in the          will be presented in a separate publication. Therefore, it will
transition regime and in the free-molecule regime, respec-            introduce systemic error when assessing the particle’s im-
tively, and ρ0 represents the unit density of 1.0 g/cm3 . From        pact on visibility, human health, and climate change from the
these definitions, it can be seen that Dm , Da , and Dva are          physical quantities in ρeI and ρeIII . In contrast, ρeII is indepen-
originally derived from Dve , but in actuality they do not re-        dent of particle size. For example, for soot particles with χ of
flect the actual size of the aspherical particle. Meanwhile,          2.5 and ρp of 1.80 g/cm3 , the calculated ρeI , ρeII , and ρeIII are
Dve of aspherical particles cannot be easily obtained, which          0.43, 0.72, and 0.45 g/cm3 at Dm of 40 nm and 0.22, 0.72,
limits its application in the scientific community.                   and 0.36 g/cm3 at Dm of 550 nm, respectively. The big gap
                                                                      between the three definitions of effective density suggests
1.2     Effective density
                                                                      that they should be carefully treated when characterizing the
At present, three definitions of ρe are introduced in atmo-           particles. However, the ρeII has not been widely applied in at-
spheric science (DeCarlo et al., 2004): the first definition (ρeI )   mospheric sciences because of the lack of measurement tech-
is the ratio of the measured particle mass (mp ) to the parti-        niques. Previous literature has tried to retrieve the ρeII and the
cle volume (V ) calculated assuming a spherical particle with         real part in the refractive index (n) through a fitting proce-
a diameter equal to the measured Dm , the second definition           dure that compares the measured light-scattering intensity of
(ρeII ) is the ratio of ρp to χ (Hand and Kreidenweis, 2002),         particles (Rmeas ) to the theoretical values (Rtheory,test ) calcu-
and the third definition (ρeIII ) is the ratio of Dm and Dva , ex-    lated by a series of n and ρeII values (Moffet and Prather,
pressed in Eqs. (4)–(6), respectively.                                2005; Moffet et al., 2008; G. Zhang et al., 2016). Moffet and
                                                                      Prather (2005) successfully obtained ρeII for spherical par-
        6mp                                                           ticles via single-particle mass spectrometry. However, sub-
ρeI =      3
             ,                                                 (4)
       π Dm                                                           ject to the accuracy of Mie theory for the aspherical parti-
        ρp                                                            cles, dry NaCl and calcium-rich dust particles failed to fit
ρeII = ,                                                       (5)
        χ                                                             the Rtheory,test well to Rmeas (Moffet et al., 2008). Similarly,
         Dva                                                          G. Zhang et al. (2016) failed to simultaneously retrieve ρeII
ρeIII =      ρ0 .                                              (6)    and n for (NH4 )2 SO4 and NaNO3 particles. To the best of
         Dm
                                                                      our knowledge, there is no appropriate technique to achieve
The definitions of ρeI and ρeIII can be derived into their final      the measurement of ρeII for aspherical particles.
forms, as shown in the Eqs. (7) and (8), respectively.                   The aim of the present work is to develop a method to
        ρ

             Cc (Dve ) 3
                                                                     simultaneously obtain Dve and ρeII for aspherical particles.
  I
ρe = 3 ·                                                     (7)      For simplicity, the symbol ρe in the following text refers to
       χt    Cc (Dm )
                                                                      the definition of ρeII . The established system of aerodynamic
            Cc (Dve )
ρeIII = ρ · 2                                                (8)      aerosol classifier single-particle aerosol mass spectrometry
           χ · Cc (Dm )                                               (AAC-SPAMS) is capable of characterizing the Da and Dva

Atmos. Chem. Phys., 21, 5605–5613, 2021                                                  https://doi.org/10.5194/acp-21-5605-2021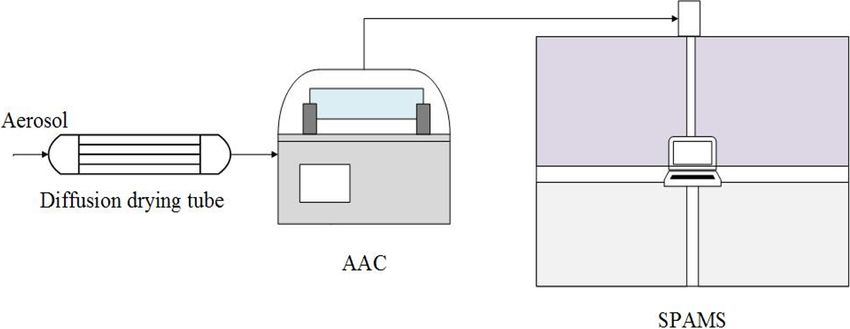
L. Peng et al.: Measurement of volume equivalent diameter and effective density                                                5607

                                                                      into the vacuum system through a 0.1 mm critical orifice and
                                                                      are gradually collimated into a beam in the aerodynamic lens.
                                                                      Two continuous diode Nd:YAG laser beams (532 nm) are
                                                                      used to aerodynamically size the particles, which are subse-
                                                                      quently desorbed and ionized by a pulsed laser (266 nm) that
                                                                      is triggered based on the velocity of a specific particle. The
                                                                      generated positive and negative ions are recorded with the
                                                                      corresponding particle size. The Dva of the particle is related
                                                                      to the transit time between the two laser beams (532 nm) in
Figure 1. Schematic diagram of the AAC-SPAMS system
                                                                      SPAMS, which can be obtained by using a calibration curve
(0.3 L/min). The diffusion drying tube is filled with orange silica
gel, which reduces the RH to 5 %–15 %.
                                                                      generated from the measured transit times of a PSL series
                                                                      with predefined sizes (nominal diameters).

of particles, which can be applied to theoretically derive Dve        2.2   Laboratory experiments
and ρe . To verify the reliability of the AAC-SPAMS system,
we apply it to measure the Dve and ρe of the spherical parti-         Dried spherical PSL (Nanosphere Size Standards, Duke Sci-
cles of polystyrene latex (PSL). The results are in good agree-       entific Corp., Palo Alto) (ρp = 1.055 g/cm3 and χ = 1.0)
ment with the theoretical values. Finally, the AAC-SPAMS              with Dve values of 203 ± 5, 310 ± 6, 510 ± 5, and 740 ± 6 nm
system is applied to measure the Dve and ρe for (NH4 )2 SO4           were used in the AAC-SPAMS system, and the Dve was
and NaNO3 particles and for the chemically resolved atmo-             verified by Scanning Mobility Particle Sizer (Model 3938,
spheric particles.                                                    TSI Inc., USA). The PSL particles were first classified by
                                                                      AAC, and then their Dva values were obtained by SPAMS.
2     Experimental section                                            ACC-SPAMS was also applied to the particles of (NH4 )2 SO4
                                                                      (ρp = 1.77 g/cm3 ) and NaNO3 (ρp = 2.26 g/cm3 ) with Da
2.1    Measurement system                                             values of 250.0, 350.0, 450.0, and 550.0 nm. Besides, to ob-
                                                                      tain the measurement uncertainty of the AAC, the Da val-
Figure 1 shows a schematic diagram of the AAC-SPAMS                   ues of these PSL particles were measured to be 212.8 ± 0.2,
system. The particles are first dried by a diffusion drying tube      324.7 ± 0.4, 529.9 ± 0.4, and 767.5 ± 0.4 by the system of
(TSI 9302, USA), classified by AAC (Cambustion Ltd., UK)              AAC condensation particle counter (CPC), respectively. It
based on the Da , and then transported into SPAMS, where              shows that the AAC has the deviations of 1.1 %, 1.3 %, 0.8 %,
the Dva and the mass spectra of individual particles are ob-          and 0.7 % for determining the Da values of the particles.
tained. The working principle of the AAC is described in
detail elsewhere (Tavakoli and Olfert, 2013). AAC consists            2.3   Ambient sampling
of two coaxial cylinders that rotate at the same rotational
speed. Polydisperse particles enter into the space between
                                                                      For field observations, the AAC-SPAMS system was de-
the cylinders (i.e., the classification column) and experience
                                                                      ployed in Science and Technology Enterprise Accelerator A2
a centrifugal force that causes them to move toward the outer
                                                                      Block, Guangzhou, China, to characterize the Dve , ρe , and
cylinder. The particles to be classified can leave the clas-
                                                                      chemical compositions of aerosol particles. The sampling in-
sification column with the particle-free sheath flow and fi-
                                                                      let was hung 2.5 m from the third floor (∼ 12 m above ground
nally exit the AAC with the sample flow. Thus, the Da values
                                                                      level). Ambient aerosol particles were introduced into the
of classified particles can be derived from their relationship
                                                                      AAC through a 5 m long conductive silicone tube with an
with their relaxation time (τ ), as shown in Eq. (9):
                                                                      inner diameter of 6 mm and a PM2.5 cyclone inlet. The sam-
      Cc (Da ) · ρ0 · Da2                                             pling flow from the PM2.5 cyclone inlet was 3 L/min, and the
τ=                        ,                                    (9)    residence time in the conductive silicone tube was approxi-
           18µ
                                                                      mately 5 s. Particles with the Da of 250.0, 350.0, 450.0, and
where µ is the gas dynamic viscosity. Particles with large re-        550.0 nm were classified by the AAC. The sampling time for
laxation times impact and adhere to the outer cylinder, while         the particles of each Da was approximately 10 min. From 6–
particles with small relaxation times exit the classifier with        8 July 2019, approximately 129 869 ionized particles were
the exhaust flow. In this study, the exhaust flow from the AAC        obtained from nine rounds of measurement. The sampling
was about 0.3 L/min, and the size resolution parameter of the         details are shown in Table S1 in the Supplement. The num-
AAC was set as 40.                                                    ber of ionized particles with the Da of 250.0, 350.0, 450.0,
   Detailed information about the operation of SPAMS                  and 550.0 nm is 35 609, 38 374, 31 910, and 23 976, respec-
(Hexin Analytical Instrument Co., Ltd., China) is given else-         tively. The sampled ∼ 100 000 particles are first classified by
where (Li et al., 2011). Briefly, the particles are introduced        using an adaptive resonance theory neural network (ART-2a)

https://doi.org/10.5194/acp-21-5605-2021                                               Atmos. Chem. Phys., 21, 5605–5613, 2021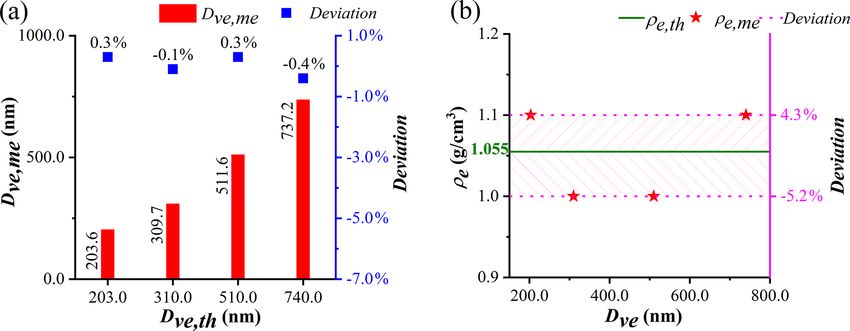
5608 L. Peng et al.: Measurement of volume equivalent diameter and effective density
(Song et al., 1999) with a vigilance factor of 0.75, a learning in the Supplement. Gaussian fitting is used to obtain the peak
rate of 0.05, and 20 iterations. Dva for each size PSL with R 2 fitting coefficient over 0.98.
Each fitting has a full width at half maximum (FWHM) of
2.4 Theoretical derivation of Dve and ρe from Da and 6.6 %, 4.4 %, 2.3 %, and 2.2 %, and the corresponding peaks
Dva are 215.8, 319.0, 532.1, and 803.5 nm, respectively. Substi-
tuting the Da and Dva values of PSL into Eq. (11), the mea-
In this study, the calculations of Dve and ρe for unknown par- sured Dve (Dve,me ) of PSL from the AAC-SPAMS system
ticles are theoretically derived from Da and Dva . Combining is 203.6, 309.7, 511.6, and 737.2 nm, respectively (Fig. 2a).
Eqs. (2) and (3), we obtain Eq. (10): Thus, the deviations between the theoretical Dve (Dve,th ) and
Da2 χv Dve,me values are 0.3 %, −0.1 %, 0.3 %, and −0.4 %, re-
Cc (Da ) = Dve Cc (Dve ) . (10) spectively. On the other hand, the measured ρe (ρe,me ) val-
Dva χt
ues of the particles, calculated from the Dva and Dve,me val-
Based on the approximation between χv and χt (χv ≈ χt = ues with Eq. (14), are 1.1, 1.0, 1.0, and 1.1 g/cm3 , respec-
χa ) (DeCarlo et al., 2004), Eq. (10) becomes Eq. (11): tively (Fig. 2b). Comparing to the theoretical ρe (ρe,th ) (i.e.,
1.055 g/cm3 of PSL particles), the deviations of ρe,me are de-
Da2 termined to be 4.3 %, −5.2 %, −5.2 %, and 4.3 %, respec-
Cc (Da ) = Dve Cc (Dve ). (11)
Dva tively. That is, the deviations of Dve,me and ρe,me obtained
The Cunningham slip correction factor is calculated by by the AAC-SPAMS system are within 1 % and 6 %, respec-
Eq. (12) (Peng and Bi, 2020): tively.
λ C ·D 3.2 Application of the AAC-SPAMS system for
Cc (D) = 1 + A + B · exp , (12)
D λ obtaining Dve and ρe of (NH4 )2 SO4 and NaNO3
where λ is the mean free path of the gas molecules and A, B, Figure S2 shows the Dva distributions of (NH4 )2 SO4 and
and C are empirically determined constants specific to the NaNO3 particles with Da values of 250.0, 350.0, 450.0, and
analysis system. The values of A, B ,and C are 2.33, 0.966, 550.0 nm screened by the AAC. The Dva peaks are obtained
and −0.498 provided by the manual of the AAC, respec- by Gaussian fitting, with R 2 values over 0.93 and FWHM
tively. Substituting Eq. (12) into Eq. (11) obtains Eq. (13). values ranging from 7.6 % to 10.6 %. The (NH4 )2 SO4 par-
Da2 Da · λ
C · Da
ticles have Dva values of 300.0, 418.0, 551.1, and 695.1 nm
+ A + B · exp (Fig. S2), which correspond to particles possessing Dve,me
Dva Dva λ
values of 177.3, 254.4, 331.8, and 409.3 nm, respectively, ac-
C · Dve cording to Eq. (11). Substituting the values of Dva and Dve,me
= Dve + λ A + B · exp (13)
λ into Eq. (12), the ρe,me values are 1.7, 1.6, 1.6, and 1.7 g/cm3
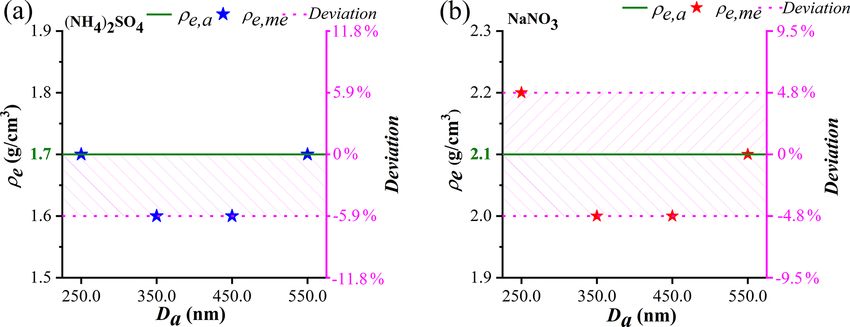
(Fig. 3a), respectively. Similarly, the selected NaNO3 par-
If the Da and Dva of an unknown particle can be measured,
ticles are determined to have Dva values of 321.0, 454.9,
its Dve could be calculated according to Eq. (13). Finally,
599.8, and 755.3 nm (Fig. S2), corresponding to Dve,me val-
the ρe value of the particles is calculated by the Dva and Dve
ues of 150.1, 218.2, 287.0, and 355.9 nm, respectively. The
values according to Eq. (14), which is obtained by combining
ρe,me values of the NaNO3 particles are 2.2, 2.0, 2.0, and
Eqs. (3) and (5):
2.1 g/cm3 (Fig. 3b), respectively. Figure 3 also shows that
ρp Dva the ρe,me values of the NaNO3 and (NH4 )2 SO4 particles with
ρe = = . (14) different Da deviate from their average values with the max-
χa ρ0 · Dve
imum of 5.9 % and 4.8 %, respectively, which are identical
Thus, we can obtain both the Dve and ρe values of unknown with the deviation for the ρe,me of PSL particles. These de-
particles based on the Da and Dva values. Because the AAC viations may be derived from the calibration of particle Dva
and SPAMS instruments have the ability to determine Da and from the SPAMS. While the R 2 of size calibration curve is
Dva , the AAC-SPAMS system developed in this study can be 0.999, the curve of exponential function is found to slightly
used to obtain the Dve and ρe values for unknown particles. deviate from the data points measured by SPAMS. For ex-
ample, the size calibration function produces the deviation of
3 Results and discussion −4.4 % and 3.1 % from the data points of 310 and 740 nm,
respectively.
3.1 Verification of the AAC-SPAMS system to obtain Taking the systematic error into account, the slight dif-
Dve and ρe ference of the ρe,me values for the four sizes suggests that
the ρe of (NH4 )2 SO4 and NaNO3 particles is independent
The Dva distribution of PSL particles with predefined Dve of particle size from 250.0 to 550.0 nm. It is determined by
values after being screened by the AAC is shown in Fig. S1 the definition of effective density used in this study, which
Atmos. Chem. Phys., 21, 5605–5613, 2021 https://doi.org/10.5194/acp-21-5605-2021L. Peng et al.: Measurement of volume equivalent diameter and effective density 5609 Figure 2. (a) Comparison between the measured Dve (Dve,me ) and the theoretical Dve (Dve,th ) of the PSL particles. (b) Comparison between the measured ρe (ρe,me ) and the theoretical ρe (ρe,th ) of the PSL particles. Figure 3. (a) Comparison between the measured ρe (ρe,me ) and average ρe (ρe,a ) values of the (NH4 )2 SO4 particles. (b) Comparison between the measured ρe (ρe,me ) and average ρe (ρe,a ) values of the NaNO3 particles. keeps constant as long as the χa of the particles does not lution droplet (Zelenyuk et al., 2005). Eclectically, Tang and change with particle size for pure compound. The aver- Munkelwitz (1994) studied that most of the NaNO3 parti- age ρe,me values of (NH4 )2 SO4 and NaNO3 particles are cles crystallized between 20 % and 30 % RH but some per- calculated to be 1.7 ± 0.1 and 2.1 ± 0.1 g/cm3 , which are sisted down to 10 % RH to keep solution droplets. Notably, lower than the ρp of (NH4 )2 SO4 (1.77 g/cm3 ) and NaNO3 the spherical NaNO3 particles at low RH observed by Hoff- (2.27 g/cm3 ). This is partly caused by the χa , which can be man et al. (2004) were dried in the sticky carbon tape, which used to parameterize the morphology. According to Eq. (14), might affect the phase transition of droplet-like NaNO3 par- the χa with different Da are calculated to be 1.04, 1.11, 1.11, ticles. In this study, most NaNO3 particles might crystallize and 1.04 for (NH4 )2 SO4 particles and 1.03, 1.14, 1.14, and because the RH of the aerosol flow carrying the NaNO3 parti- 1.08 for NaNO3 particles. Thus, the average χa values of cles was reduced to below 20 % through the diffusion drying the (NH4 )2 SO4 and NaNO3 particles are determined to be tube. The asphericity of the crystallized NaNO3 particles is 1.07±0.04 and 1.10±0.05, respectively, indicating that these supported by their FWHM values of the Dva distributions, particles are aspherical. which are consistent with that of aspherical (NH4 )2 SO4 The asphericity of (NH4 )2 SO4 determined by AAC- (Figs. S1 and S2). SPAMS system is consistent with the previous studies re- porting that the χa of (NH4 )2 SO4 were larger than the 3.3 Application of the AAC-SPAMS system for value of 1.03 (Zelenyuk et al., 2006; Beranek et al., 2012; measuring the chemically resolved Dve and ρe G. Zhang et al., 2016). However, previous studies found that the NaNO3 particles had different morphology. G. Zhang et SPAMS can obtain information on the chemical composition al. (2016) observed that NaNO3 had the χa of 1.09–1.13, of individual particles, implying that the AAC-SPAMS sys- while Hoffman et al. (2004) found that NaNO3 particle had tem has the ability to simultaneously characterize Dve , ρe , a round droplet-like shape even at 15 % RH, supported by and the chemical compositions of particles in real time. It is the consistency between the measured value of “anhydrous” worth noting that the freshly emitted soot particles exhibit the droplet density and the calculated value of “anhydrous” so- largest χ (∼ 2.5) in the actual atmosphere (Peng et al., 2016). https://doi.org/10.5194/acp-21-5605-2021 Atmos. Chem. Phys., 21, 5605–5613, 2021
5610 L. Peng et al.: Measurement of volume equivalent diameter and effective density
Table 1. The measured mean Dve and its standard deviation for the eight particle types at Da values of 250.0, 350.0, 450.0, and 550.0 nm
from nine rounds of measurements.
Da (nm) K-rich EC-S K-Na Amine
250.0 193.1 ± 8.2 192.2 ± 8.1 193.8 ± 21.9 190.6 ± 4.6
350.0 284.0 ± 28.4 280.8 ± 9.3 271.9 ± 18.0 284.8 ± 18.2
450.0 364.7 ± 21.1 357.8 ± 6.9 342.5 ± 7.3 367.9 ± 9.7
550.0 416.6 ± 28.3 439.5 ± 5.4 397.3 ± 29.7 442.5 ± 7.4
Da (nm) EC-N-S OC-N-S OC-EC-N-S Metal-rich
250.0 188.5 ± 5.9 200.8 ± 17.9 195.4 ± 8.9 189.0 ± 6.7
350.0 281.3 ± 9.3 295.7 ± 29.8 294.0 ± 32.3 277.0 ± 9.1
450.0 358.0 ± 5.8 398.3 ± 44.3 428.9 ± 24.0 342.9 ± 10.0
550.0 453.2 ± 16.4 547.4 ± 14.7 570.9 407.4 ± 14.5
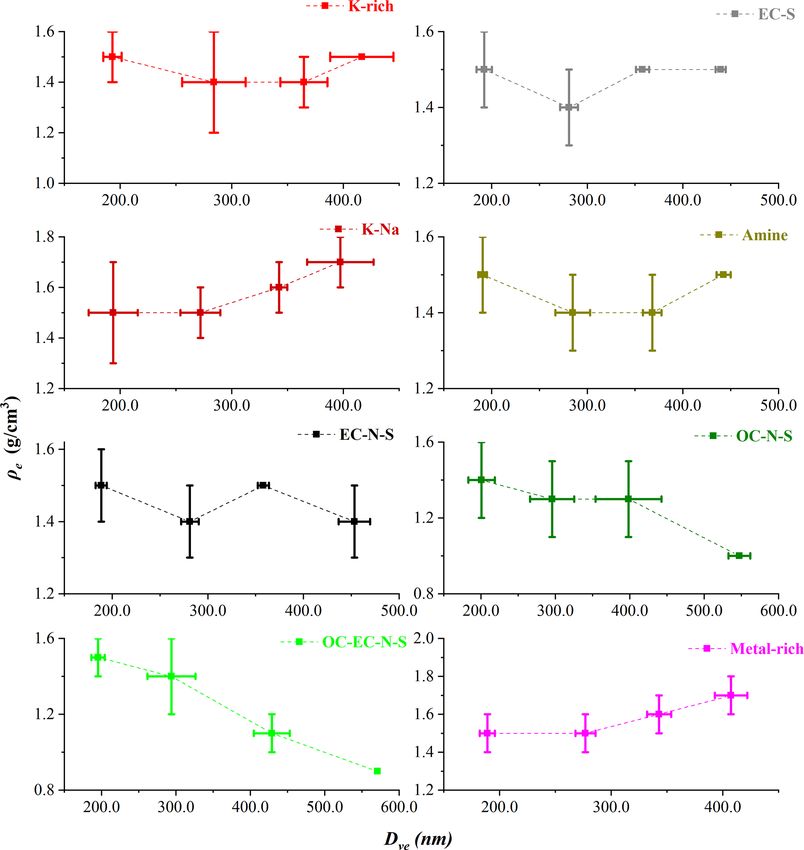
Figure 4. Variation in ρe of the eight particle types with Dve . The solid lines represent the range of the ρe and Dve measured from nine
rounds, and the data points stand for the average values.
Atmos. Chem. Phys., 21, 5605–5613, 2021 https://doi.org/10.5194/acp-21-5605-2021L. Peng et al.: Measurement of volume equivalent diameter and effective density 5611
It meets the upper limit for the approximation between the χt 4 Conclusion
and χv (DeCarlo et al., 2004).
As an example, the AAC-SPAMS system was deployed in We develop an AAC-SPAMS system to first achieve the mea-
the field to obtain the chemically resolved Dve and ρe values surement of the Dve and ρe (defined as the ratio of ρp to
for unknown aerosol particles. The sampled ∼ 100 000 parti- χ ) of the aspherical particles through characterizing their Da
cles are classified into eight major particle types with distinct and Dva . The reliability of the AAC-SPAMS system is veri-
chemical compositions: K-rich, EC-S, K-Na, amine, EC-N- fied by accurately measuring the Dve and ρe of PSL. Apply-
S, OC-N-S and OC-EC-N-S, and Metal-rich, representing ing the AAC-SPAMS system to determine theDve and ρe of
97 % of the detected particle population. Details of the chem- (NH4 )2 SO4 and NaNO3 particles shows that these particles
ical composition and number fraction of the eight types of are aspherical and their ρe are independent of particle size.
particles are presented in the Figs. S3 and S4, respectively, Coupled with the ability of SPAMS to characterize the chem-
which are discussed in the Supplement. ical composition of individual particles, the AAC-SPAMS
We used Gaussian fitting to obtain the Dva peaks for each system is demonstrated to be capable of characterizing the
particle type with Da values of 250.0, 350.0, 450.0, and Dve , ρe (ρp /χ ) and chemical compositions of atmospheric
550.0 nm. Following this, we calculated the Dve values of particles simultaneously, showing the potential application
the atmospheric particles with Eq. (11). Table 1 presents the of this system in field observations. The approach achieves
average Dve values of the eight particle types, for which the measurement of chemically resolved Dve and ρe (ρp /χ )
the standard deviation is calculated based on nine samples. and provides the possibility to determine their quantitative
The average Dve at Da values of 250.0, 350.0, 450.0, and relationship with other particle properties, which would be
550.0 nm shows wide ranges: from 188.5 to 200.8, 271.9 to a benefit for further reduction of the uncertainty associated
295.7, 342.5 to 428.9, and 397.3 to 570.9 nm, respectively, with the effects of particles on air quality, human health, and
which are caused by the different chemical composition. The radiative forcing.
result indicates that particles with significantly different Dve
might possess the same Da . Furthermore, the large standard
deviation of Dve , such as 21.9 nm for K-Na at 250.0 nm, Data availability. Data in this study are available at
32.3 nm for OC-EC-N-S at 350.0 nm, and 44.3 nm for OC-N- https://doi.org/10.5281/zenodo.4655206 (Peng, 2021).
S at 450.0 nm, indicates that the Dve of particles is remark-
ably different even for particles with the same type and same
Supplement. The supplement related to this article is available on-
Da .
line at: https://doi.org/10.5194/acp-21-5605-2021-supplement.
According to Dve and Dva , we calculated the ρe of each
particle type by Eq. (12). Figure 4 shows the variations of
the ρe with Dve for nine particle samples. For pure com-
Author contributions. The idea for the study was conceived by LP
pounds, such as (NH4 )2 SO4 and NaNO3 particle, ρe theoret- and GHZ. All experiments were performed by LP with the assis-
ically does not change with particle size. However, the sam- tance of LL. LP wrote the paper, which was reviewed by GHZ and
pled particles have experienced complex atmospheric pro- XHB. All co-authors discussed the results and commented on the
cesses. Therefore, ρe has a very wide distribution for each manuscript.
type of particles with a similar Dve . Specifically, the ρe of
K-Na increases with Dve , while the ρe of OC-N-S and OC-
EC-N-S decreases with Dve , which may be influenced by the Competing interests. The authors declare that they have no conflict
particle shape or the material density. Additionally, the av- of interest.
erage ρe of each type of particle is in the order from small
to large: 1.2 ± 0.2 g/cm3 for OC-EC-N-S, 1.3 ± 0.2 g/cm3
for OC-N-S, 1.4 ± 0.1 g/cm3 for K-rich, 1.4 ± 0.1 g/cm3 for Acknowledgements. The authors gratefully acknowledge Cambus-
amine, 1.5 ± 0.1 g/cm3 for EC-N-S, 1.5 ± 0.1 g/cm3 for EC- tion Ltd., UK, for providing the AAC and Hexin Analytical Instru-
S, 1.6 ± 0.1 g/cm3 for K-Na, and 1.6 ± 0.1 g/cm3 for Metal- ment Co., Ltd., China, for providing the SPAMS. This is contribu-
tion no. IS-2995 from CASGIG.
rich. It is reasonable to find that the average ρe of internally
mixed particles distributes in the range of their material den-
sities (ρm ). For instance, the OC-EC-N-S, OC-N-S, K-rich,
Financial support. This research has been supported by the Na-
and amine particles, mainly comprised of internally mixed
tional Nature Science Foundation of China (grant nos. 41877307
sulfate and organics, have the average ρe between that of sul- and 41775124), the Natural Science Foundation of Guangdong
fate with ρm of 1.77 g/cm3 and organic aerosols with ρm of Province (grant no. 2019B151502022), and the Guangdong Foun-
1.2 g/cm3 (Cross et al., 2007). dation for the Program of Science and Technology Research (grant
nos. 2019B121205006 and 2020B1212060053).
https://doi.org/10.5194/acp-21-5605-2021 Atmos. Chem. Phys., 21, 5605–5613, 20215612 L. Peng et al.: Measurement of volume equivalent diameter and effective density
Review statement. This paper was edited by James Allan and re- November (LExNo), J. Geophys. Res.-Atmos., 115, D11204,
viewed by Johannes Schneider and one anonymous referee. https://doi.org/10.1029/2009jd012635, 2010.
Li, L., Huang, Z. X., Dong, J. G., Li, M., Gao, W., Nian, H.
Q., Fu, Z., Zhang, G. H., Bi, X. H., Cheng, P., and Zhou, Z.:
Real time bipolar time-of-flight mass spectrometer for analyzing
single aerosol particles, Int. J. Mass Spectrom., 303, 118–124,
References https://doi.org/10.1016/j.ijms.2011.01.017, 2011.
Liu, Y. and Daum, P. H.: Relationship of refractive index to mass
Alexander, J. M., Bell, D. M., Imre, D., Kleiber, P. D., density and self-consistency of mixing rules for multicomponent
Grassian, V. H., and Zelenyuk, A.: Measurement of mixtures like ambient aerosols, J. Aerosol Sci., 39, 974–986,
size-dependent dynamic shape factors of quartz parti- https://doi.org/10.1016/j.jaerosci.2008.06.006, 2008.
cles in two flow regimes, Aerosol Sci. Tech., 50, 870–879, Liu, Z., Hu, B., Ji, D., Wang, Y., Wang, M., and Wang, Y.:
https://doi.org/10.1080/02786826.2016.1200006, 2016. Diurnal and seasonal variation of the PM2.5 apparent parti-
Beranek, J., Imre, D., and Zelenyuk, A.: Real-time shape- cle density in Beijing, China, Atmos. Environ., 120, 328–338,
based particle separation and detailed in situ particle https://doi.org/10.1016/j.atmosenv.2015.09.005, 2015.
shape characterization, Anal. Chem., 84, 1459–1465, Moffet, R. C. and Prather, K. A.: Extending ATOFMS measure-
https://doi.org/10.1021/ac202235z, 2012. ments to include refractive index and density, Anal. Chem. 77,
Buseck, P. R. and Posfai, M.: Airborne minerals and re- 6535–6541, https://doi.org/10.1021/ac0503097, 2005.
lated aerosol particles: effects on climate and the en- Moffet, R. C., Qin, X., Rebotier, T., Furutani, H., and Prather,
vironment, P. Natl. Acad. Sci. USA, 96, 3372–3379, K. A.: Chemically segregated optical and microphysical prop-
https://doi.org/10.1073/pnas.96.7.3372, 1999. erties of ambient aerosols measured in a single-particle
Cross, E. S., Slowik, J. G., Davidovits, P., Allan, J. D., mass spectrometer, J. Geophys. Res.-Atmos., 113, D12213,
Worsnop, D. R., Jayne, J. T., Lewis, D. K., Canagaratna, https://doi.org/10.1029/2007jd009393, 2008.
M., and Onasch, T. B.: Laboratory and ambient particle den- Peng, J. F., Hu, M., Guo, S., Du, Z. F., Zheng, J., Shang, D. J.,
sity determinations using light scattering in conjunction with Zamora, M., Zeng, L. M., Shao, M., Wu, Y. S., Zheng, J., Wang,
aerosol mass spectrometry, Aerosol Sci. Tech., 41, 343–359, Y., Glen, C., Collins, D., Molina, M., and Zhang, R. Y.: Markedly
https://doi.org/10.1080/02786820701199736, 2007. enhanced absorption and direct radiative forcing of black carbon
DeCarlo, P. F., Slowik, J. G., Worsnop, D. R., Davidovits, P., under polluted urban environments, P. Natl. Acad. Sci. USA, 113,
and Jimenez, J. L.: Particle morphology and density character- 4266–4271, https://doi.org/10.1073/pnas.1602310113, 2016.
ization by combined mobility and aerodynamic diameter mea- Peng, L.: longer1217/All-figures-data: Data (Version V1), Zenodo,
surements. Part 1: Theory, Aerosol Sci. Tech., 38, 1185–1205, https://doi.org/10.5281/zenodo.4655206, 2021.
https://doi.org/10.1080/027868290903907, 2004. Peng, L. and Bi, X.: Comment on “Retrieval of atmospheric fine
Dinar, E., Mentel, T. F., and Rudich, Y.: The density of humic acids particulate density based on merging particle size distribution
and humic like substances (HULIS) from fresh and aged wood measurements: multi-instrument observation and quality con-
burning and pollution aerosol particles, Atmos. Chem. Phys., 6, trol at Shouxian” by Li et al, J. Geophys. Res.-Atmos., 125,
5213–5224, https://doi.org/10.5194/acp-6-5213-2006, 2006. e2019JD031806, https://doi.org/10.1029/2019JD031806, 2020.
Guo, S., Hu, M., Zamora, M. L., Peng, J. F., Shang, D. J., Zheng, Pitz, M., Cyrys, J., Karg, E., Wiedensohler, A., Wichmann, H.
J., Du, Z. F., Wu, Z., Shao, M., Zeng, L. M., Molina, M. J., and E., and Heinrich, J.: Variability of apparent particle density
Zhang, R. Y.: Elucidating severe urban haze formation in China, of an urban aerosol, Environ. Sci. Technol., 37, 4336–4342,
P. Natl. Acad. Sci. USA, 111, 17373–17378, 2014. https://doi.org/10.1021/es034322p, 2003.
Han, C., Li, S. M., Liu, P., and Lee, P.: Size dependence of the physi- Pöschl, U.: Atmospheric aerosols: Composition, transformation,
cal characteristics of particles containing refractory black carbon climate and health effects, Angew. Chem. Int. Edit., 44, 7520–
in diesel vehicle exhaust, Environ. Sci. Technol., 53, 137–145, 7540, https://doi.org/10.1002/anie.200501122, 2005.
https://doi.org/10.1021/acs.est.8b04603, 2019. Schneider, J., Weimer, S., Drewnick, F., Borrmann, S., Helas, G.,
Hand, J. L. and Kreidenweis, S. M.: A new method for re- Gwaze, P., Schmid, O., Andreae, M. O., and Kirchner, U.: Mass
trieving particle refractive index and effective density from spectrometric analysis and aerodynamic properties of various
aerosol size distribution data, Aerosol Sci. Tech., 36, 1012–1026, types of combustion-related aerosol particles, Int. J. Mass Spec-
https://doi.org/10.1080/02786820290092276, 2002. trom., 258, 37–49, https://doi.org/10.1016/j.ijms.2006.07.008,
Hoffman, R. C., Laskin, A., and Finlayson-Pitts, B. J.: Sodium ni- 2006.
trate particles: physical and chemical properties during hydration Seinfeld, J. and Pandis, S. N.: From air pollution to climate change,
and dehydration, and implications for aged sea salt aerosols, J. Atmospheric Chemistry and Physics, Wiley, New York, 429–
Aerosol Sci., 35, 869–887, 2004. 443, 1998.
Katrib, Y., Martin, S. T., Rudich, Y., Davidovits, P., Jayne, J. T., Song, X. H., Hopke, P. K., Fergenson, D. P., and Prather, K. A.:
and Worsnop, D. R.: Density changes of aerosol particles as a Classification of single particles analyzed by ATOFMS using an
result of chemical reaction, Atmos. Chem. Phys., 5, 275–291, artificial neural network, ART-2A, Anal. Chem., 71, 860–865,
https://doi.org/10.5194/acp-5-275-2005, 2005. https://doi.org/10.1021/ac9809682, 1999.
Kiselev, A., Wennrich, C., Stratmann, F., Wex, H., Hen- Spencer, M. T. and Prather, K. A.: Using ATOFMS to determine
ning, S., Mentel, T. F., Kiendler-Scharr, A., Schneider, J., OC/EC mass fractions in particles, Aerosol Sci. Tech., 40, 585–
Walter, S., and Lieberwirth, I.: Morphological characteriza- 594, https://doi.org/10.1080/02786820600729138, 2006.
tion of soot aerosol particles during LACIS Experiment in
Atmos. Chem. Phys., 21, 5605–5613, 2021 https://doi.org/10.5194/acp-21-5605-2021L. Peng et al.: Measurement of volume equivalent diameter and effective density 5613 Spencer, M. T., Shields, L. G., and Prather, K. A.: Simultaneous Zelenyuk, A., Cai, Y., Chieffo, L., and Imre, D.: High pre- measurement of the effective density and chemical composition cision density measurements of single particles: The den- of ambient aerosol particles, Environ. Sci. Technol., 41, 1303– sity of metastable phases, Aerosol Sci. Tech., 39, 972–986, 1309, https://doi.org/10.1021/es061425+, 2007. https://doi.org/10.1080/02786820500380206, 2005. Sumlin, B. J., Oxford, C. R., Seo, B., Pattison, R. R., Williams, B. J., Zelenyuk, A., Cai, Y., and Imre, D.: From agglomerates of and Chakrabarty, R. K.: Density and homogeneous internal com- spheres to irregularly shaped particles: Determination of dy- position of primary brown carbon Aerosol, Environ. Sci. Tech- namic shape factors from measurements of mobility and vac- nol., 52, 3982–3989, https://doi.org/10.1021/acs.est.8b00093, uum aerodynamic diameters, Aerosol Sci. Tech., 40, 197–217, 2018. https://doi.org/10.1080/02786820500529406, 2006. Tang, I. N.: Thermodynamic and optical properties of mixed-salt Zhai, J., Lu, X., Li, L., Zhang, Q., Zhang, C., Chen, H., Yang, aerosols of atmospheric importance, J. Geophys. Res.-Atmos., X., and Chen, J.: Size-resolved chemical composition, effective 102, 1883–1893, 1997. density, and optical properties of biomass burning particles, At- Tang, I. N. and Munkelwitz, H. R.: Water activities, densities, mos. Chem. Phys., 17, 7481–7493, https://doi.org/10.5194/acp- and refractive-indexes of aqueous sulfates and sodium-nitrate 17-7481-2017, 2017. droplets of atmospheric importance, J. Geophys. Res.-Atmos., Zhang, G., Bi, X., Han, B., Qiu, N., Dai, S., Wang, X., Sheng, G., 99, 18801–18808, 1994. and Fu, J.: Measurement of aerosol effective density by single Tavakoli, F. and Olfert, J. S.: An instrument for the classification particle mass spectrometry, Sci. China Earth Sci., 59, 320–327, of aerosols by particle relaxation time: theoretical models of the https://doi.org/10.1007/s11430-015-5146-y, 2016. aerodynamic aerosol classifier, Aerosol Sci. Tech., 47, 916–926, Zhang, Y., Zhang, Q., Cheng, Y., Su, H., Kecorius, S., Wang, Z., https://doi.org/10.1080/02786826.2013.802761, 2013. Wu, Z., Hu, M., Zhu, T., Wiedensohler, A., and He, K.: Measur- Wu, Y., Xia, Y., Huang, R., Deng, Z., Tian, P., Xia, X., and Zhang, ing the morphology and density of internally mixed black carbon R.: A study of the morphology and effective density of externally with SP2 and VTDMA: new insight into the absorption enhance- mixed black carbon aerosols in ambient air using a size-resolved ment of black carbon in the atmosphere, Atmos. Meas. Tech., 9, single-particle soot photometer (SP2), Atmos. Meas. Tech., 12, 1833–1843, https://doi.org/10.5194/amt-9-1833-2016, 2016. 4347–4359, https://doi.org/10.5194/amt-12-4347-2019, 2019. Zhao, G., Zhao, W., and Zhao, C.: Method to measure Yin, Z., Ye, X. N., Jiang, S. Q., Tao, Y., Shi, Y., Yang, the size-resolved real part of aerosol refractive index us- X., and Chen, J. M.: Size-resolved effective density of ur- ing differential mobility analyzer in tandem with single- ban aerosols in Shanghai, Atmos. Environ., 100, 133–140, particle soot photometer, Atmos. Meas. Tech., 12, 3541–3550, https://doi.org/10.1016/j.atmosenv.2014.10.055, 2015. https://doi.org/10.5194/amt-12-3541-2019, 2019. Yon, J., Bescond, A., and Ouf, F. X.: A simple semi- empirical model for effective density measurements of fractal aggregates, J. Aerosol Sci., 87, 28–37, https://doi.org/10.1016/j.jaerosci.2015.05.003, 2015. https://doi.org/10.5194/acp-21-5605-2021 Atmos. Chem. Phys., 21, 5605–5613, 2021
You can also read