Serum biomarkers confirming stable remission in inflammatory bowel disease
←
→
Page content transcription
If your browser does not render page correctly, please read the page content below
www.nature.com/scientificreports
OPEN Serum biomarkers confirming
stable remission in inflammatory
bowel disease
Christoph Kessel1,7, Miha Lavric1,2,7, Toni Weinhage1, Markus Brueckner3, Sytze de Roock4,
Jan Däbritz5, Jakob Weber6, Sebastiaan J. Vastert4 & Dirk Foell1*
Crohn’s disease (CD) and ulcerative colitis (UC) have a chronic-remittent course. Optimal management
of inflammatory bowel diseases (IBD) relies on early intervention, treat-to-target strategies and a
tight disease control. However, it is challenging to assess the risk of relapses in individual patients.
We investigated blood-based biomarkers for the confirmation of disease remission in patients with
IBD. We retrospectively analyzed samples of 40 IBD patients (30 UC, 10 CD) enrolled in a tight-
control follow-up study. Half of the patients had a flare during follow up. Serum was analyzed for
S100A12 as well as S100A8/A9 and for 50 further biomarkers in a bead-based multiplex assay. The
concentrations of 9 cytokines/chemokines and S100A8/A9 significantly differed in IBD patients with
unstable remission (before flares) when compared to IBD patients with stable remission. Although the
number of patients was small, ROC curve analyses revealed a number of biomarkers (IL-1β, IL-1RA,
IL-8, IL13, IL-15, IL-21, IL-25, IFN-β, CXCL9, CXCL10, CXCL11, Galectin-1, G-CSF and S100A8/A9) that
were elevated in patients with later occurring relapses. While earlier studies on peripheral biomarkers
in IBD are limited to only few analytes, our study using a broad screening approach identified serum
biomarkers with the potential to indicate unstable disease control in IBD, which may help to steer
individual therapies to maintain remission.
The management of patients with inflammatory bowel disease (IBD) is evolving. The traditional concept of a step-
up therapy has been challenged and treat-to-target strategies have been p roposed1. The main treatment target is
to induce and maintain disease remission, which means a control of intestinal inflammation, a normalization of
life, and the prevention of long-term damage2–5. Both for Crohn’s disease (CD) and ulcerative colitis (UC), effec-
tive biological drugs enable improved therapeutic o utcomes6. Disease remission can be defined by endoscopic
endpoints such as mucosal healing. Yet, radiologic status, patient reported outcomes, and use of non-invasive
biomarkers are also conceivable measures of the therapeutic t arget7,8.
Follow-up recommendations for patients with IBD based on treat-to-target strategies mainly focus on the
initial treatment phase, when therapies are started in patients with active disease to induce remission4. However,
patient follow-up upon successful initial treatment is less clear. It is important to maintain a sustained remission.
Since CD and UC are both chronic-remittent diseases, quiescent phases may be followed by (seemingly unpro-
voked) relapsing disease. Therefore, monitoring of disease activity is the mainstay of clinical decision-making.
At present, accurate monitoring of intestinal inflammation relies upon clinical indices (based upon symptoms
and clinical examination) and endoscopy, in conjunction with histological investigation and imaging techniques.
However, these diagnostic options have a number of drawbacks, as they are time consuming, costly, invasive and/
or not necessarily objective. Indirect, yet reliable, measures of biological disease activity are of utmost importance.
Blood tests, including C-reactive protein (CRP) and erythrocyte sedimentation rate (ESR), are in common use
but have insufficient sensitivity and specificity for intestinal i nflammation9.
Currently there are no means to predict the long-term disease course, and adjusting treatment to the actual
needs of patients is especially difficult when the patient is feeling well. In these phases, invasive measures of
subclinical disease activity such as endoscopy are often not considered a cceptable10. Objective measures by
1
Pediatric Rheumatology and Immunology, University Hospital Muenster, Domagkstr. 3, 48149 Muenster,
Germany. 2Research Group Ambient Intelligence, Saxion University of Applied Sciences, Enschede, The
Netherlands. 3Department of Gastroenterology and Hepatology, University Hospital Muenster, Muenster,
Germany. 4Department of Pediatric Rheumatology and Immunology and Center for Translational Immunology,
University Medical Center Utrecht, Utrecht, The Netherlands. 5Department of Pediatrics, University Medical
Center Rostock, Rostock, Germany. 6BÜHLMANN Laboratories AG, Schoenenbuch, Switzerland. 7These authors
contributed equally: Christoph Kessel and Miha Lavric. *email: dfoell@uni-muenster.de
Scientific Reports | (2021) 11:6690 | https://doi.org/10.1038/s41598-021-86251-w 1
Vol.:(0123456789)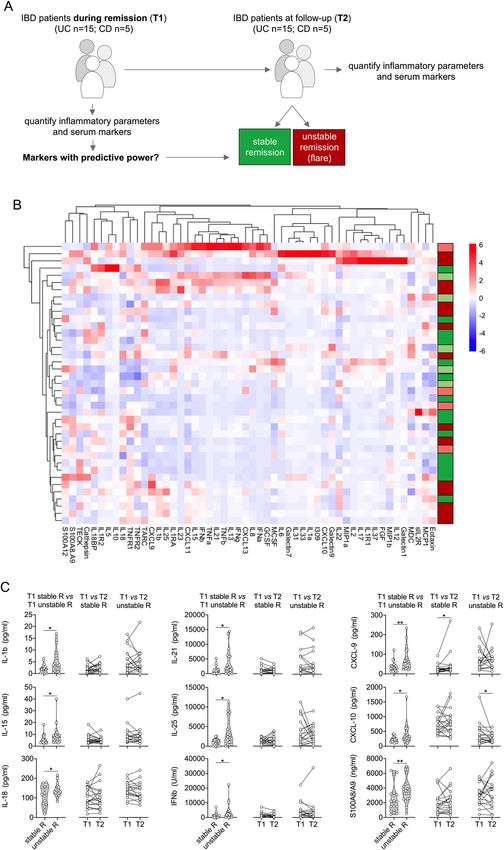
www.nature.com/scientificreports/
UC CD
Stable Unstable Stable Unstable
Patients (n) 15 15 5 5
Age at visit 1 (years, median; range) 52.6; 27.9–69.8 46.6; 20.8–70.2 32.4; 27.5–55.3 30.5; 19.4–47.0
Gender (male/female) 7/8 5/10 1/4 3/2
Disease duration (years, median; range) 11.8; 0.2–31.0 16.1; 1.7–29.7 23.4; 4.4–28.5 16.4; 3.0–22.6
BMI at visit 1 (kg/m2, median; range) 27.5; 20.2–36.0 27.4; 19.8–32.4 25.2; 18.1–28.1 20.4; 18.9–30.1
UCAI at visit 1 (median; range) 1; 0–3 1; 0–3 – –
CDAI at visit 1 (median; range) – – 40; 10–143 16; 10–147
Days from visit 1 to 2 (median; range) 74; 27–308 31; 23–77 97; 17–275 74; 51–133
Therapy (n)
Steroids (systemic) 0 0 1 1
Steroids (local) 1 0 1 0
Azathioprine 2 0 0 1
Mesalazine 4 0 1 0
Anti-TNF 0 0 2 2
Localization (n)
Colonic – – 1 1
Ileocolonic – – 4 4
Ulcerative proctitis 2 1 – –
Left-sided colitis 11 8 – –
Pancolitis 2 6 – –
Routine laboratory markers
Hb (g/dl, median; range) 13.7; 11.5–16.5 13.9; 11.2–15.7 13.3; 11.7–15.6 13.2; 11.6–13.2
WBC (103/µl, median; range), P 6.75; 4.45–9.55 7.12; 4.52–12.8 6.89; 5.13–9.73 6.97; 5.41–11.08
CRP (mg/dl, median; range) 0.3; 0.3–0.9 0.7; 0.2–3.0 0.4; 0.3–0.7 0.3; 0.3–0.9
Table 1. Characteristics of included IBD patients. IBD inflammatory bowel disease, UC ulcerative colitis, CD
Crohn’s disease, TNF tumor necrosis factor, Hb hemoglobulin, WBC white blood cells, CRP C-reactive protein.
biomarkers would thus be helpful in evaluating the risk for r elapses11–13. Even though some biomarkers measured
in blood or stool have been shown to offer variable degree of utility in monitoring gastrointestinal tract inflam-
mation in IBD, in clinical practice there is still an unmet need for biomarkers that could assess the stability of
disease remission and the risk of r elapse14–17. The effect of tight control management on Crohn’s disease (CALM)
trial has demonstrated that treatment escalation based on symptoms combined with elevated serum CRP and/
or fecal calprotectin was better than symptom-based escalation alone18. Despite a robust diagnostic accuracy,
the use of fecal markers is somewhat difficult in everyday practice especially from the patients’ p erspective19,20.
Consequently, stool markers are actually monitored in a minority of p atients21,22. Patients with IBD prefer blood-
iomarkers23. However, blood-based bio-markers have shown poor a ccuracy24. A need therefore
based over fecal b
exists for blood-based biomarkers that accurately detect disease activity in IBD.
In a previously published prospective 36-month multicenter study, we demonstrated the utility of fecal bio-
markers to predict the flare risk in IBD patients after reaching inactive disease25,26. Time course analysis of
S100A12 up to 9 months before and after relapse showed a clear increase of fecal but not serum S100A12 con-
centrations up to 6 months before clinical relapse. We now extend our work to candidate biomarkers that appear
potentially related to inflammatory processes in IBD and can be analyzed in serum samples collected during
remission. We aimed at identifying biomarker panels to identify patients who may need an optimized and/or
intensified maintenance therapy to avoid disease flares.
Materials and methods
Patients and study design. In a prospective multicenter study, patients with IBD in remission were con-
secutively recruited and followed up between April 2008 and June 2011 in four independent German outpa-
tient specialized clinics as previously described25,26. The diagnoses of CD and UC were confirmed as described
previously25,26. Patients with coexisting and serious cardiopulmonary, hepatic, renal, neurologic, psychiatric, and
rheumatologic disease, a history of HIV and/or hepatitis B and C were excluded from the study. Patients were
assessed at a minimum of 3-month intervals or when relapse occurred. Serum and stool samples were prospec-
tively collected at each visit when available. In addition to baseline characteristics, symptoms, medication, clini-
cal signs, and standard laboratory results (full blood count, ESR, CRP) were recorded throughout the study. For
the present analyses, 80 serum samples were retrospectively selected from 40 IBD patients based on the occur-
rence of disease flares at follow-up within a maximum of 1 year. For each patient paired samples either during
an initial (visit 1) or a follow-up visit (visit 2) were available, making up 60 samples from 30 UC patients and 20
samples from 10 CD (Table 1). Half of patients in both groups either remained in stable remission (experiencing
remission both at visit 1 and 2) or were classified as unstable remission (with remission at visit 1, but an acute
Scientific Reports | (2021) 11:6690 | https://doi.org/10.1038/s41598-021-86251-w 2
Vol:.(1234567890)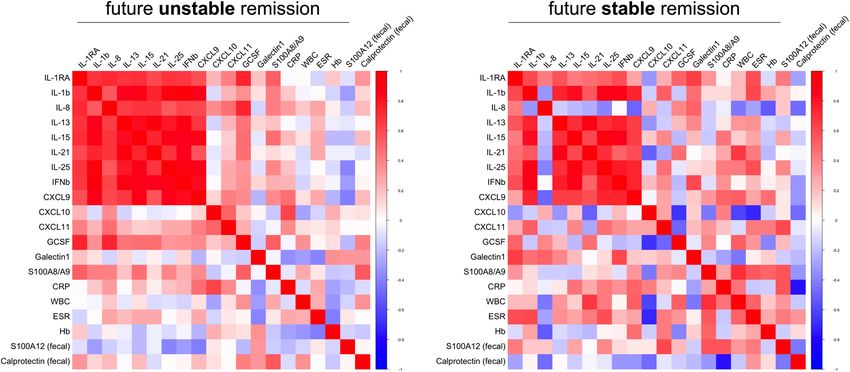
www.nature.com/scientificreports/
flare during follow-up visit 2). Among CD patients, five were classified as stable and five as unstable remission.
Baseline characteristics are summarized in Table 1. The study was approved by the Ethics Committee of the
University of Münster (ref. no. 2006-267-f-S), and written informed consent was obtained from all patients. The
authors confirm that all experiments were performed in accordance with relevant guidelines and regulations.
Assessment of disease activity. Disease activity was assessed based on the Crohn’s disease activity index
(CDAI) for patients with CD and the ulcerative colitis activity index (UCAI) for patients with UC. Remission
was defined as a CDAI < 150 or UCAI < 5. Relapse was defined as follows: CDAI > 250 over 2 consecutive weeks
or a CDAI > 150 with an at least 70-points of increase within 2 weeks as compared with CDAI at the previous
study visit; UCAI > 6 over 2 consecutive weeks or a UCAI > 4 with an at least 3-points of increase within 2 weeks
as compared with UCAI at the previous study visit.
Immunoassays. Concentrations of S100A12 were determined by a double-sandwich ELISA, as described
reviously27,28. Calprotectin (S100A8/A9) was measured by a commercial sandwich ELISA (Bühlmann Labo-
p
ratories AG, Schoenenbuch, Switzerland). Validated multiplexed immunoassays were used to measure 50 ana-
lytes using Luminex xMAP proteomics technology (Austin TX, USA). Fifty different carboxylated magnetic
beads, each with a distinct emitting fluorescence pattern, were purchased from Luminex Corporation (Austin,
TX, USA). Capture antibodies (commercially purchased) for 50 analytes were covalently coupled to the micro-
spheres as described previously29–31. Acquisition was performed with a BioRad FlexMAP3D (BioRad laborato-
ries, Hercules, USA) in combination with xPONENT software, version 4.2 (Luminex). Data were analyzed by
5-parametric curve fitting using Bio-Plex Manager software, version 6.1.1 (BioRad).
Statistical analysis. Results were analyzed using GraphPad Prism 8.0 and R 3.5.0 (The R Foundation for
Statistical Computing, Vienna, Austria) and Statistical Package for the Social Sciences (SPSS version 26, IBM
New York, USA). For pairwise comparison of serum analyte levels between remission and acute flare phases,
Wilcoxon signed-rank test was used. For comparing results between groups, Mann–Whitney U test was used.
Kruskal–Wallis test with Bonferroni post-hoc analyses were applied to correct for multiple comparisons. Infer-
ential statistics were intended to be exploratory, not confirmatory, and were interpreted accordingly. Receiver
operated characteristics (ROC) curve analyses (GraphPad Prism 8.0) were applied to test for the prediction of
flares and the distinction of populations at risk (stable or unstable remission groups), with calculation of the area
under curve (AUC). Binary logistic regression analyses were performed to test for multiparametric prediction
models. The significance level was set at P < 0.05 and confidence levels at 95%.
Results
Our broad serum biomarker analyses in IBD followed a specific methodology: a first sample was available ini-
tially when the patients were recruited, and all patients were in disease remission at this time point (Table 1).
During the followed-up period over 1 year, half of the patients had a relapse. A second sample was obtained at
T2, either at the time of the flare or at the end of follow-up in remission (Figs. 1A and 3A). Stable remission and
unstable remission datasets were compared between each other for the whole cohort (Figs. 1 and 2), followed
by independent separate analyses for CD and UC (Figs. 3 and 4).
Within the IBD cohort, the acquired serum level data of 52 analytes did not result in specific grouping of
patients when subjected to unsupervised clustering analyses (Fig. 1B), but yielded 9 markers with concentra-
tions that differed in patients with future unstable remission compared to those with future stable remission (i.e.
without subsequent relapse): already at the baseline visit (T1) serum levels of IL-1β, IL-15, IL-18, IL-21, IL-25,
IFN-β, CXCL9, CXCL10 and S100A8/A9 were higher in those who later experienced disease relapse (Fig. 1C,
Table 2). For the median values of S100A8/A9 (p = 0.016) and CXCL9 (p = 0.031) the statistical difference was
confirmed in post-hoc Bonferroni corrections for multiple comparisons (Table 2).
Standard laboratory markers (Hb, white blood cell counts, and CRP; Table 1) in the group with future IBD
relapse did not significantly differ from those in the future non-relapse group. In addition, fecal markers of
inflammation (fecal calprotectin and S100A12, respectively) revealed no significant differences between the
patient groups (Supplementary Table S1). In contrast to the differences in baseline levels and except for CXCL10,
there was no clear trend when comparing the T1 with T2 samples. The differences between inactive and active
disease appear rather small in comparison with the differences observed with background activity at inclusion
(Fig. 1C).
In patients with unstable remission, experiencing a future flare, multiple correlation analyses of significantly
different serum markers in IBD T1-samples (Fig. 1C, Table 2) as well as routine blood and fecal markers of
inflammation (Table 1; Supplementary Table S1) revealed that mainly markers which can be linked to T cell
activation (IL-15, IL-18, IL-21, IL-25) or IFNγ-signaling (CXCL9) but also IL-1β and IFNβ cluster together in
positive association (Fig. 2). This pattern only marginally differs from that observed in patients remaining in
stable remission. Serum and inflammatory marker associations in these patients with stable remission predomi-
nantly reveal marked negative correlations with fecal calprotectin, which is inverse to what we observed with
respect to fecal S100A12 (Fig. 2).
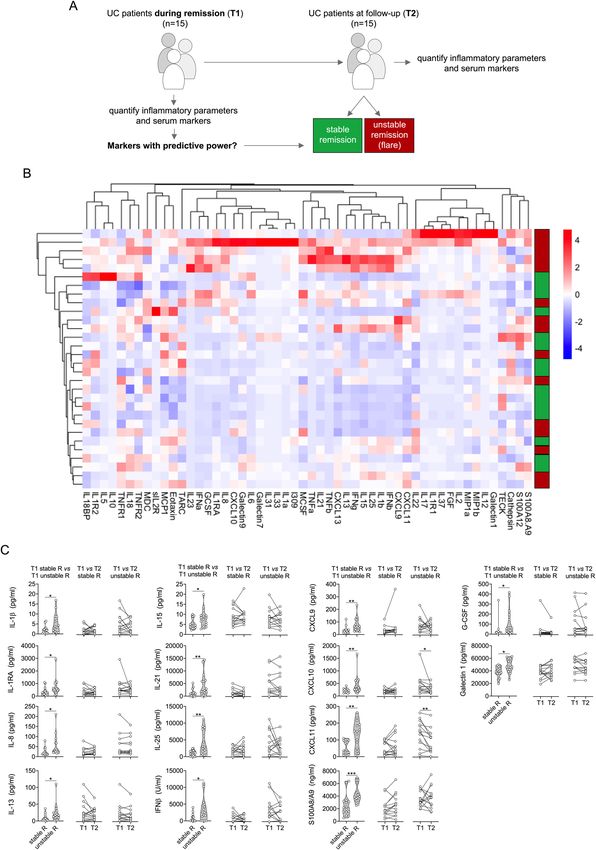
Restricting our analyses to UC patients (Fig. 3A) did not benefit the overall unsupervised clustering based
on the acquired levels of 52 serum markers (Fig. 3B), but we observed that concentrations of 14 analytes (IL-1β,
IL-1RA, IL-8, IL-13, IL-15, IL-21, IL-25, IFN-β, CXCL9, CXCL10, CXCL11, S100A8/A9, G-CSF and Galectin-1)
were significantly higher in samples from patients with unstable remission compared to patients with stable
remission (Fig. 3C, Table 2). For the median values of S100A8/A9 (p < 0.001), Galectin-1 (p = 0.002), CXCL11
Scientific Reports | (2021) 11:6690 | https://doi.org/10.1038/s41598-021-86251-w 3
Vol.:(0123456789)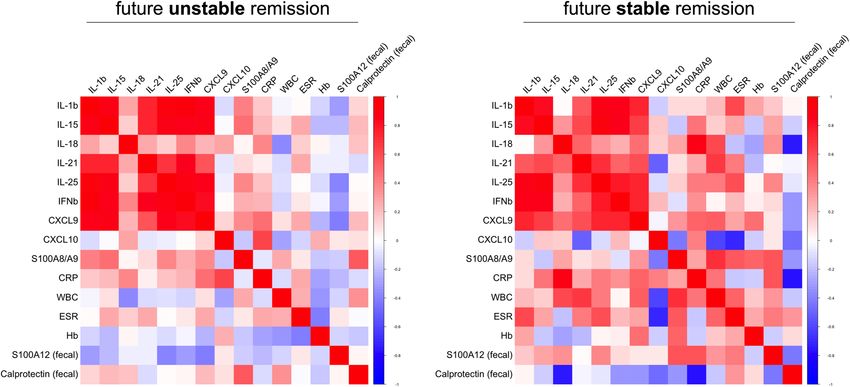
www.nature.com/scientificreports/

                                           Figure 1.  Analysis of inflammatory parameters and multiplexed serum markers in IBD. (A) Illustration of the experimental
                                           layout. IBD patients during remission were included into the study (T1). Patients were followed-up over 1 year. Half of the
                                           patients had a relapse during follow-up. A second sample was obtained at T2, either at the time of the flare of at the end of
                                           follow-up in remission. (B) Heatmap of serum marker data from bead array assay, ELISA data (S100A8/A9, S100A12) and
                                           routine inflammatory parameters (ESR, CRP, WBC) following unsupervised hierarchical clustering and complete linkage
                                           analyses (RStudio R 3.5.0, the R Foundation for Statistical Computing, Vienna, Austria). Red and green indicate future relapse
                                           or stable remission of UC patients, light red and light green indicate future relapse or stable remission of CD patients. (C)
                                           Markers with significantly different levels at T1 between IBD patients with stable remission (stable R) or unstable remission
                                           (unstable R) (left panel column), and comparison of respective marker levels between T1 and T2 during stable (middle
                                           panel column) or unstable remission (right panel column). Acquisition was performed with a BioRad FlexMAP3D (BioRad
                                           laboratories, Hercules, USA) in combination with xPONENT software, version 4.2 (Luminex). Data were analyzed using Bio-
                                           Plex Manager software, version 6.1.1 (BioRad). Data of individual serum biomarkers were analyzed by Mann–Whitney U or,
                                           when paired, by Wilcoxon signed rank test. *p < 0.05, **p < 0.01.

          Scientific Reports |   (2021) 11:6690 |                 https://doi.org/10.1038/s41598-021-86251-w                                                            4

Vol:.(1234567890)
www.nature.com/scientificreports/
Figure 2. Multiple correlation analyses of inflammation biomarkers in IBD. Serum markers with significantly
different levels at T1 based on whether experiencing future flare or remaining in remission (as in Fig. 1C) as
well as routine clinical laboratory (WBC, ESR, CRP) and fecal markers of inflammation were analyzed for their
association based on spearman rank (RStudio, R 3.5.0, the R Foundation for Statistical Computing, Vienna,
Austria).
(p = 0.008), CXCL9 (p = 0.012), CXCL10 (p = 0.024), and IL-21 (p = 0.038) the statistical difference was confirmed
in post-hoc Bonferroni corrections for multiple comparisons (Table 2).
Paralleling observations in the total IBD cohort, standard blood or fecal markers of inflammation (Hb, white
blood cell counts, CRP, fecal calprotectin, fecal S100A12) in patients with future relapse did not significantly
differ from those with future stable remission (Table 1, Supplementary Table S1). When comparing biomarker
levels in T1 with T2 samples we only observed significant differences in CXCL10 and CXCL11 (Fig. 3C). Most
patients (n = 27) within the UC cohort were seen within less than 60 days following T1 for their respective
follow-up T2 visit. When excluding three patients with T2 visits > 100 days from our data set, this did not result
in major changes among the identified markers with significantly different serum levels with respect to future
flare or stable remission (Supplementary Table S2).
When subjecting only data acquired from UC patients to multiple correlation analyses, the picture margin-
ally differs from what we observed in total IBD. Both among patients with future relapse or stable remission
we observed mainly markers linked to T cell activation (IL-15, IL-18, IL-21, IL-25) or IFNγ-signaling (CXCL9,
CXCL11) but also IL-1β and IFNβ to cluster together in positive association (Fig. 4). Associations of serum
cytokines with IL-8, G-CSF, CXCL10, S100A8/A9 and Galectin-1 appear to mainly differ in T1-samples obtained
from patients remaining in remission or experiencing a future flare. Further, as observed in the total IBD cohort,
serum and inflammatory marker associations in patients with future stable remission predominantly reveal
marked negative correlations with fecal calprotectin, which is inverse to what we observed with respect to fecal
S100A12 (Fig. 4).
Prompted by ROC analyses revealing differences between patients with future stable versus unstable remis-
sion for both the whole IBD and the UC cohort (Table 2), we evaluated predictive models taking the significant
biomarkers into account. The analyses have to be interpreted with care due to the balance of patient samples
and analytes and the limitations of multiple comparisons. Binary nominal logistic regression analyses showed
that S100A8/A9 has a predictive power for all IBD patients and even better for UC patients. In the latter group,
a model adding S100A8/A9 to measurements of CXCL11 yields a predictive power of 80% (Supplementary
Tables S2 and S3). In UC patients, both CXCL11 (sensitivity 67%, specificity 87%, likelihood ration 5.0) and
S100A8/A9 (sensitivity 73%, specificity 87%, likelihood ration 5.5) could be confirmed as markers differentiating
patients with future flares from those with stable remission (Supplementary Table S4).
Discussion
While it is unlikely that serum biomarkers will ever replace invasive tests, such as endoscopy, they could be useful
as inflammatory markers filtering for the need of invasive investigations while monitoring the patients’ disease
course. We extend our previous work that has revealed a predictive power of fecal S100A12 and calprotectin, but
only a weak association of their serum levels with flare risk in IBD patients. For further analyses of candidate
blood-based markers, we created a cohort of patients who either remained in remission during follow up (“stable
remission” group) or who consecutively experienced a relapse in a predefined time period (“unstable remission”
group). We present 16 biomarkers with the potential to indicate unstable remission in IBD. In particular, 14
molecular markers with elevated values in UC patients with unstable remission were identified. Those can be
Scientific Reports | (2021) 11:6690 | https://doi.org/10.1038/s41598-021-86251-w 5
Vol.:(0123456789)www.nature.com/scientificreports/
Figure 3. Analysis of inflammatory parameters and multiplexed serum markers in UC. (A) Illustration of the
experimental layout, restricted to UC patients during remission at inclusion (T1). Patients were followed-up
over 1 year. Half of the patients had a relapse during follow-up. A second sample was obtained at T2, either at
the time of the flare of at the end of follow-up in remission. (B) Heatmap of serum marker data from bead array
assay, ELISA data (S100A8/A9, S100A12) and routine inflammatory parameters (ESR, CRP, WBC) following
unsupervised hierarchical clustering and complete linkage analyses (RStudio, R 3.5.0, the R Foundation for
Statistical Computing, Vienna, Austria). (C) Markers with significantly different levels at T1 between IBD
patients with stable remission (stable R) or unstable remission (unstable R) (left panel column), and comparison
of respective marker levels between T1 and T2 during stable (middle panel column) or unstable remission (right
panel column). Acquisition was performed with a BioRad FlexMAP3D (BioRad laboratories, Hercules, USA)
in combination with xPONENT software, version 4.2 (Luminex). Data were analyzed using Bio-Plex Manager
software, version 6.1.1 (BioRad). Data of individual serum biomarkers were analyzed by Mann–Whitney U or,
when paired, by Wilcoxon signed rank test. *p < 0.05, **p < 0.01, ***p < 0.001.
Scientific Reports | (2021) 11:6690 | https://doi.org/10.1038/s41598-021-86251-w 6
Vol:.(1234567890)www.nature.com/scientificreports/
Figure 4. Multiple correlation analyses of inflammation biomarkers in UC. Serum markers with significantly
different levels at T1 based on whether experiencing future flare or remaining in remission (as in Fig. 3C) as
well as routine clinical laboratory (WBC, ESR, CRP) and fecal markers of inflammation were analyzed for their
association based on spearman rank (RStudio, R 3.5.0, the R Foundation for Statistical Computing, Vienna,
Austria).
IBD (n = 40) UC (n = 30)
Unstable Unstable
Stable Remission Remission Median Stable Remission Remission Median
Marker Median (95%CI) (95%CI) AUC (95%CI) Pa
P adj. b
Median (95%CI) (95%CI) AUC (95%CI) Pa P adj.b
IL-1Ra 280 (188–651) 511 (257–955) 0.604 (0.42–0.78) 0.222 n.s. 278 (151–438) 515 (423–955) 0.72 (0.53–0.91) 0.040 n.s.
IL-1β 1.83 (0.8–2.25) 3.6 (1.03–8.63) 0.706 (0.53–0.87) 0.030 n.s. 1.79 (0.4–2.25) 3.62 (1.03–8.63) 0.742 (0.56–0.92) 0.023 n.s.
IL-2 1.07 (0.1–2.93) 0.1 (0.1–4.47) 0.601 (0.42–0.78) 0.253 n.s. 0.92 (0.1–2.93) 0.1 (0.1–6.23) 0.515 (0.30–0.73) 0.886 n.s.
IL-8 18.16 (12.51–34.72) 26.47 (18.65–68.36) 0.643 (0.46–0.82) 0.182 n.s. 13.80 12.06–24.72) 28.06 (20.60–68.36) 0.769 (0.59–0.94) 0.011 n.s.
IL-13 6.51 (4.38–10.16) 13.12 (8.37–29.69) 0.678 (0.50–0.85) 0.050 n.s. 5.31 (1.25–15.08) 16.64 (9.12–29.69) 0.733 (0.55–0.92) 0.029 n.s.
IL-15 4.41 (3.26–6.43) 7.46 (4.0–9.4) 0.69 (0.53–0.86) 0.038 n.s. 4.57 (3.26–7.75) 8.17 (4.91–9.40) 0.729 (0.54–0.91) 0.033 n.s.
IL-18 85.36 (67.81–142.2) 136.5 (118.9–166.3) 0.726 (0.56- 0.89) 0.015 n.s. 119 (66.34–156) 131 (119–156) 0.644 (0.44–0.85) 0.187 n.s.
IL-21 884 (126–1451) 1779 (682–6266) 0.722 (0.55–0.89) 0.030 n.s. 898 (10–1451) 2182 (1326–6266) 0.782 (0.61–0.95) 0.007 0.038
IL-25 1132 (329–1580) 2422 (617–6174) 0.738 (0.57–0.90) 0.010 n.s. 1098 (28.28–1687) 2847 (617–8210) 0.778 (0.61–0.95) 0.009 n.s.
IFNβ 868 (10–1260) 1713 (10–4492) 0.692 (0.52- 0.86) 0.037 n.s. 137 (10–1260) 2501 (10–4492) 0.733 (0.54–0.92) 0.026 n.s.
CXCL9 28.98 (16.74–62.15) 116.5 (30.87–116.5) 0.746 (0.59- 0.89) 0.007 0.031 27.36 (13.51–37.82) 62.97 (35.6–116.5) 0.804 (0.64–0.96) 0.004 0.012
CXCL10 211 (159–259) 268 (238–597) 0.692 (0.52- 0.86) 0.041 n.s. 209 (129–252) 322 (238–597) 0.796 (0.63–0.96) 0.005 0.024
CXCL11 91 (25.4–109.8) 141 (67.4–191.5) 0.700 (0.53 0.87) 0.069 n.s. 35.31 (22.49–98.95) 151 (46.53–192) 0.787 (0.61–0.96) 0.007 0.008
G-CSF 16.45 (89.6–20.86) 53.69 (14.28–193.7) 0.670 (0.49- 0.85) 0.054 n.s. 17.57 (9.6–20.86) 61.4 (20.1–194) 0.769 (0.58–0.95) 0.011 n.s.
37,870 (29,212– 46,047 (30,311– 38,373 (35,492– 46,422 (38,745–
Galectin-1 0.658 (0.48–0.83) 0.095 n.s. 0.752 (0.57–0.93) 0.011 0.002
44,078) 59,136) 46,523) 60,042)
S100A8/A9 2040 (1000–3100) 3070 (2600–4500) 0.757 (0.60- 0.91) 0.005 0.016 2160 (1450–3200) 3920 (3270–6100) 0.849 (0.69–0.99) 0.001 < 0.001
Table 2. Performance of biomarkers showing significant differences (all in pg/ml except IFNβ in U/ml
and S100A8/A9 in ng/ml). CI confidence interval, AUCarea under curve; asignificance of ROC analyses;
b
adjusted significance using Kruskal Wallis test with Bonferroni post-hoc correction for multiple comparisons.
Significant P-values indicated in bold.
indicative of a background T(h1) cell activation, but also innate immune activation (e.g., shown by S100A8/
A9) that is more pronounced in those considered in clinical remission who likely continue having subclinical
inflammatory processes.
There were only relatively small alterations in the biomarker concentrations when comparing T1 and T2
samples, both in patients with stable and unstable remission. It appears conceivable that the fluctuations in serum
biomarkers during inactive and active disease phases in individual patients are less prominent than dysbalanced
immune activity that is present as a background characteristic of the patient group, as these differences are even
observed during times of clinically inactive disease in remission. Although our results have to be interpreted
Scientific Reports | (2021) 11:6690 | https://doi.org/10.1038/s41598-021-86251-w 7
Vol.:(0123456789)www.nature.com/scientificreports/
with caution in light of the limited patient numbers, the correlograms indicate that differences in T cell activation
and to some extent also innate immunity as well as IFN-related pathways may influence a background immune
activation that can influence the risk of relapsing disease.
A set of markers used to indicate molecular signatures may be more suitable for precision medicine than
single biomarkers, as they can unmask complex processes rather than a single phenomenon. For patients with
Rheumatoid Arthritis (RA), treat-to-target strategies and tight control are nowadays cornerstones of patient man-
agement, and biomarker panels have been introduced and validated for clinical purposes32. There are important
distinctions between RA, CD and UC, suggesting differences in the underlying pathways driving each disease.
However, the unifying treatment target is disease remission, mainly defined as clinical remission supported by
endoscopy or imaging. Biomarker remission (normal blood cells counts, CRP, fecal calprotectin) is considered
as an adjunctive t arget3. Although fecal markers are considered non-invasive means to monitor intestinal inflam-
mation, the lack of conclusive data on relapse prediction and the low acceptance of stool sampling by patients
is limiting their widespread u se19–23. A need therefore exists for blood-based biomarkers that accurately detect
disease activity in IBD.
A recent study by D’Haens et al. used a commercial assay of multiple markers indicating mucosal damage and
repair processes (PROMETHEUS Monitr Crohn’s Disease Test) to calculate an endoscopic healing index (EHI)
that identifies patients with resolution of endoscopic disease activity33. The test applies a proprietary algorithm
with 13 biomarkers to produce a quantitative EHI score. The authors used very strong outcome measures of
endoscopic healing that were not available to us. The study also didn’t test the prediction of remission of risk or
relapses. Some of the biomarkers that revealed promising results in our small IBD cohort were not considered by
D’Haens et al., because they showed poor analytical reproducibility, low detection rate, and/or lack of correlation
to disease severity in preliminary studies. These markers were eliminated from further consideration, and data
are not presented. The study was funded by Prometheus, several authors were either employees or at least had
a relation to Prometheus, and the company was responsible for running assays and analyses that are only par-
tially reported34. Even though this limits the interpretation of data, it appears promising that the accuracy of the
blood-based multi-marker set was comparable to fecal calprotectin and better than measurement of serum CRP.
As a limitation, we could only use clinical disease activity indices (CDAI and UCAI) to define stable and
unstable remission. Endoscopic or histological disease activity measures were not available from the participants
included in remission. It is a drawback of CDAI/UCAI scores that they may not correlate well with endoscopi-
cally proven intestinal inflammation. The relatively small sample number limits the statistical power of our study.
Especially the number of samples from CD patients available for the retrospective project is a significant limita-
tion. This also excluded further stratification of patients, e.g. with regard to disease characteristics or therapies.
As an example, two CD patients received systemic steroids at inclusion, one reduced the dose at visit 1 from 5
to 4 mg/day, and the other one actually stopped as visit 1. We cannot fully exclude that medication changes in
therapy influence the risk of flare at future time point due to poorly controlled disease. In addition, we could
not correlate our data to repeated endoscopic measures in the cohort recruited in disease remission. However,
we consider the results promising and in line with other studies showing that serum biomarker panels have a
potential to identify IBD from symptomatic controls and to predict future disease c ourse35. Future studies will
need to confirm whether elevated inflammatory markers in IBD patients in clinical remission as defined by clini-
cal disease activity indices may represent a stage of residual inflammation, which progresses to cause an eventual
clinical relapse of the disease. Conversely, it is conceivable that measuring biomarker panels may serve as a tool
for measuring the effects of treatment. Consequently, treatment of IBD could be tapered at a point where the
biomarkers suggest that the relapse of disease is unlikely to occur within a defined period. Our analyses indicate
that especially S100A8/A9 analyses may have a predictive power for all IBD patients and even better for UC
patients. A recent other study also suggested S100A8/A9 and either CRP or albumin for a prognostic model to
predict treatment escalation in I BD36.
In conclusion, there is a strong need for defining appropriate variables for follow-up recommendations which
is vital to IBD treatment and management. Based on our results, it seems a feasible goal to apply molecular sig-
natures, measurable in blood and available for tight monitoring of disease activity. Future studies will test the
treat-to-target approaches in larger cohorts and can be used to validate the usefulness of biomarker signatures
for tight monitoring of disease activity.
Received: 29 September 2020; Accepted: 11 March 2021
References
1. Bouguen, G. et al. Treat to target: A proposed new paradigm for the management of Crohn’s disease. Clin. Gastroenterol. Hepatol.
13, 1042-1050 e1042. https://doi.org/10.1016/j.cgh.2013.09.006 (2015).
2. Baumgart, D. C. & Sandborn, W. J. Inflammatory bowel disease: Clinical aspects and established and evolving therapies. Lancet
369, 1641–1657. https://doi.org/10.1016/S0140-6736(07)60751-X (2007).
3. Bernstein, C. N. et al. World Gastroenterology Organization Practice Guidelines for the diagnosis and management of IBD in
2010. Inflamm. Bowel Dis. 16, 112–124. https://doi.org/10.1002/ibd.21048 (2010).
4. Feuerstein, J. D. et al. AGA clinical practice guidelines on the management of moderate to severe ulcerative colitis. Gastroenterology
https://doi.org/10.1053/j.gastro.2020.01.006 (2020).
5. Ungaro, R. et al. A treat-to-target update in ulcerative colitis: A systematic review. Am. J. Gastroenterol. 114, 874–883. https://doi.
org/10.14309/ajg.0000000000000183 (2019).
6. Ungaro, R. C. et al. Higher trough vedolizumab concentrations during maintenance therapy are associated with corticosteroid-free
remission in inflammatory bowel disease. J. Crohns Colitis 13, 963–969. https://doi.org/10.1093/ecco-jcc/jjz041 (2019).
Scientific Reports | (2021) 11:6690 | https://doi.org/10.1038/s41598-021-86251-w 8
Vol:.(1234567890)www.nature.com/scientificreports/
7. Peyrin-Biroulet, L. et al. Selecting therapeutic targets in inflammatory bowel disease (STRIDE): Determining therapeutic goals
for treat-to-target. Am. J. Gastroenterol. 110, 1324–1338. https://doi.org/10.1038/ajg.2015.233 (2015).
8. Walsh, A., Palmer, R. & Travis, S. Mucosal healing as a target of therapy for colonic inflammatory bowel disease and methods to
score disease activity. Gastrointest. Endosc. Clin. N. Am. 24, 367–378. https://doi.org/10.1016/j.giec.2014.03.005 (2014).
9. Mao, R. et al. Fecal calprotectin in predicting relapse of inflammatory bowel diseases: A meta-analysis of prospective studies.
Inflamm. Bowel Dis. https://doi.org/10.1002/ibd.22861 (2012).
10. Louis, E. Do we still need predictors of disease severity when applying a treat-to-target approach in inflammatory bowel disease?.
J. Crohns Colitis 13, 399–400. https://doi.org/10.1093/ecco-jcc/jjy182 (2019).
11. Dulai, P. S. et al. Approaches to integrating biomarkers into clinical trials and care pathways as targets for the treatment of inflam-
matory bowel diseases. Gastroenterology 157, 1032-1043 e1031. https://doi.org/10.1053/j.gastro.2019.06.018 (2019).
12. Maaser, C. et al. ECCO-ESGAR guideline for diagnostic assessment in IBD part 1: Initial diagnosis, monitoring of known IBD,
detection of complications. J. Crohns Colitis 13, 144–164. https://doi.org/10.1093/ecco-jcc/jjy113 (2019).
13. Sturm, A. et al. ECCO-ESGAR guideline for diagnostic assessment in IBD part 2: IBD scores and general principles and technical
aspects. J. Crohns Colitis 13, 273–284. https://doi.org/10.1093/ecco-jcc/jjy114 (2019).
14. Denson, L. A. et al. Challenges in IBD research: Precision medicine. Inflamm. Bowel Dis. 25, S31–S39. https://doi.org/10.1093/
ibd/izz078 (2019).
15. Mak, L. Y. et al. Combined use of common fecal and blood markers for detection of endoscopically active inflammatory bowel
disease. Clin. Transl. Gastroenterol. 11, e00138. https://doi.org/10.14309/ctg.0000000000000138 (2020).
16. Musci, J. O., Cornish, J. S. & Dabritz, J. Utility of surrogate markers for the prediction of relapses in inflammatory bowel diseases.
J. Gastroenterol. 51, 531–547. https://doi.org/10.1007/s00535-016-1191-3 (2016).
17. Meuwis, M. A. et al. Serum calprotectin as a biomarker for Crohn’s disease. J. Crohns Colitis 7, e678–e683. https://d oi.o
rg/1 0.1 016/j.
crohns.2013.06.008 (2013).
18. Colombel, J. F. et al. Effect of tight control management on Crohn’s disease (CALM): A multicentre, randomised, controlled phase
3 trial. Lancet 390, 2779–2789. https://doi.org/10.1016/S0140-6736(17)32641-7 (2018).
19. Buisson, A. et al. Comparative acceptability and perceived clinical utility of monitoring tools: A nationwide survey of patients with
inflammatory bowel disease. Inflamm. Bowel Dis. 23, 1425–1433. https://doi.org/10.1097/MIB.0000000000001140 (2017).
20. Kalla, R. et al. Patients’ perceptions of faecal calprotectin testing in inflammatory bowel disease: Results from a prospective mul-
ticentre patient-based survey. Scand. J. Gastroenterol. 53, 1437–1442. https://doi.org/10.1080/00365521.2018.1527394 (2018).
21. Limketkai, B. N. et al. US practice patterns and impact of monitoring for mucosal inflammation after biologic initiation in inflam-
matory bowel disease. Inflamm. Bowel Dis. 25, 1828–1837. https://doi.org/10.1093/ibd/izz081 (2019).
22. van Deen, W. K. et al. A nationwide 2010–2012 analysis of U.S. health care utilization in inflammatory bowel diseases. Inflamm.
Bowel Dis. 20, 1747–1753. https://doi.org/10.1097/MIB.0000000000000139 (2014).
23. Marechal, C. et al. Compliance with the faecal calprotectin test in patients with inflammatory bowel disease. United Eur. Gastro-
enterol. J. 5, 702–707. https://doi.org/10.1177/2050640616686517 (2017).
24. Mosli, M. H. et al. C-reactive protein, fecal calprotectin, and stool lactoferrin for detection of endoscopic activity in symptomatic
inflammatory bowel disease patients: A systematic review and meta-analysis. Am. J. Gastroenterol. 110, 802–819. https://doi.org/
10.1038/ajg.2015.120 (2015).
25. Dabritz, J. et al. Improving relapse prediction in inflammatory bowel disease by neutrophil-derived S100A12. Inflamm. Bowel Dis.
19, 1130–1138. https://doi.org/10.1097/MIB.0b013e318280b1cd (2013).
26. Dabritz, J. et al. Granulocyte macrophage colony-stimulating factor auto-antibodies and disease relapse in inflammatory bowel
disease. Am. J. Gastroenterol. 108, 1901–1910. https://doi.org/10.1038/ajg.2013.360 (2013).
27. Foell, D. et al. Neutrophil derived human S100A12 (EN-RAGE) is strongly expressed during chronic active inflammatory bowel
disease. Gut 52, 847–853. https://doi.org/10.1136/gut.52.6.847 (2003).
28. Kaiser, T. et al. Faecal S100A12 as a non-invasive marker distinguishing inflammatory bowel disease from irritable bowel syndrome.
Gut 56, 1706–1713. https://doi.org/10.1136/gut.2006.113431 (2007).
29. de Jager, W. et al. Blood and synovial fluid cytokine signatures in patients with juvenile idiopathic arthritis: A cross-sectional study.
Ann. Rheum. Dis. 66, 589–598. https://doi.org/10.1136/ard.2006.061853 (2007).
30. de Jager, W. et al. Improved multiplex immunoassay performance in human plasma and synovial fluid following removal of inter-
fering heterophilic antibodies. J. Immunol. Methods 300, 124–135. https://doi.org/10.1016/j.jim.2005.03.009 (2005).
31. de Jager, W. et al. Simultaneous detection of 15 human cytokines in a single sample of stimulated peripheral blood mononuclear
cells. Clin. Diagn. Lab. Immunol. 10, 133–139 (2003).
32. Hambardzumyan, K. et al. Pretreatment multi-biomarker disease activity score and radiographic progression in early RA: Results
from the SWEFOT trial. Ann. Rheum. Dis. 74, 1102–1109. https://doi.org/10.1136/annrheumdis-2013-204986 (2015).
33. af Bjorkesten, C. G. et al. Mucosal healing at 3 months predicts long-term endoscopic remission in anti-TNF-treated luminal
Crohn’s disease. Scand. J. Gastroenterol. 48, 543–551. https://doi.org/10.3109/00365521.2013.772230 (2013).
34. D’Haens, G. et al. Development and validation of a test to monitor endoscopic activity in patients with Crohn’s disease based on
serum levels of proteins. Gastroenterology 158, 515-526 e510. https://doi.org/10.1053/j.gastro.2019.10.034 (2020).
35. Kalla, R. et al. Serum proteomic profiling at diagnosis predicts clinical course, and need for intensification of treatment in inflam-
matory bowel disease. J. Crohns Colitis https://doi.org/10.1093/ecco-jcc/jjaa230 (2020).
36. Kalla, R. et al. Serum calprotectin: A novel diagnostic and prognostic marker in inflammatory bowel diseases. Am. J. Gastroenterol.
111, 1796–1805. https://doi.org/10.1038/ajg.2016.342 (2016).
Acknowledgements
The authors thank Jost Langhorst (Dept. of Integrative Medicine, Klinikum Bamberg, Germany), Thomas
Krummenerl (Gastroenterology Clinic, Germania Campus Münster, Germany), Jan Heidemann (Department of
Gastroenterology, Klinikum Bielefeld-Mitte, Germany), Andreas Lügering (MVZ Portal 10, Münster, Germany),
Frank Lenze and Matthias Ross (both Department of Medicine B, University Hospital Münster, Germany) for
providing patient samples for the study. We also thank Melanie Saers and Susanne Schleifenbaum (Department
of Pediatric Rheumatology and Immunology, University of Münster, Germany) for excellent technical assistance.
Author contributions
C.K., M.L., J.D. and D.F. contributed to the conception and design of the study, the acquisition of data, and the
analysis and interpretation of data. T.W., M.B., S.R., J.W. and S.J.V. contributed to the analysis and interpretation
of data. All authors contributed to writing the article, revising it critically for important intellectual content, and
approving the final version to be submitted.
Scientific Reports | (2021) 11:6690 | https://doi.org/10.1038/s41598-021-86251-w 9
Vol.:(0123456789)www.nature.com/scientificreports/
Funding
Open Access funding enabled and organized by Projekt DEAL. This work was supported by an EU FP7 project
grant, ref. no. 305266 ‘MIAMI’ (Monitoring innate Immunity in Arthritis and Mucosal Inflammation). The initial
clinical study was funded by a grant of the Crohn’s and Colitis Foundation of America (CCFA ref. no. 1911).
Competing interests
DF received research grants from Pfizer. JD received consultation fees, research grants, royalties, or honorarium
from AbbVie, Shire/Takeda, Humana, Nestlé, Ferring, Amgen, Nutricia and GlaxoSmithKline. JW is employee
of BÜHLMANN. The other authors declare no conflict of interest.
Additional information
Supplementary Information The online version contains supplementary material available at https://doi.org/
10.1038/s41598-021-86251-w.
Correspondence and requests for materials should be addressed to D.F.
Reprints and permissions information is available at www.nature.com/reprints.
Publisher’s note Springer Nature remains neutral with regard to jurisdictional claims in published maps and
institutional affiliations.
Open Access This article is licensed under a Creative Commons Attribution 4.0 International
License, which permits use, sharing, adaptation, distribution and reproduction in any medium or
format, as long as you give appropriate credit to the original author(s) and the source, provide a link to the
Creative Commons licence, and indicate if changes were made. The images or other third party material in this
article are included in the article’s Creative Commons licence, unless indicated otherwise in a credit line to the
material. If material is not included in the article’s Creative Commons licence and your intended use is not
permitted by statutory regulation or exceeds the permitted use, you will need to obtain permission directly from
the copyright holder. To view a copy of this licence, visit http://creativecommons.org/licenses/by/4.0/.
© The Author(s) 2021
Scientific Reports | (2021) 11:6690 | https://doi.org/10.1038/s41598-021-86251-w 10
Vol:.(1234567890)You can also read