Functional connectome differences in individuals with hallucinations across the psychosis continuum - Nature
←
→
Page content transcription
If your browser does not render page correctly, please read the page content below
www.nature.com/scientificreports
OPEN Functional connectome differences
in individuals with hallucinations
across the psychosis continuum
Maya J. L. Schutte1*, Marc M. Bohlken2, Guusje Collin2,3,4, Lucija Abramovic2,
Marco P. M. Boks2, Wiepke Cahn2, Meenakshi Dauwan1, Edwin van Dellen2,5,
Neeltje E. M. van Haren2,6, Kenneth Hugdahl7,8,9,10, Sanne Koops1, René C. W. Mandl2 &
Iris E. C. Sommer1,7
Hallucinations may arise from an imbalance between sensory and higher cognitive brain regions,
reflected by alterations in functional connectivity. It is unknown whether hallucinations across the
psychosis continuum exhibit similar alterations in functional connectivity, suggesting a common
neural mechanism, or whether different mechanisms link to hallucinations across phenotypes. We
acquired resting-state functional MRI scans of 483 participants, including 40 non-clinical individuals
with hallucinations, 99 schizophrenia patients with hallucinations, 74 bipolar-I disorder patients
with hallucinations, 42 bipolar-I disorder patients without hallucinations, and 228 healthy controls.
The weighted connectivity matrices were compared using network-based statistics. Non-clinical
individuals with hallucinations and schizophrenia patients with hallucinations exhibited increased
connectivity, mainly among fronto-temporal and fronto-insula/cingulate areas compared to
controls (P < 0.001 adjusted). Differential effects were observed for bipolar-I disorder patients with
hallucinations versus controls, mainly characterized by decreased connectivity between fronto-
temporal and fronto-striatal areas (P = 0.012 adjusted). No connectivity alterations were found
between bipolar-I disorder patients without hallucinations and controls. Our results support the
notion that hallucinations in non-clinical individuals and schizophrenia patients are related to
altered interactions between sensory and higher-order cognitive brain regions. However, a different
dysconnectivity pattern was observed for bipolar-I disorder patients with hallucinations, which implies
a different neural mechanism across the psychosis continuum.
Hallucinations are a hallmark feature of schizophrenia, but occur in a range of psychiatric, neurological and
general medical c onditions1, and even in a minority of healthy i ndividuals2. Hallucinations, and other psychotic
phenomena, can be understood to exist along a continuum, ranging from subclinical symptoms in healthy indi-
viduals on one end, to individuals with a severe psychotic illness on the other3. Patients with bipolar disorder
who experience psychotic symptoms may hold a position in between both ends of the spectrum. However, it
remains to be determined if hallucinations in non-clinical individuals, patients with schizophrenia, and patients
with bipolar disorder share a common neural mechanism (and differ mainly in severity) or if hallucinations stem
from different neural mechanisms across these three groups.
Functional magnetic resonance imaging (fMRI) has proven to be a powerful tool to investigate neural mecha-
nisms associated with hallucinations. Studies have shown elevated levels of activity in sensory cortices during
1
Department of Biomedical Sciences of Cells and Systems, University of Groningen, University Medical Center
Groningen, Neuroimaging Center, PO Box 196, 9700 AD Groningen, The Netherlands. 2Department of Psychiatry,
University Medical Center Utrecht Brain Center, Utrecht University, Utrecht, The Netherlands. 3Department
of Psychiatry, Beth Israel Deaconess Medical Center and Massachusetts Mental Health Center, Harvard
Medical School, Boston, MA, USA. 4McGovern Institute for Brain Research, Department of Brain and Cognitive
Sciences, Massachusetts Institute of Technology, Cambridge, MA, USA. 5Department of Intensive Care
Medicine and UMC Utrecht Brain Center, University Medical Center Utrecht, Utrecht University, Utrecht,
The Netherlands. 6Department of Child and Adolescent Psychiatry, Erasmus Medical Centre, Rotterdam,
The Netherlands. 7Department of Biological and Medical Psychology, University of Bergen, Bergen,
Norway. 8Department of Psychiatry, Haukeland University Hospital, Bergen, Norway. 9Department of Radiology,
Haukeland University Hospital, Bergen, Norway. 10NORMENT Center for the Study of Mental Disorders, University
of Oslo, Oslo, Norway. *email: j.l.schutte@umcg.nl
Scientific Reports | (2021) 11:1108 | https://doi.org/10.1038/s41598-020-80657-8 1
Vol.:(0123456789)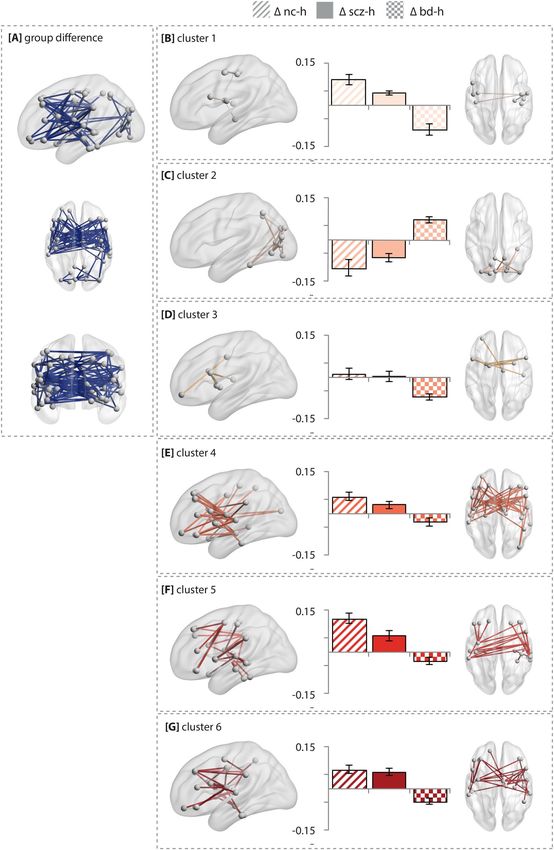
www.nature.com/scientificreports/
hallucinations in schizophrenia4,5, suggesting inadequate higher-order control over activity in these areas. Cog-
nitive control is mediated by cognitive regions, including areas of the default-mode, central executive, and task-
positive network6–9. Alterations in these networks have therefore been linked to hallucinations7. Furthermore,
the insula and (para)hippocampal areas have been related to hallucinations9–12 suggesting the involvement of
salience and memory processes. Taken together, hallucinations may arise from abnormal connectivity patterns
among several areas in the functional connectome13–15.
The question arises if these findings in schizophrenia can be extended to hallucinations in other phenotypic
groups. Hallucinations in healthy individuals and patients with bipolar disorder show partly overlapping phe-
nomenological features with hallucinations in schizophrenia16–18, although differences in frequency, duration, and
emotional content are consistently d escribed16,19. In addition, neuropsychological studies indicate that cognitive
control processes, including inhibition and executive functioning, are less altered in bipolar-I patients than in
schizophrenia patients and may be used for compensatory strategies20–22.
This study sets out to compare functional connectome alterations between individuals with hallucinations
across the psychosis continuum. To this end, we included patients with a schizophrenia spectrum disorder,
bipolar-I disorder with and without a lifetime history of hallucinations, and healthy controls with and without
hallucinations. Using a network-based approach, we examined whole-brain functional interactions between
brain regions, allowing us to study whether similar neural mechanisms are present across diagnostic groups.
Based on the notion that hallucinations are related to dysconnectivity, we hypothesize that the functional
connectome of all individuals with hallucinations will show widespread alterations, particularly in sensory areas
including the auditory and visual cortex, limbic areas related to salience processing, and frontal areas related to
cognitive control.
Materials and methods
Participants. This cross-sectional study included 116 patients with bipolar-I disorder, including 74 with a
lifetime history of hallucinations (BD-H) and 42 without a lifetime history of psychotic experiences (BD), 99
patients with a schizophrenia spectrum disorder, all of whom endorsed lifetime hallucinations (SCZ-H), 40 non-
clinical individuals with hallucinations (NC-H), and 228 healthy controls without any history of hallucinations
(HC). Participants were recruited as part of five different studies that were all conducted at the University Medi-
cal Center Utrecht. See Supplementary Methods for more information on recruitment and characterization. The
studies were approved by the Institutional Review Board of the University Medical Center Utrecht. All partici-
pants provided written informed consent. All methods and study procedures were conducted in accordance with
the relevant guidelines and regulations. Presence of current or lifetime hallucinations and assessment of hallu-
cination modality was established using the Comprehensive Assessment of Symptoms And History ( CASH23).
Hallucination severity was determined with the Positive and Negative Syndrome Scale (PANSS24) in patients
with schizophrenia, and with the Psychotic Symptoms Rating Scales ( PSYRATS25) in non-clinical individuals.
Hallucination severity was not assessed in patients with bipolar-I disorder, as none of these participants experi-
enced current hallucinations (see Table 1).
Data acquisition and preprocessing. See Supplementary Methods for a detailed description of acquisi-
tion parameters, preprocessing steps and motion correction.
Functional network construction. Average timeseries for each participant were extracted from N = 90
functional regions (nodes) of the automated anatomical labeling (AAL) a tlas26 and N = 260 nodes of the Power
atlas27 covering cortical and subcortical brain regions, but not the cerebellum. Wavelet decompositions to each of
the regional time series were applied, extracting wavelet coefficients in scale 4 (0.05–0.10 Hz)28,29. Wavelet filter-
ing was done by the maximal overlap discrete wavelet transform (MODWT) method using the WMSTA toolbox
in Matlab (http://www.atmos.washington.edu/~wmtsa/). Functional connectivity was estimated between wave-
let coefficients of any pair of regions i and j (edges) using wavelet coherence, done by the mscohere function in
Matlab. See the Supplementary Material for more details on wavelet coherence.
Global connectome alterations. We analysed alterations in global network organization related to hal-
lucinations. A detailed description of the graph measures can be found in the Supplemental Methods.
Network based statistics. A Network-Based Statistic (NBS) analysis30,31 was used to obtain information
about the localization of connectivity alterations in the overall connectome. Interconnected components of
altered connections were identified within the overall connectome using two-sided F-tests to explore increased
and decreased levels of functional connectivity (instead of multiple one-sided t-tests). A Family Wise Error
(FWE) adjusted P-value was calculated for each component using permutation testing (10,000 permutations) to
determine the likelihood that a component of this size could arise by c hance30. We compared all four participant
groups (NC-H, SCZ-H, BD-H, BD) to controls (HC) in order to investigate if similar alterations are present in
the hallucination groups, and if different alterations would be observed for the bipolar-I patients without hallu-
cinations. We conducted these analyses for both the structural AAL-90 and functional Power-260 atlas, as there
is some controversy regarding the use of a structural atlas in functional connectivity analyses.
Following Fornito et al.32, we organized all nodes of the AAL atlas into their corresponding lobes, and cal-
culated the proportion of altered connections between each pair of lobes to pinpoint the lobes with the most
alterations. In order to obtain more specific regional information on the most important nodes in the network,
we ranked the nodes in the NBS networks on node degree per group, similar to Zalesky et al.34. In addition, a
conjunction analysis was conducted to test for overlap of connections in each NBS network.
Scientific Reports | (2021) 11:1108 | https://doi.org/10.1038/s41598-020-80657-8 2
Vol:.(1234567890)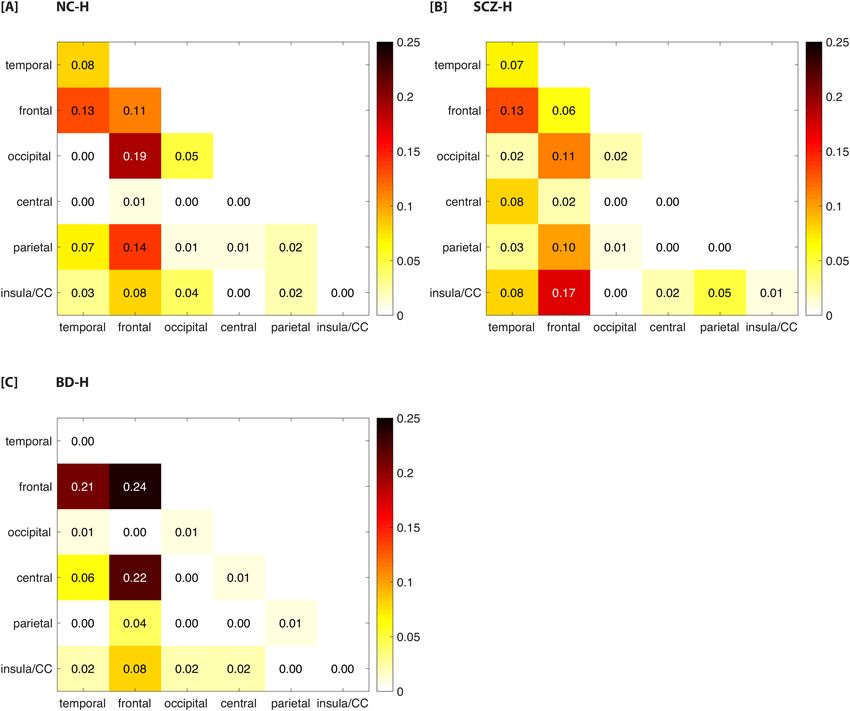
www.nature.com/scientificreports/
SCZ-H (n = 99) BD-H (n = 74) BD (n = 42) NC-H (n = 40) HC (n = 228) P value
Age, mean (SD), years 32.3 (10.9) 46.2 (11.6) 52.3 (11.9) 43.1 (14.5) 40.7 (14.6) < 0.001*
Gender, m/f 67/32 37/37 23/19 10/30 121/107 < 0.001*
Handedness, R/L 85/8 65/8 36/7 30/10 190/37 0.106
Motion, mm
Relative mean displacement 0.1 (0.04) 0.1 (0.03) 0.1 (0.03) 0.08 (0.03) 0.08 (0.03) < 0.001*
Diagnosis, No. (%)
Schizophrenia 59 (59.6)
Schizoaffective disorder 17 (17.2)
Schizophreniform disorder 1 (1.0)
Schizotypal personality 1 (1.0)
Psychosis NOS 20 (20.2)
Bipolar-I disorder 74 (100) 74 (100)
Medication, No. (%)
Antipsychotics 83 (83.8) 39 (52.7) 9 (21.4) 0 (0.0) 0 (0.0)
Lithium 5 (5.1) 42 (56.8) 27 (64.3) 0 (0.0) 0 (0.0)
Anti-depressants 22 (22.2) 16 (21.6) 10 (23.8) 2 (5.0) 3 (1.3)
Hallucinations lifetime, No. (%) 99 (100) 74 (100) 0 (0.0) 40 (100) 0 (0.0)
Auditory 80 (80.8) 39 (52.7) 0 (0.0) 40 (100) 0 (0.0) < 0.001*
Visual 53 (53.5) 51 (68.9) 0 (0.0) 33 (82.5) 0 (0.0) < 0.001*
Hallucinations current, No. (%) 57 (65.5) 0 (0.0) 0 (0.0) 40 (100) 0 (0.0)
Delusions lifetime, No. (%) 72 (72.7) 64 (86.5) 0 (0.0) 14 (35.0) 1 (0.4)
Table 1. Participant characteristics on demographic and clinical variables (n = 483). Differences between
continuous variables were tested with a one-way ANOVA, and differences in dichotomous variables with Chi-
square tests. Significance was set at P < 0.05. Significant differences are indicated by an asterisk (*). Current
hallucinations means experiences in the last month. The current hallucinations in the SCZ-H were based on
the P3 > 2 PANSS, and in NC-H with the frequency item of the PSYRATS. Number of cases with missing data:
Diagnosis n = 1 SCZ-H; Antipsychotics n = 10 HC; n = 5 SCZ-H; n = 3 BD-H; n = 1 BD. Lithium n = 10 HC;
n = 6 SCZ-H. Antidepressants; n = 10 HC; n = 16 SCZ-H; Lifetime hallucinations n = 4 HC; Auditory n = 4 HC;
n = 11 SCZ-H; n = 2 BD-H. Visual n = 5 HC; n = 15 SCZ-H. Olfactory n = 5 HC; n = 17 SCZ-H. Tactile n = 5 HC;
n = 14 SCZ-H. Current hallucinations: SCZ-H = 23. Lifetime delusions; n = 5 HC; n = 3 NC-H; n = 21 SCZ-H.
NC-H non-clinical individuals with hallucinations, NOS not otherwise specified, BD-H bipolar-I disorder
with lifetime history of hallucinations, BD bipolar-I disorder without lifetime history of hallucinations, SCZ-H
schizophrenia spectrum disorder with hallucinations.
K‑means clustering. To directly test for differences in dysconnectivity between the hallucination groups,
we compared the three hallucination groups (NC-H, SCZ-H, and BD-H) in one NBS contrast. To help interpret
the findings of this analysis, the connections in the resulting component were fed into a k-means clustering
analysis (implemented in Matlab)33. This allowed us to cluster connections that behaved either similarly or dif-
ferent in terms of decreased or increased connectivity across the three hallucination groups (i.e. NC-H, SCZ-H,
BD-H) (see Supplemental Material).
Symptom correlations. To test for associations with hallucination severity, PANSS item P3-Hallucina-
tions was assessed for correlations with global network metrics using a non-parametric Spearman correlation
within the schizophrenia group. Similarly, PSYRATS items frequency and severity of auditory hallucinations
were explored for associations with network metrics in the non-clinical group. To correct for multiple testing,
correlations are reported at P < 0.05 false discovery rate (FDR).
Hallucination modality. A significant difference was found in the reported hallucination modality across
the three hallucination groups (χ2(4) = 366.0, P < 0.001 for auditory; χ2(4) = 265.3, P < 0.001 for visual, see
Table 1). To explore effects of hallucination modality, we replicated the NBS analyses in a subgroup of partici-
pants only experiencing auditory hallucinations. We compared a subgroup of bipolar-I disorder patients who all
only experienced auditory hallucinations (n = 39), to healthy controls (n = 228), as well as schizophrenia patients
with only auditory hallucinations (n = 28) versus healthy controls (n = 228). Repeating our analyses in the non-
clinical group with only auditory hallucinations was not feasible, as n = 7 participants experienced only auditory
hallucinations.
Furthermore, we applied a random forest classification algorithm (part of the BrainWave software https://
home.kpn.nl/stam7883/brainwave.html) to identify a set of connections in each NBS network that could dif-
ferentiate between the experience of having either auditory or visual hallucinations within each group (i.e.
NC-H, SCZ-H and BD-H). Each decision tree in the random forest is built using a bootstrap sample (thus with
replacement), from the original data. Both bootstrap aggregating (i.e., bagging) and random feature selection
Scientific Reports | (2021) 11:1108 | https://doi.org/10.1038/s41598-020-80657-8 3
Vol.:(0123456789)www.nature.com/scientificreports/
Scientific Reports | (2021) 11:1108 | https://doi.org/10.1038/s41598-020-80657-8 4
Vol:.(1234567890)www.nature.com/scientificreports/
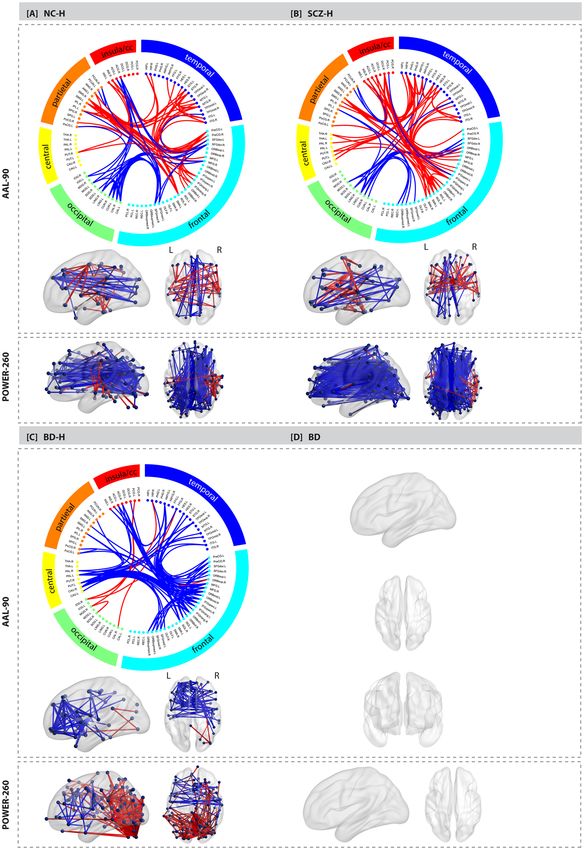
◂Figure 1. Functional connectome alterations in the non-clinical and clinical groups compared to healthy
controls. The Network Based Statistics results of the AAL atlas are depicted in de upper grey panel and the
results of the Power atlas in the lower grey panel: (a) non-clinical individuals with hallucinations (n = 40) vs
healthy controls (n = 228); (b) schizophrenia patients with hallucinations (n = 99) vs healthy controls (n = 228);
(c) bipolar-I disorder patients with lifetime history of hallucinations (n = 74) vs healthy controls (n = 228). (d)
bipolar-I disorder patients without a lifetime history of psychosis (n = 42) did not differ from controls (n = 228).
The edges are color-coded based on either an increase (red) or decrease (blue) in connectivity compared
to controls. The circle plot depicts all 90 nodes of the AAL atlas clustered according to their cerebral lobe.
Group differences were tested at 10,000 permutations P < 0.05 FWE corrected. Age and sex were included as
covariates. The corresponding test-statistics, a list of altered connections (Supplementary Tables 6–8 for AAL
atlas, Supplementary Tables 10–12 for Power atlas), and abbreviations for the AAL brain regions depicted in the
circle plot (Supplementary Table 16) can be found in the Supplementary. BD bipolar-I disorder without lifetime
history of hallucinations, BD-H bipolar-I disorder with lifetime history of hallucinations, CC cingulate cortex,
NC-H non-clinical individuals with hallucinations, SCZ-H schizophrenia spectrum disorder with hallucinations.
avoid overfitting and reduce variance in the model, which results in uncorrelated trees34. Hence, the random
forest classifier has the advantage that cross-validation is done internally, meaning that no separate test set of
participants is needed to estimate the generalized error of the training set34.
The random forest parameters, mTry (i.e., the number of input variables chosen randomly at each split cal-
culated by the square root of number of features) and nTree (i.e., the number of trees to grow for each forest)
were set to 9 and 500, respectively.
In every classification, each feature is given a variable importance (VIMP) score between 0 and 1. Weighted
accuracy, sensitivity and specificity were used to assess the random forest for its capability to distinguish between
visual and auditory hallucinations. We computed weighted accuracies to correct for unequal group s izes35, see
Supplementary Methods for more details on the random forest classifier.
Features fed into the classifier were selected based on their occurrence in the NBS network per group. The
edges as presented in Supplementary Tables 13–15 were included for each of the groups. The number in front
of each edge pair corresponds to the number of each edge pair in Supplementary Fig. 7. Two random forest
parameters that need to be entered into the model were set at mTry = 9; and nTree = 500. mTry is the square root
number of features, and the nTree is the number of trees to grow for each forest.
Note that in schizophrenia patients and non-clinical individuals, the condition ‘visual hallucinations’ means
that participants experienced both auditory and visual hallucinations (the largest proportion of participants all
endorsed auditory hallucinations, see Table 1). The condition ‘auditory hallucinations’ means that schizophrenia
patients and non-clinical individuals experienced only auditory hallucinations. A clearer distinction between
only auditory and only visual could be made in bipolar-I disorder patients. Please see Supplementary Methods
for more information on cross validation of the random forest classifier.
Confounding effects. Due to differences in demographic variables and motion parameters, several valida-
tion analyses were conducted and reported in the Supplementary Methods and Results. A quality check of dis-
tance dependent effects of motion on edge strength per participant group can be found in Supplementary Fig. 1.
Results
Participant characteristics. A total of 483 participants were included in the analyses; see Table 1 for
demographic and clinical characteristics, and Supplementary Tables 1, 2 for more information on exclusion of
subjects (e.g. due to effects of motion). Schizophrenia patients were primarily characterized by lifetime audi-
tory (80.8%) and visual (53.5%) hallucinations. Non-clinical individuals with hallucinations all experienced
lifetime auditory hallucinations (100%) and the large majority (82.5%) also experienced visual hallucinations.
Conversely, bipolar-I disorder patients mostly experienced visual hallucinations (68.9%), whereas about half
(52.7%) experienced auditory hallucinations.
In line with previous studies, there was a higher proportion of males in the schizophrenia group, and a higher
proportion of females in the non-clinical group (χ2(4) = 21.5, P < 0.001). A significant difference for age was
found (F(4) = 21.7, P < 0.001), with the schizophrenia group being younger and bipolar-I disorder group being
older than other three groups (post-hoc tests in Supplementary Tables 3, 4). As age and sex were not collinear,
these variables were added as covariates in all analyses (see Supplementary Results). The groups also differed in
motion parameters (F(4) = 20.3, P < 0.001), with patients with bipolar-I disorder and schizophrenia showing more
movement than healthy controls and non-clinical individuals. Additional analyses revealed a minimal influence
of motion on connectivity measures (see Supplementary Fig. 1).
Global connectome alterations. There were no significant differences in metrics of global network
topology between the groups, see the Supplemental Results for more information.
Network based statistics. When separately comparing each hallucination group to controls, schizo-
phrenia patients and non-clinical individuals with hallucinations exhibited a similar pattern of increased and
decreased connectivity between a wide range of brain areas (P < 0.001 FWE corrected, for both; see Fig. 1A,B),
whereas bipolar-I disorder patients with hallucinations revealed a markedly different pattern of mostly decreased
connectivity (P = 0.012 FWE corrected; see Fig. 1C). Bipolar-I disorder patients without hallucinations did not
Scientific Reports | (2021) 11:1108 | https://doi.org/10.1038/s41598-020-80657-8 5
Vol.:(0123456789)www.nature.com/scientificreports/
Figure 2. Proportion of altered connections between each pair of lobes for the three hallucination groups
relative to controls. The number of altered links between each pair of lobes was divided by the total number of
altered pair-wise links based on the results of the AAL atlas. (a) non-clinical individuals with hallucinations
(n = 40) vs healthy controls (n = 228); (b) schizophrenia patients with hallucinations (n = 99) vs healthy controls
(n = 228); (c) bipolar-I disorder patients with lifetime history of hallucinations (n = 74) vs healthy controls
(n = 228). Note that the hippocampus and amygdala are assigned to the temporal lobe. The putamen, pallidum
and caudate are included in the central lobe. BD bipolar-I disorder without lifetime history of hallucinations,
BD-H bipolar-I disorder with lifetime history of hallucinations, CC cingulate cortex, NC-H non-clinical
individuals with hallucinations, SCZ-H schizophrenia spectrum disorder with hallucinations.
exhibit significant alterations in connectivity relative to controls (P > 0.05, FWE corrected; see Fig. 1D). For a
complete list of connections in each NBS network, see Supplementary Tables 6–8 for the AAL atlas and Sup-
plementary Tables 10–12 for the Power atlas. These results were broadly replicated in matched subgroups for the
AAL atlas, when age and sex were not included as covariates, see Supplementary Fig. 2.
Using the AAL atlas, the majority of connections comprising the NBS components in schizophrenia patients
and non-clinical individuals were found between fronto-insula/cingulate regions, followed by fronto-temporal,
temporo-temporal, fronto-occipital, and fronto-parietal alterations (see Fig. 2A,B). The NBS subnetwork in
schizophrenia patients included more altered connections among fronto-insula/cingulate and temporal-central
regions whereas altered fronto-occipital connections were more prevalent in non-clinical individuals. Similar
alterations were found when using the Power atlas, including increased connectivity between the auditory, sen-
sorimotor and cingulo-opercular control network (see Fig. 1 and Supplementary Fig. 3a,b for a circle plot of the
results for the Power atlas). Decreased connectivity was found mainly between the visual, default mode, central
executive and ventral attention networks in both groups.
For bipolar-I disorder patients with hallucinations, the most pronounced alterations were found among
fronto-temporal, fronto-central connections and between the bilateral frontal lobes when using the AAL atlas (see
Fig. 2). These results were replicated using the Power atlas, reporting increased connectivity between the visual,
default mode, subcortical and dorsal attention networks (see Fig. 1C and Supplementary Fig. 3C). Decreased
Scientific Reports | (2021) 11:1108 | https://doi.org/10.1038/s41598-020-80657-8 6
Vol:.(1234567890)www.nature.com/scientificreports/
NC-H (n = 40) SCZ-H (n = 99) BD-H (n = 74)
Node Degree Node Degree Node Degree
Frontal_Sup_Medial_R 12 Cingulum_Mid_R 17 Frontal_Mid_Orb_L 19
Precentral_L 12 Hippocampus_R 10 Amygdala_L 13
Rolandic_Oper_R 11 Frontal_Sup_Orb_L 9 Caudate_R 12
SupraMarginal_R 11 Rolandic_Oper_R 9 Frontal_Mid_L 12
Temporal_Sup_R 10 Rolandic_Oper_L 8 Frontal_Inf_Orb_L 10
Frontal_Sup_R 8 SupraMarginal_R 6 Pallidum_L 9
Cingulum_Ant_R 7 Frontal_Inf_Oper_R 5 Putamen_L 9
Lingual_R 7 Heschl_R 5 Frontal_Inf_Oper_R 6
Calcarine_L 6 Lingual_L 5 Precentral_R 6
Cuneus_L 6 Occipital_Mid_L 5 Rolandic_Oper_R 6
Frontal_Mid_R 5 ParaHippocampal_R 5 Rolandic_Oper_L 5
Frontal_Sup_Medial_L 5 Temporal_Sup_L 5 Cingulum_Ant_L 4
Temporal_Mid_R 5 Amygdala_R 4 Cingulum_Ant_R 4
Cuneus_R 4 Cingulum_Ant_R 4 Frontal_Inf_Oper_L 4
Frontal_Sup_L 4 Frontal_Inf_Tri_L 4 Frontal_Mid_R 4
Insula_R 4 Cuneus_R 3 Temporal_Pole_Sup_L 4
Parietal_Inf_L 4 Heschl_L 3 Frontal_Inf_Tri_L 3
Precentral_R 4 Insula_L 3 Frontal_Med_Orb_R 3
Temporal_Sup_L 4 Insula_R 3 Frontal_Sup_Medial_L 3
Angular_R 3 Occipital_Sup_L 3 Heschl_R 3
Calcarine_R 3 Parietal_Inf_L 3 Occipital_Inf_R 3
Frontal_Inf_Oper_R 3 Supp_Motor_Area_R 3 Parietal_Inf_R 3
Insula_L 3 Temporal_Inf_L 3 Caudate_L 2
Occipital_Mid_L 3 Caudate_R 2 Cingulum_Post_L 2
SupraMarginal_L 3 Cingulum_Ant_L 2 Frontal_Med_Orb_L 2
Temporal_Inf_L 3 Frontal_Inf_Orb_R 2 Frontal_Mid_Orb_R 2
Temporal_Inf_R 3 Frontal_Sup_L 2 Frontal_Sup_L 2
Cingulum_Ant_L 2 Pallidum_R 2 Frontal_Sup_Medial_R 2
Frontal_Inf_Tri_R 2 Postcentral_L 2 Frontal_Sup_Orb_R 2
Hippocampus_L 2 Precuneus_R 2 Frontal_Sup_R 2
Occipital_Inf_L 2 Putamen_L 2 Fusiform_R 2
Postcentral_L 2 Putamen_R 2 Hippocampus_R 2
Precuneus_R 2 Rectus_L 2 Insula_L 2
Putamen_R 2 Supp_Motor_Area_L 2 Occipital_Mid_R 2
Temporal_Mid_L 2 SupraMarginal_L 2 Olfactory_R 2
Amygdala_R 1 Temporal_Inf_R 2 Pallidum_R 2
Frontal_Inf_Orb_L 1 Temporal_Mid_L 2 Postcentral_L 2
Frontal_Inf_Orb_R 1 Thalamus_R 2 Postcentral_R 2
Frontal_Inf_Tri_L 1 Cingulum_Post_L 1 Precentral_L 2
Frontal_Mid_L 1 Cuneus_L 1 Temporal_Inf_L 2
Fusiform_R 1 Frontal_Inf_Oper_L 1 Temporal_Pole_Mid_L 2
Heschl_R 1 Frontal_Inf_Orb_L 1 Angular_R 1
Hippocampus_R 1 Frontal_Med_Orb_L 1 Calcarine_R 1
Occipital_Sup_L 1 Frontal_Med_Orb_R 1 Cingulum_Mid_R 1
Postcentral_R 1 Frontal_Mid_L 1 Frontal_Inf_Orb_R 1
Precuneus_L 1 Frontal_Mid_Orb_R 1 Frontal_Inf_Tri_R 1
Temporal_Pole_Mid_R 1 Frontal_Mid_R 1 Frontal_Sup_Orb_L 1
Temporal_Pole_Sup_R 1 Frontal_Sup_Medial_L 1 Insula_R 1
Frontal_Sup_Orb_R 1 Occipital_Sup_R 1
Frontal_Sup_R 1 SupraMarginal_R 1
Fusiform_L 1 Temporal_Mid_R 1
Hippocampus_L 1 Temporal_Sup_L 1
Parietal_Inf_R 1
Precentral_L 1
Precuneus_L 1
Continued
Scientific Reports | (2021) 11:1108 | https://doi.org/10.1038/s41598-020-80657-8 7
Vol.:(0123456789)www.nature.com/scientificreports/
NC-H (n = 40) SCZ-H (n = 99) BD-H (n = 74)
Node Degree Node Degree Node Degree
Temporal_Mid_R 1
Temporal_Pole_Sup_R 1
Table 2. Node degree of NBS network per group. NC-H non-clinical individuals with hallucinations, BD-
H bipolar-I disorder with lifetime history of hallucinations, SCZ-H schizophrenia spectrum disorder with
hallucinations.
connectivity was found between the auditory, sensorimotor, cingulo-opercular, salience and central-executive
network.
In schizophrenia patients, the node with the highest number of altered connections in the NBS component
was the left middle cingulate gyrus (see Table 2), whereas this was the right superior medial frontal gyrus for
non-clinical individuals, and left amygdala for bipolar-I disorder patients with hallucinations.
The conjunction analysis revealed considerable variation across the exact connections comprising the respec-
tive NBS networks, see Supplementary Fig. 4 and Supplementary Table 5 for a list of overlapping connections.
K‑means clustering. A direct NBS comparison of the three hallucination groups yielded a subnetwork of
connections that differed between non-clinical individuals, schizophrenia patients, and bipolar-I patients with
hallucinations (P < 0.001; see Fig. 3A and Supplementary Table 9 for a list of connections). To help interpret the
resulting subnetwork, a k-means clustering analysis was performed, which yielded six separate sets of connec-
tions across the hallucinating groups that behaved either similar or differently across groups (Fig. 3B–E). As
presented in Fig. 3, a similar pattern of connectivity alterations was observed for schizophrenia patients and
non-clinical individuals, including dysconnectivity among fronto-temporal, temporo-temporal, fronto-central
and occipital areas (Fig. 3B–E). Bipolar-I disorder patients with hallucinations revealed an inversed pattern of
dysconnectivity relative to schizophrenia and non-clinical individuals in terms of showing decreased versus
increased connectivity and vice versa. See Supplementary Table 9 for a list of connections per cluster.
Symptom correlates. None of the clinical variables was associated with either the weighted global effi-
ciency, weighted clustering coefficient, MST leaf fraction, MST diameter or edges within the NBS network in the
schizophrenia patients with hallucinations, or non-clinical individuals (all P > 0.05, FDR corrected).
Hallucination modality. When replicating the NBS analysis in a subgroup of bipolar-I participants with
only auditory hallucinations, we found similar alterations compared to the total sample of bipolar-I disorder
patients with hallucinations, except that increased activity in the occipital cortex was not found in bipolar-I
disorder patients with only auditory hallucinations (see Supplementary Fig. 6). When comparing schizophrenia
patients with only auditory hallucinations (n = 28) versus healthy controls (n = 228), results were not significant
at P > 0.05 FWE corrected.
Using the random forest machine learning algorithm, differentiating between auditory and visual hallu-
cinations in non-clinical individuals was possible with a weighted accuracy of 77.5%, sensitivity of 0.0% and
specificity of 93.9%, respectively. The connection between the left superior temporal gyrus and right rolandic
operculum (no. 19) was the most important discriminating feature. In both schizophrenia patients and bipolar-
I disorder patients, the weighted accuracy was at or below chance-level, meaning than differentiation was not
possible (schizophrenia: weighed accuracy of 50.0%, sensitivity of 26.0% and specificity of 64.1%; bipolar-I
disorder: weighted accuracy of 28.6%, sensitivity of 67.3% and specificity of 7.0%). See Supplementary Fig. 7 for
an overview of the results per group.
Discussion
This study compared functional connectivity alterations related to hallucinations in a large sample of patients
with schizophrenia, bipolar-I disorder, non-clinical individuals, and healthy controls. A range of connections was
found to be altered in schizophrenia patients and non-clinical individuals with hallucinations. These alterations
involved mainly increased connectivity between the insula, cingulate cortex, auditory, and language-related areas
in non-clinical individuals and schizophrenia patients, compared to controls. The non-clinical individuals and
schizophrenia patients exhibited remarkably similar disruptions of functional connectivity. In contrast, differ-
ential effects were observed for bipolar-I disorder patients with hallucinations versus controls, involving mainly
decreased connectivity between fronto-temporal and fronto-striatal areas. Bipolar-I disorder patients without
hallucinations did not show any connectivity alterations compared to controls. A direct group-wise comparison
confirmed connectivity alterations that were similar in patients with schizophrenia and non-clinical individu-
als, but inversed (decreased versus increased connectivity) in bipolar-I disorder patients. Thus, contrary to our
initial hypothesis, we did not find a similar pattern of functional connectivity alterations across the psychosis
continuum. This implies that individuals with hallucinations on the psychosis continuum may not necessarily
share a neural mechanism, despite overlapping phenomenological features.
Our results are in line with previous findings on schizophrenia and hallucinations, showing alterations in
functional connectivity in areas related to sensory processing and cognitive c ontrol4,5,10,12,36–38. Previous studies
Scientific Reports | (2021) 11:1108 | https://doi.org/10.1038/s41598-020-80657-8 8
Vol:.(1234567890)www.nature.com/scientificreports/
Figure 3. Sets of connections clustered according to their behavior in clinical and non-clinical individuals with
hallucinations. (A) The result of the overall group comparison between patients with schizophrenia (n = 99), patients with
bipolar-I disorder with (n = 74) and non-clinical individuals with hallucinations (n = 40) using the AAL atlas. (B–E) the
edges in the component that differed between the groups were clustered by a k-means clustering algorithm to elucidate
differences across the groups with hallucinations. Error bars represent the standard deviation of connectivity strength within
that particular cluster. The group differences were tested using an F-test at T = 8.0; P < 0.05 at 10,000 permutations. The test-
statistics and AAL labels corresponding to the altered connections per cluster can be found in Supplementary Table 9. Age
and sex were included as covariates. NC-H non-clinical individuals with hallucinations, BD-H bipolar-I disorder with lifetime
history of hallucinations, SCZ-H schizophrenia spectrum disorder with hallucinations.
Scientific Reports | (2021) 11:1108 | https://doi.org/10.1038/s41598-020-80657-8 9
Vol.:(0123456789)www.nature.com/scientificreports/
also reported increased connectivity among frontal, anterior cingulate, and insular cortex and language-related
areas in relation to hallucinatory e xperiences11,12.
Previous findings suggest similar functional connectivity alterations in healthy individuals with halluci-
nations as observed in schizophrenia with hallucinations38–40. Findings of altered structural connectivity in
healthy individuals with hallucinations are also broadly consistent with alterations found in schizophrenia with
hallucinations41,42. Our results confirm previous findings of similar brain alterations in healthy individuals with
hallucinations and schizophrenia patients.
Previous studies have showed both s imilar6,43 and d issimilar44 connectome alterations in schizophrenia and
psychotic bipolar disorder. Our findings could not confirm that bipolar-I patients with hallucinations showed
similar connectivity alterations as schizophrenia patients and non-clinical individuals with hallucinations. How-
ever, decreased connectivity between frontal and temporal areas, as observed in our sample of bipolar patients
with hallucinations, was previously reported in pediatric bipolar disorder patients and related to top-down
control45. Decreased connectivity between fronto-striatal areas and fronto-temporal areas has also been related
to mood dysregulation in bipolar d isorder46,47.
Our findings should be interpreted in light of methodological considerations. Differences in hallucinatory
modality across groups may be associated with the differential findings between schizophrenia patients and
non-clinical individuals versus bipolar-I disorder patients with hallucinations. In the latter group, a larger pro-
portion of patients experienced lifetime visual hallucinations (68.9%), with a smaller proportion (52.7%) report-
ing auditory hallucinations. Previous studies found modality-specific alterations in s chizophrenia48,49. Indeed,
we observed increased connectivity of the visual cortex in patients with bipolar-I disorder patients—but not
after repeating the analysis in bipolar-I disorder patients with only auditory hallucinations—suggesting that the
involvement of the visual cortex may be linked to the experience of visual hallucinations. To further explore
this notion, we applied a random forest machine learning algorithm. Classification accuracies around chance
level were found, meaning we did not find a set of connections able to discriminate between effects of auditory
versus visual hallucinations. As the sensitivity was around 0% in non-clinical individuals, these results must
be interpreted with caution. Because of using our dataset retrospectively, the dataset was not highly suitable to
investigate effects of hallucination modality, as the majority of participants endorsed both auditory and visual
hallucinations. Future studies could more thoroughly investigate this issue by recruiting patients who experience
hallucinations in only one modality.
Furthermore, recent advances have indicated that structural atlases might not be best suited to investigate
functional connectivity, we therefore replicated our results using the functional Power atlas. As the best method
regarding the use of brain atlases is currently inconclusive, we included results of both atlases as this may benefit
discussion in the field.
By taking advantage of a large cross-diagnostic sample, our findings add important new information on neural
mechanism of hallucinations across the psychosis continuum. However, we were unable to include a group of
schizophrenia patients without lifetime hallucinations, as most schizophrenia patients experience hallucinations
in their lifetime. Furthermore, we included participants based on the criterion of having experienced lifetime
hallucinations, regardless of current hallucination state. Thus, all participants share a general disposition to hal-
lucinate, but there were differences between groups in current hallucination state. However, using resting state
fMRI to study hallucinations is generally thought to be more sensitive to trait-associated connectivity alterations
which are relatively stable over time50,51. This assertion is in line with our finding that current symptom severity
was not significantly correlated with connectivity measures. Moreover, the average frequency of hallucinations
in the non-clinical individuals was once per week (much less frequent than in the schizophrenia patients), but
these individuals nonetheless exhibited a similar connectivity pattern as the schizophrenia patients. Together, this
suggests that our resting state measurements reflect trait- rather than state-characteristics. Moreover, comparison
of active hallucination state between schizophrenia and bipolar disorder may be biased by other confounding
effects including mood state, as hallucinations in bipolar disorder occur mainly in manic or depressive e pisodes17.
Another limitations concerns the fact that the bipolar-I disorder patients in the current study were all in
euthymic phase at time of scanning. Also, the group of bipolar-I disorder patients without hallucinations was
smaller in size (n = 42) than the group of bipolar-I disorder patients with hallucinations (n = 74). Taken together,
this could have contributed to the null-finding in bipolar-I patients without hallucinations, as larger sample sizes
might be needed to pick up more subtle aberrations in this group.
Group-differences in medication use may also have influenced our results. Lithium is suggested to normal-
ize brain function52–54, which may explain why bipolar-I disorder patients without lifetime hallucinations did
not reveal connectivity differences compared to controls. However, lithium users were evenly balanced across
both groups of bipolar-I disorder patients with and without hallucinations, and are thus unlikely to fully explain
our results. Also, it is unlikely that our findings can be attributed to the use of antipsychotic medication, as the
non-clinical individuals were free of medication use and nevertheless demonstrated similar alterations as the
medicated patients with schizophrenia. Confounding factors such as drug-induced hallucinations in the non-
clinical group are also unlikely, as none of the non-clinical participants had a positive urine test for illicit drugs55.
Potentially confounding effects of age, sex, and motion were tested in several ways, and were found to have
minimal influence. Note that our analyses were conducted after stringent exclusion of participants with high
motion. Afterward, the relative mean displacement ranged from 0.08 to 0.10 mm across groups, indicating
high-quality data.
Scientific Reports | (2021) 11:1108 | https://doi.org/10.1038/s41598-020-80657-8 10
Vol:.(1234567890)www.nature.com/scientificreports/
Conclusions
The findings of this study suggest that schizophrenia patients and non-clinical individuals with hallucinations
exhibit similar alterations in functional connectivity. In contrast, a markedly different pattern of connectivity
alterations was observed in bipolar-I patients with a lifetime history of hallucinations, encompassing different
regions and involving mainly reductions in connectivity as opposed to increases. These findings suggest a similar
neural mechanism for hallucinations in schizophrenia patients and non-clinical individuals, but a different neural
mechanism in bipolar-I disorder. If our findings of a different neural mechanism for hallucinations in bipolar
disorder can be replicated independently, this would warrant further investigation into whether hallucinations
in bipolar-I disorder should be treated differently in clinical practice. Further elucidating the role of large-scale
networks in the experience of hallucinations may enable tailored pharmaco-therapeutic interventions designed
to restore the balance between these networks.
Data availability
The datasets generated during and/or analysed during the current study are not publicly available as this study
was part of multiple larger studies of which not all data has yet been analysed and published. Data pertaining to
this manuscript are available from the corresponding author on reasonable request.
Received: 13 December 2019; Accepted: 17 December 2020
References
1. Sommer, I. E. & Kahn, R. S. Psychosis susceptibility syndrome: An alternative name for schizophrenia. Lancet Psychiatry. 1, 111
(2014).
2. Sommer, I. E., Koops, S. & Blom, J. D. Comparison of auditory hallucinations across different disorders and syndromes. Neuropsy-
chiatry. 2, 1–12 (2012).
3. Van Os, J., Hanssen, M., Bijl, R. V. & Ravelli, A. Strauss (1969) revisited: A psychosis continuum in the general population?.
Schizophr. Res. 45, 11–20 (2000).
4. Jardri, R., Pouchet, A., Pins, D. & Thomas, P. Cortical activations during auditory verbal hallucinations in schizophrenia: A
coordinate-based meta-analysis. Am. J. Psychiatry. 168, 73–81 (2011).
5. Kompus, K., Westerhausen, R. & Hugdahl, K. The, “paradoxical” engagement of the primary auditory cortex in patients with
auditory verbal hallucinations: A meta-analysis of functional neuroimaging studies. Neuropsychologia. 49, 3361–3369 (2011).
6. Baker, J. T. et al. Disruption of cortical association networks in schizophrenia and psychotic bipolar disorder. JAMA Psychiatry.
71, 109–118 (2014).
7. Hugdahl, K., Raichle, M. E., Mitra, A. & Specht, K. On the existence of a generalized non-specific task-dependent network. Front.
Hum. Neurosci. 9, 430 (2015).
8. Alderson-Day, B. et al. Auditory Hallucinations and the brain’s resting-state networks: Findings and methodological observations.
Schizophr. Bull. 42, 1110–1123 (2016).
9. Lefebvre, S. et al. Network dynamics during the different stages of hallucinations in schizophrenia. Hum. Brain Mapp. 37, 2571–2586
(2016).
10. Diederen, K. M. et al. Deactivation of the parahippocampal gyrus preceding auditory hallucinations in schizophrenia. Am. J.
Psychiatry. 167, 427–435 (2010).
11. Liemburg, E. J. et al. Abnormal connectivity between attentional, language and auditory networks in schizophrenia. Schizophr.
Res. 135, 15–22 (2012).
12. Chang, X. et al. Resting-state functional connectivity in medication-naïve schizophrenia patients with and without auditory verbal
hallucinations: A preliminary report. Schizophr. Res. 188, 75–81 (2017).
13. Stephan, K. E., Friston, K. J. & Frith, C. D. Dysconnection in schizophrenia: From abnormal synaptic plasticity to failures of self-
monitoring. Schizophr. Bull. 35, 509–527 (2009).
14. Schmidt, A. et al. Approaching a network connectivity-driven classification of the psychosis continuum: A selective review and
suggestions for future research. Front. Hum. Neurosci. 8, 1047 (2015).
15. Woodward, N. D. & Cascio, C. J. Resting-state functional connectivity in psychiatric disorders. JAMA Psychiatry. 72, 743–744
(2015).
16. Daalman, K. et al. Auditory verbal hallucinations and cognitive functioning in healthy individuals. Schizophr. Res. 132, 203–207
(2011).
17. Toh, W. L., Castle, D. J., Thomas, N., Badcock, J. C. & Rossell, S. L. Auditory verbal hallucinations (AVHs) and related psychotic
phenomena in mood disorders: analysis of the 2010 Survey of High Impact Psychosis (SHIP) data. Psychiatry Res. 243, 238–245
(2016).
18. Waters, F. & Fernyhough, C. Hallucinations: A systematic review of points of similarity and difference across diagnostic classes.
Schizophr. Bull. 43, 32–43 (2017).
19. Powers, A. R. 3rd., Kelley, M. S. & Corlett, P. R. Varieties of voice-hearing: Psychics and the psychosis continuum. Schizophr. Bull.
43, 84–98 (2017).
20. Ethridge, L. E. et al. Behavioral response inhibition in psychotic disorders: Diagnostic specificity, familiarity and relation to gen-
eralized cognitive deficit. Schizophr. Res. 159, 491–498 (2014).
21. Badcock, J. C., Mahfouda, S. & Maybery, M. T. Hallucinations and inhibitory functioning in healthy young adults with high and
low levels of hypomanic personality traits. Cogn. Neuropsychiatry. 20, 254–269 (2015).
22. Thakkar, K. N., Schall, J. D., Logan, G. D. & Park, S. Cognitive control of gaze in bipolar disorder and schizophrenia. Psychiatry
Res. 225, 254–262 (2015).
23. Andreasen, N. C., Flaum, M. & Arndt, S. The Comprehensive Assessment of Symptoms and History (CASH). An instrument for
assessing diagnosis and psychopathology. Arch. Gen. Psychiatry. 49, 615–623 (1992).
24. Kay, S. R., Fiszbein, A. & Opler, L. A. The positive and negative syndrome scale (PANSS) for schizophrenia. Schizophr. Bull. 13,
261–276 (1987).
25. Haddock, G., McCarron, J., Tarrier, N. & Faragher, E. B. Scales to measure dimensions of hallucinations and delusions: The psy-
chotic symptom rating scales (PSYRATS). Psychol. Med. 29, 879–889 (1999).
26. Tzourio-Mazoyer, B. et al. Automated anatomical labeling of activations in SPM using a macroscopic anatomical parcellation of
the MNI MRI single-subject brain. Neuroimage. 15, 273–289 (2002).
27. Power, J. D. et al. Functional network organization of the human brain. Neuron 72, 665–678 (2011).
28. Percival, D. B. & Walden, A. T. Wavelet Methods for Time Series Analysis (Cambridge University Press, Cambridge, 2000).
Scientific Reports | (2021) 11:1108 | https://doi.org/10.1038/s41598-020-80657-8 11
Vol.:(0123456789)www.nature.com/scientificreports/
29. Grinsted, A., Moore, J. C. & Jevrejeva, S. Application of the cross wavelet transform and wavelet coherence to geophysical time
series. Nonlinear Process. Geophys. 11, 561–566 (2004).
30. Zalesky, A., Fornito, A. & Bullmore, E. T. Network-based statistic: Identifying differences in brain networks. Neuroimage. 53,
1197–1207 (2010).
31. Zalesky, A., Cocchi, L., Fornito, A., Murray, M. M. & Bullmore, E. Connectivity differences in brain networks. Neuroimage. 60,
1055–1062 (2012).
32. Fornito, A., Yoon, J., Zalesky, A., Bullmore, E. T. & Carter, C. S. General and specific functional connectivity disturbances in first-
episode schizophrenia during cognitive control performance. Biol. Psychiatry. 70, 64–72 (2011).
33. Chyzhyk, D. & Graña, M. Findings in resting-state fMRI by differences from K-means clustering. Stud. Health Technol. Inform.
207, 300–310 (2014).
34. Breiman, L. University of California Random forest. Mach. Learn. 45, 1–35 (1999).
35. Chen, C., Liaw, A., Breiman, L. Using random forest to learn imbalanced data. Tech. Rep. 666, Dept. Statistics, Univ. California,
Berkeley, CA, (2004).
36. Hoffman, R. E., Fernandez, T., Pittman, B. & Hampson, M. Elevated functional connectivity along a cortocostriatal loop and the
mechanism of auditory/verbal hallucinations in patients with schizophrenia. Biol. Psychiatry. 69, 407–414 (2011).
37. Wolf, N. D. et al. Dysconnectivity of multiple resting-state networks in patients with schizophrenia who have persistent auditory
verbal hallucinations. J. Psychiatry Neurosci. 36, 366–374 (2011).
38. van Lutterveld, R., Diederen, K. M., Otte, W. M. & Sommer, I. E. Network analysis of auditory hallucinations in nonpsychotic
individuals. Hum. Brain Mapp. 35, 1436–1445 (2014).
39. Diederen, K. M. et al. Aberrant resting-state connectivity in non-psychotic individuals with auditory hallucinations. Psychol. Med.
43, 1685–1696 (2013).
40. Sheffield, J. M., Kandala, S., Burgess, G. C., Harms, M. P. & Barch, D. M. Cingulo-opercular network efficiency mediates the
association between psychotic-like experiences and cognitive ability in the general population. Biol. Psychiatry Cogn. Neurosci.
Neuroimaging. 1, 498–506 (2016).
41. Drakesmith, M. et al. Schizophrenia-like topological changes in the structural connectome of individuals with subclinical psychotic
experiences. Hum. Brain Mapp. 36, 2629–2643 (2015).
42. van Dellen, E. et al. Structural brain network disturbances in the psychosis spectrum. Schizophr. Bull. 42, 782–789 (2016).
43. Meda, S. A. et al. Differences in resting-state functional magnetic resonance imaging functional network connectivity between
schizophrenia and psychotic bipolar probands and their unaffected first-degree relatives. Biol. Psychiatry. 71, 881–889 (2012).
44. Collin, G. et al. Brain network analysis reveals affected connectome structure in bipolar I disorder. Hum. Brain Mapp. 37, 122–134
(2016).
45. Dickstein, D. P. et al. Fronto-temporal spontaneous resting state functional connectivity in pediatric bipolar disorder. Biol. Psy-
chiatry. 68, 839–846 (2010).
46. Strakowski, S. M. et al. Abnormal fMRI brain activation in euthymic bipolar disorder patients during a counting Stroop interfer-
ence task. Am. J. Psychiatry. 162, 1697–1705 (2005).
47. Chen, C. H., Suckling, J., Lennox, B. R., Ooi, C. & Bullmore, E. T. A quantitative meta-analysis of fMRI studies in bipolar disorder.
Bipolar Disord. 13, 1–15 (2011).
48. Jardri, R., Thomas, P., Delmaire, C., Delion, P. & Pins, D. The neurodynamic organization of modality-dependent hallucinations.
Cereb. Cortex. 23, 1108–1117 (2013).
49. Ford, J. M. et al. Visual hallucinations are associated with hyperconnectivity between the amygdala and visual cortex in people
with a diagnosis of schizophrenia. Schizophr. Bull. 41, 223–232 (2015).
50. Bohlken, M. M., Hugdahl, K. & Sommer, I. E. Auditory verbal hallucinations: Neuroimaging and treatment. Psychol. Med. 47,
199–208 (2017).
51. Meyer-Lindenberg, A. Neural connectivity as an intermediate phenotype: Brain networks under genetic control. Hum. Brain Mapp.
30, 1938–1946 (2009).
52. Singh, M. K. & Chang, K. D. The neural effects of psychotropic medications in children and adolescents. Child Adolesc. Psychiatr.
Clin. N. Am. 21, 753–771 (2012).
53. Hafeman, D. M., Chang, K. D., Garrett, A. S., Sanders, E. M. & Phillips, M. L. Effects of medication on neuroimaging findings in
bipolar disorder: An updated review. Bipolar Disord. 14, 375–410 (2012).
54. Abramovic, L. et al. The association of antipsychotic medication and lithium with brain measures in patients with bipolar disorder.
Eur. Neuropsychopharmacol. 26, 1741–1751 (2016).
55. Sommer, I. E. et al. Healthy individuals with auditory verbal hallucinations; who are they? Psychiatric assessments of a selected
sample of 103 subjects. Schizophr. Bull. 36, 633–641 (2010).
Acknowledgements
We would like to thank Prof. Dr. R.S. Kahn and Prof. Dr. R.A. Ophoff for their substantial contributions in obtain-
ing funding and to the collection of the data. We would like to thank all participants for their participation, and
all researchers for their efforts in making the BiG, TOPFIT, Spectrum, Simvastatin, and UH studies possible.
Funding
This work was supported by several grants. The BiG study was supported by the National Institute of Men-
tal Health (R01 MH090553). The TOPFIT study was supported by the Dutch Diabetes Research Foundation
(2007.00.040), Lilly Pharmaceuticals (Ho01-TOPFIT), Janssen Pharmaceuticals, and the Dutch Psychomotor
Therapy Foundation. The Simvastatin study was supported by ZONMW TOP (40-00812-98-12154 and Stanley
Foundation (12T-008). The Understanding Hallucinations study was supported by ZONMW TOP (40-00812-
98-13009). The spectrum study was supported by NWO/ZonMW grant (Dutch Scientific Research Organiza-
tion) Clinical Fellowship (40-00703-97-270) and NWO/ZonMW Innovation Impulse (VIDI) (017.106.301).
The contribution of co-author KH was funded by an ERC Advanced Grant (693124) and a RCN grant (223273).
Competing interests
The authors declare no competing interests.
Additional information
Supplementary Information The online version contains supplementary material available at https://doi.org/
10.1038/s41598-020-80657-8.
Correspondence and requests for materials should be addressed to M.J.L.S.
Scientific Reports | (2021) 11:1108 | https://doi.org/10.1038/s41598-020-80657-8 12
Vol:.(1234567890)www.nature.com/scientificreports/
Reprints and permissions information is available at www.nature.com/reprints.
Publisher’s note Springer Nature remains neutral with regard to jurisdictional claims in published maps and
institutional affiliations.
Open Access This article is licensed under a Creative Commons Attribution 4.0 International
License, which permits use, sharing, adaptation, distribution and reproduction in any medium or
format, as long as you give appropriate credit to the original author(s) and the source, provide a link to the
Creative Commons licence, and indicate if changes were made. The images or other third party material in this
article are included in the article’s Creative Commons licence, unless indicated otherwise in a credit line to the
material. If material is not included in the article’s Creative Commons licence and your intended use is not
permitted by statutory regulation or exceeds the permitted use, you will need to obtain permission directly from
the copyright holder. To view a copy of this licence, visit http://creativecommons.org/licenses/by/4.0/.
© The Author(s) 2021, corrected publication 2021
Scientific Reports | (2021) 11:1108 | https://doi.org/10.1038/s41598-020-80657-8 13
Vol.:(0123456789)You can also read