Clofarabine increases the eradication of minimal residual disease of primary B-precursor acute lymphoblastic leukemia compared to high-dose ...
←
→
Page content transcription
If your browser does not render page correctly, please read the page content below
Clofarabine increases the eradication of minimal residual disease of
primary B-precursor acute lymphoblastic leukemia compared to
high-dose cytarabine without improvement of outcome Results from the
randomized clinical trial 08-09 of the Cooperative Acute Lymphoblastic
Leukemia Study Group

by Gabriele Escherich, Udo zur Stadt, Arndt Borkhardt, Dagmar Dilloo, Jörg Faber,
Tobias Feuchtinger, Thomas Imschweiler, Norbert Jorch, Arnulf Pekrun, Irene Schmid,
Franziska Schramm, Michale Spohn, Martin Zimmermann, and Martin A. Horstmann

Received: June 1, 2021.
Accepted: July 16, 2021.

Citation: Gabriele Escherich, Udo zur Stadt, Arndt Borkhardt, Dagmar Dilloo, Jörg Faber,Tobias Feuchtinger,
Thomas Imschweiler, Norbert Jorch, Arnulf Pekrun, Irene Schmid, Franziska Schramm, Michale Spohn,
Martin Zimmermann, and Martin A. Horstmann. Clofarabine increases the eradication of minimal residual
disease of primary B-precursor acute lymphoblastic leukemia compared to high-dose cytarabine without
improvement of outcome Results from the randomized clinical trial 08-09 of the Cooperative Acute
Lymphoblastic Leukemia Study Group. Haematologica. 2021 Aug 5. doi:10.3324/haematol.2021.279357.
[Epub ahead of print]

Publisher's Disclaimer.
E-publishing ahead of print is increasingly important for the rapid dissemination of science.
Haematologica is, therefore, E-publishing PDF files of an early version of manuscripts that have
completed a regular peer review and have been accepted for publication. E-publishing of this PDF
file has been approved by the authors. After having E-published Ahead of Print, manuscripts will
then undergo technical and English editing, typesetting, proof correction and be presented for the
authors final approval the final version of the manuscript will then appear in a regular issue of the
journal. All legal disclaimers that apply to the journal also pertain to this production process.
Clofarabine increases the eradication of minimal residual disease of primary B-
       precursor acute lymphoblastic leukemia compared to high-dose cytarabine
                            without improvement of outcome
         Results from the randomized clinical trial 08-09 of the Cooperative Acute Lymphoblastic
                                        Leukemia Study Group

Gabriele Escherich1, Udo zur Stadt1, Arndt Borkhardt2, Dagmar Dilloo3, Jörg Faber4,

Tobias Feuchtinger5, Thomas Imschweiler6, Norbert Jorch7, Arnulf Pekrun8, Irene

Schmid5, Franziska Schramm1, Michael Spohn 1,9,10, Martin Zimmermann11, Martin A

Horstmann1,9
1
    Clinic of Pediatric Hematology and Oncology, University Medical Center Hamburg-Eppendorf, Hamburg, Germany
2
    Department of Pediatric Oncology, Hematology and Clinical Immunology, Medical Faculty Duesseldorf, Duesseldorf, Germany;
3
    Department of Pediatric Hematology/Oncology, University Hospital Bonn, Bonn, Germany.
4
    Department of Pediatric Hematology/Oncology, University Hospital Mainz, Mainz, Germany.
5
    Dr. von Hauner Children's Hospital, Ludwig Maximilian University, Munich, Germany.
6
    Department of Pediatric Hematology and Oncology, Helios Hospital, Krefeld, Germany.
7
    Department of Pediatric Hematology and Oncology, Protestant Hospital of Bethel Foundation, Bielefeld, Germany.
8
    Department of Pediatric Hematology and Oncology, Hospital Bremen-Mitte, Germany.
9
    Research Institute Children’s Cancer Center Hamburg, Germany
10
     Bioinformatics Core Unit, University Medical Center Hamburg, Germany
11
     Department of Pediatric Hematology and Oncology, Medical School Hannover, Hannover, Germany

Abstract word count: 250 words

Manuscript word count: 2492 words

Figures: 4

Tables: 2

References: 24

Supplementary files: 1

                                                                  1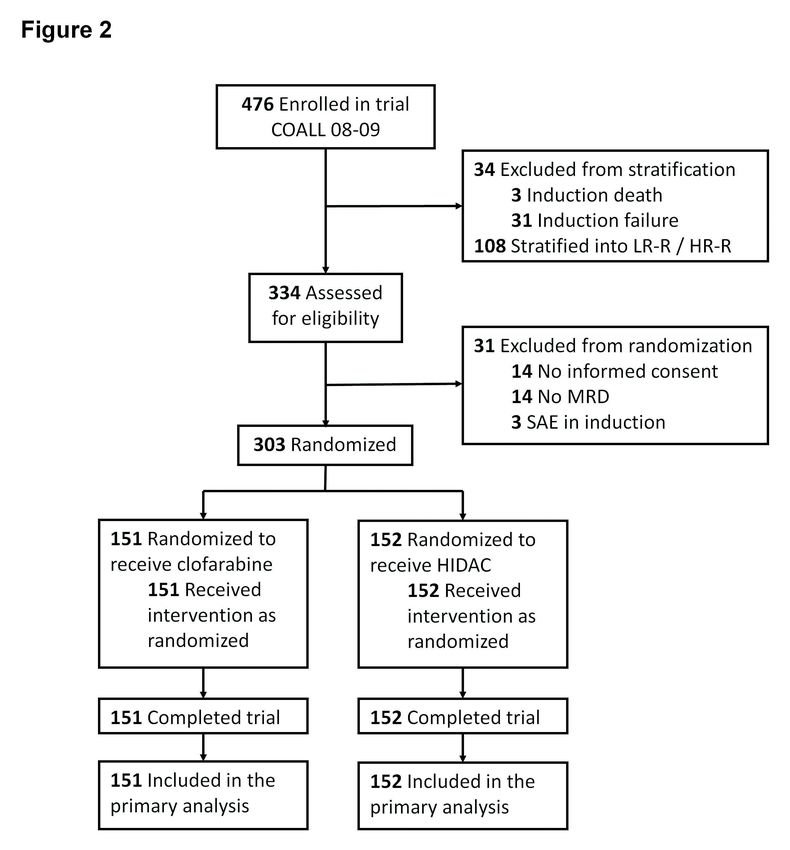
Corresponding authors: Gabriele Escherich or Martin A. Horstmann, University
Medical Center Eppendorf, Clinic of Pediatric Hematology and Oncology, Martinistrasse
52, 20246 Hamburg, Germany
Phone: +49 40 74105 2580
Fax: +49 40 74105 8101
Mail: escherich@uke.de or horstmann@uke.de

Running title: lymphoblastic leukaemia, paediatric, clofarabine

ClinicalTrials.gov identifier:: GPOH-CoALL 08-09 EU-21076 /NCT 0122 8331

https://clinicaltrials.gov/ct2/show/NCT01228331

Acknowledgements

Genzyme/Sanofi provided the investigational drug clofarabine. We thank Kseniya

Bakharevich for her assistance in collecting and interpreting the data. We gratefully

acknowledge all patients, their families and care providers who participated in this study.

Finally, we thank all the clinicians, as well as diagnostics and research personnel who

were actively involved in this clinical trial.

Disclosues

All authors declare no competing interests.

Contributions

MZ, MAH and GE designed the study with input from FS and UzS. DD, JF, TF, TI, NJ,

AP, IS and FS recruited patients. MAH, GE and FS collected, analysed, and interpreted

data.

                                                 2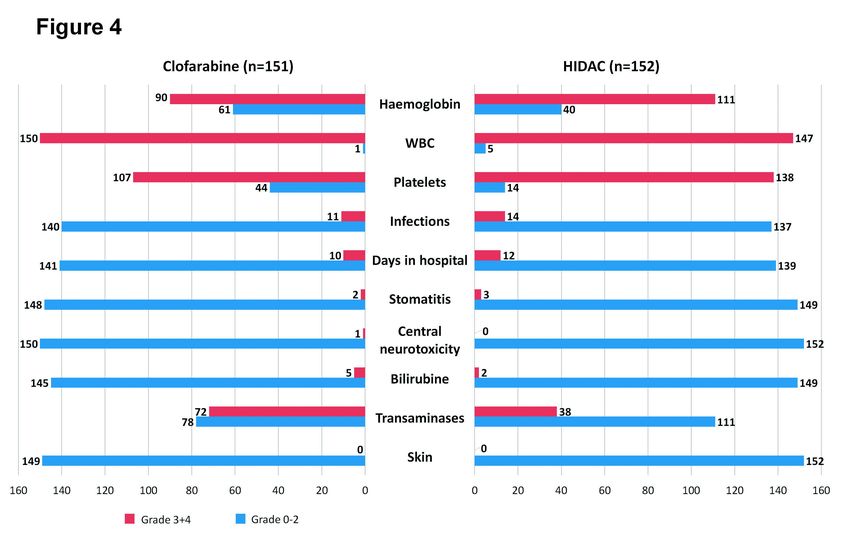
MZ did the statistical analysis. MS analysed data. All authors provided input for the data

interpretation, reviewed, and critically revised the content of the manuscript. All authors

approved the final version for submission.

                                             3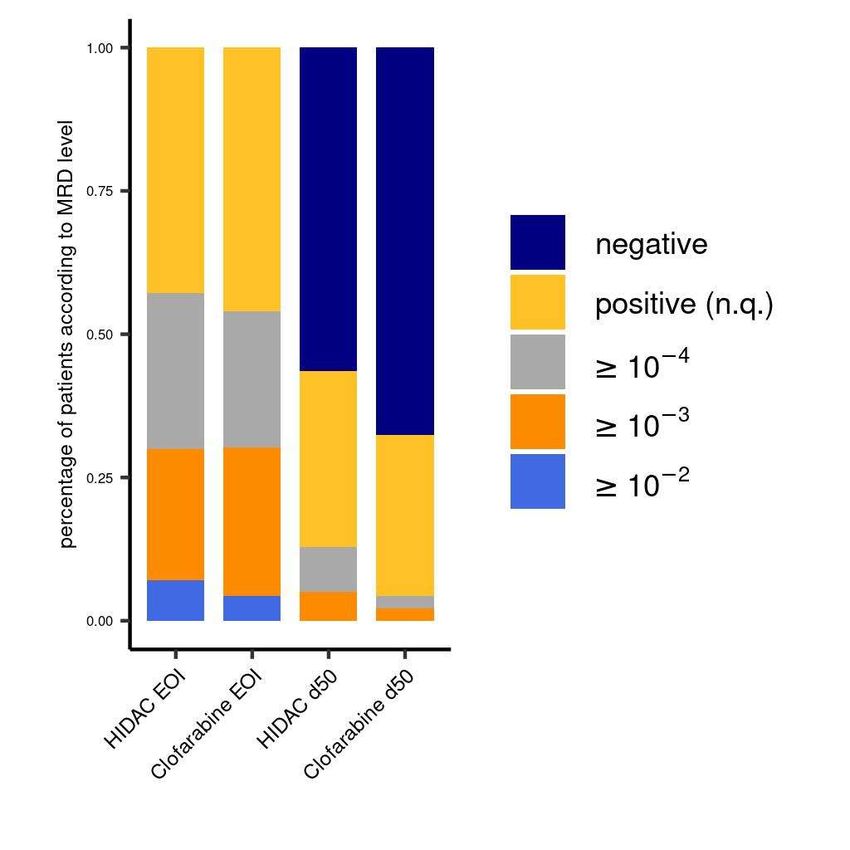
Abstract

Novel treatment strategies are needed to improve cure for all children with acute

lymphoblastic leukemia. To this end, we investigated the therapeutic potential of

clofarabine in primary acute lymphoblastic leukemia in trial CoALL 08-09. The primary

study objective was the minimal residual disease (MRD)-based comparative assessment

of cytotoxic efficacies of clofarabine 5x40 mg/m2 versus high-dose cytarabine (HIDAC)

4x3g/m2, both in combination with PEG-ASP 2500 IU/m2 as randomized intervention in

early consolidation. The secondary objective was an outcome analysis focused on

treatment-arm dependence and MRD after randomized intervention. In B-cell precursor

(BCP)-ALL, eradication of MRD was more profound after clofarabine compared to

cytarabine, with 93 vs 79 of 143 randomized patients per arm reaching MRD-negativity

(Chi-square test P=.03, left-sided P(Fisher’s exact test)=.04). MRD status of BCP-ALL

after randomized intervention maintained its prognostic relevance, with a significant

impact on event-free survival (EFS) and relapse rate. However, no difference in outcome

regarding EFS and overall survival (OS) between randomized courses was observed (5-

year EFS: clofarabine 85.7, SE=4.1 vs HIDAC 84.8, SE=4.7 (P=.96); OS: 95.7, SE=1.9

vs 92.2, SE=3.2 (P=.59)), independent of covariates or overall risk strata. Severe

toxicities between randomized and subsequent treatment elements were also without

significant difference.

In conclusion, clofarabine/PEG-ASP is effective and safe, but greater cytotoxic efficacy

of clofarabine compared to HIDAC did not translate into improved outcomes indicating a

lack of surrogacy of post-intervention MRD at the trial level as opposed to the patient

                                            4
level, which hampers a broader implementation of this regimen in the frontline treatment
of ALL.
Word count: 250
5Introduction
The prevention of relapse without increasing toxicity is a challenging goal of frontline
treatment in acute lymphoblastic leukemia (ALL), which is unlikely to be achieved by
recombination or intensification of established chemotherapeutic agents. Beside
immunotherapeutical approaches, novel compounds must be probed to prevent the
development of resistant clones or to efficiently overcome those that already exist.
To this end, we evaluated clofarabine as one of the latest chemotherapeutic drugs to
receive authoritative approval for the treatment of relapsed/refractory ALL in childhood.
Clofarabine is a second-generation purine nucleoside analogue that combines the
positive characteristics of first-generation purine nucleosides fludarabine and cladribine
by retaining 2-halogenated adenines, resulting in improved resistance against
deamination and phosphorolysis.1-3 Several studies have been launched which
scrutinized clofarabine in combination with other cytostatic drugs as second- or third-line
therapy, or as a bridging regimen to hematopoietic stem cell transplantation.4-6
In Children’s Oncology Group (COG) trial AALL1131, clofarabine was administered in
combination with etoposide and cyclophosphamide, which were associated with severe
infections and persistent myelotoxicity leading to premature closure of the experimental
clofarabine arm.7
To assess the value of the frontline usage of clofarabine, the cooperative acute
lymphoblastic leukemia study group (CoALL) conducted a sequential phase II/III trial
embedded into the CoALL 08-09 regimen for newly diagnosed ALL patients for whom
end-of-induction (EOI) MRD imposed a greater risk of relapse.
6During the non-randomized phase II, all eligible patients with quantifiable EOI MRD
received the combination of clofarabine 5 x 40 mg/m2 and pegylated asparaginase
(PEG-ASP) 2500 IU/m2 as early consolidation treatment. The results were compared to
a high-dose cytarabine (HIDAC)/PEG-ASP control group in predecessor trial CoALL 03-
07. Combined administration of clofarabine and PEG-ASP was feasible and exhibited
acceptable toxicities without unexpected severe side effects.8
Herein, we describe the results of the subsequent phase III trial within CoALL 08-09,
comparing the efficacy and tolerability of clofarabine/PEG-ASP versus HIDAC/PEG-ASP
at early consolidation in a randomized fashion.
Methods
Study design and patients
CoALL 08-09 was a multi-center, randomized trial for patients under the age of 18 years
with a confirmed diagnosis of acute B- or T-cell precursor leukemia. Accrual was open
from 1 October 2010 to 31 December 2019. The study was approved by competent
ethics boards (Table S1) and conducted in accordance with the Helsinki Declaration of
2008. The efficacy of clofarabine/PEG-ASP was compared with HIDAC/PEG-ASP in a
randomized fashion as a primary study objective. An additional randomization of
anthracyclines in delayed intensification was conducted from 2010 to 2016 with the
primary objective of comparing toxicities.9
7Stratification and treatment
All patients received the same three-drug induction with 4 weekly doses of daunorubicin
(36 mg/m2) and vincristine (1.5 mg/m2) along with oral methylprednisolone (60 mg/m2)
over 28 days and a single dose of age-adapted intrathecal methotrexate. BCP-ALL with
a discernible, but non-quantifiable, or quantifiable EOI MRD and T-ALL with ≥10-3 EOI
MRD were eligible for randomization, receiving either clofarabine 5 x 40 mg/m2 or
HIDAC 4 x 3 g/m2 in combination with PEG-ASP 2500 IU/m2 as the first or second
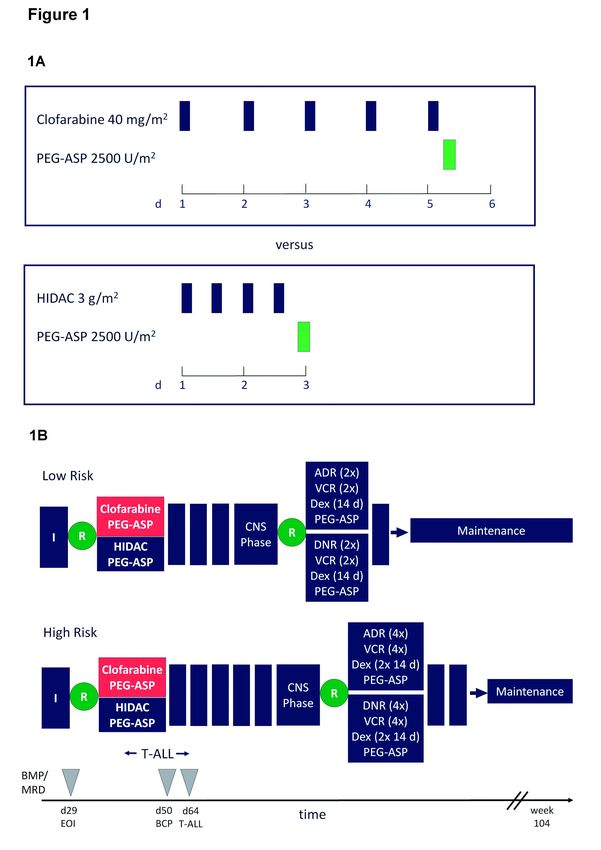
course of consolidation in the treatment of BCP-ALL or T-ALL, respectively (Figure 1A).
Further treatment was administered according to respective strata (Figure 1B). By
protocol, enrolled patients who achieved MRD-negativity at the end of induction or
inversely showed an induction failure were not eligible for randomization (supplemental
information).
Randomization
The randomization was performed by the coordinating trial center after stratification had
been finalized according to EOI MRD status. Each stratum (HR patients were sub-
divided according to immunophenotype) underwent independent randomization on the
basis of randomly permuted blocks to avoid imbalances within risk strata.
Analysis of minimal residual disease
Real-time quantitative PCR analyses were performed targeting immunoglobulin heavy
chain (IGH) and T-cell receptor (TCR) gene rearrangements to assess MRD. Data were
8interpreted according to the guidelines developed by the European Study Group for
MRD detection in ALL (EuroMRD ALL).10
Statistics
The probability of event-free (pEFS) and overall survival (pOS) was estimated using the
Kaplan-Meier method and compared between subgroups using the log-rank test.11
Cumulative incidence functions of isolated CNS or any (isolated and combined) CNS
relapse, as well as testicular relapse, treatment-related secondary malignancies and
toxicity-related death were calculated using the Kalbfleisch and Prentice method and
compared using Gray’s test.12 A Chi-square test, a Fisher’s exact test, and Spearman’s
rank correlation analyses were applied to compare the distribution of parameters
between subgroups and correlation between parameters.13 A Chi-square test was
applied to determine the difference in the rate of MRD-positive patients, as provided in
the study protocol. This was complemented by a one-sided Fisher’s exact test and a
Cochran-Armitage trend test, the latter of which compared the trend in MRD values
between randomized groups.14
The status of patients was monitored annually. The database was newly updated (1
December 2020) before being used for analysis. Analyses were carried out using SAS
version 9.4. Further details of statistical analyses are given as supplemental information.
9Results
Overall, 303 study patients were eligible and randomized, allocating 151 patients toward
clofarabine/PEG-ASP and 152 patients toward HIDAC/PEG-ASP (Figure 2, Table 1 and
supplemental information). Of those patients, the main endpoint (i.e. MRD after
randomized intervention) was reached by 296 patients, in close approximation to the
planned sample size (n=295) (Table 2). There were no differences in patient
characteristics regarding known risk factors other than a more frequent occurrence of
ETV6-RUNX1 in the clofarabine-treated cohort (Table 1). The incidence of
hematopoietic stem cell transplantation (HSCT) in first complete remission due to
persistent MRD was comparable between arms (n=11 vs n=12 HSCT in clofarabine and
HIDAC cohorts, respectively). T-ALL patients were similarly underrepresented in both
randomized arms compared to the whole study cohort (5.3% (n=8) in the clofarabine
and 5.9% (n=9) in the HIDAC cohort vs 14.2% (n=67) in the total cohort), mainly due to
a greater proportion of T-ALL in the induction failure cohort (n=24 out of 31 (77%)
patients) and in the HR-reduced cohort (15 out of 51 (29%) patients), both of which were
excluded from randomization according to the study protocol (Table 2 and supplemental
information).
MRD response
In the randomized treatment arms, we observed a rate of 44% MRD-positivity after high-
dose cytarabine vs 33% MRD-positivity after clofarabine in BCP-ALL (Pchi2=0.03; left-
sided Fisher test P=0.04). The overall reduction of MRD in BCP-ALL was significantly
10more profound after clofarabine compared to cytarabine, with 93 clofarabine-treated
patients vs 79 HIDAC-treated patients reaching MRD negativity, and a lower rate of
patients with quantifiable MRD levels (six patients after clofarabine vs 18 patients after
HIDAC) (Cochran-Armitage trend test P=0.01; Table 2, Figure S1). This observation
holds true in a sub-analysis of the patients with a higher burden of EOI MRD (≥10-3) who
were stratified to the LR- or HR-intensified arms. Among those 73 patients, 27 patients
were MRD-negative after clofarabine compared to 16 patients randomized to the HIDAC
arm (Cochran-Armitage trend test P=0.02). In ETV6-RUNX1-rearranged ALL, which
occurred more frequently in clofarabine-treated patients by chance, we observed an
equivalent efficacy of the randomized nucleosides, reflecting a generally high sensitivity
toward asparaginase in this prognostically favorable genetic subgroup of ALL (Table 1
and S3). To address a potential skewing effect of misbalanced ETV6-RUNX1 on the
MRD outcome of randomized groups, ETV6-RUNX1-negative ALL was analyzed
separately, which confirmed greater activity of clofarabine compared to HIDAC
(Pchi2=0.04210) (Table S3).
Importantly, after the randomized course in early consolidation (day 50 in BCP and day
64 in T-ALL patients), MRD maintained its prognostic relevance, with a significant impact
on EFS and relapse rate in comparison to day 29 EOI MRD (Figure 3A,B).15 T-ALL
patients of both randomized arms achieved comparable MRD reductions by day 64,
although the number of T-ALL patients was very small (Table 1 and 2). Nevertheless,
the test for trends in the overall cohort comprising both BCP- and T-ALL confirmed that
11clofarabine was significantly more effective in MRD reduction compared to HIDAC
(Cochran-Armitage trend test P=0.01) (Table 2).
Outcome of randomized groups
No significant differences in outcome regarding event-free and overall survival were
observed between the randomized arms (Figure 3C,D), with a median observation time
of 3.7 years. There were also no significant differences in Cox regression analyses
regarding the covariates gender, age (< vs ≥10 years), WBC (< vs ≥25/nl), ETV6-
RUNX1, and HSCT in first continuous remission as time-dependent variables. An
additional stratified analysis confirmed that there were no significant differences in EFS
or relapse rate between randomized courses according to the categories negative,
positive n.q., and quantifiable MRD on day 50. Besides events that were anticipated
upon quantifiable MRD after randomized intervention, several relapses occurred in
MRD-negative and -positive not-quantifiable patients in both randomized treatment
arms, accounting for the observed lack of surrogacy of MRD in the outcome analysis
(Table S4). There was no evidence of a mutual impact between the randomizations at
early consolidation and delayed intensification in this study, as shown by very similar
pEFS in the latter randomized arms (log-rank test P=0.88 for patients receiving
doxorubicin and log-rank test P=0.50 for patients receiving daunorubicin during delayed
intensification).
12Toxicity
No statistically significant differences in the incidence of severe or persistent toxicities
between randomized treatment elements or in the subsequent treatment realization
were documented (Figure 4, Table S2A,B). In particular, severe grade 3 or 4 skin
toxicities were not observed in either treatment arm, but clofarabine was more frequently
associated with grade 2 skin toxicities. With regard to hepatotoxicity, an elevation of
transaminases (aspartate and alanine transaminases (AST and ALT, respectively)) was
significantly more often reported after clofarabine than after HIDAC, and then
spontaneously resolved without exception after each randomized treatment element
before the start of subsequent chemotherapy. Accordingly, time intervals between the
randomized courses and the subsequent treatment elements were similar, with a
median of 22 days (range 20–38 days) after clofarabine/PEG-ASP and 19 days (range
18–38 days) after HIDAC/PEG-ASP. Incidence and degree of myelotoxicity differed
slightly between clofarabine and HIDAC (Figure 4, Table S2A,B). Remarkably, when
comparing CTC grades 0 to 2 against grades 3 and 4 for hemoglobin and platelets,
clofarabine was associated with significantly less severe toxicities (Table S2B).
Clofarabine caused a more frequent grade 4 depletion of white blood cells suggesting a
greater lymphotoxicity given that grade 4 reduction in neutrophil counts was comparable
between randomized arms (Figure 4, Table S2A). Notwithstanding, the incidence of
severe infections after randomized treatment was comparable (Figure 4, Table S2A,B).
Finally, the incidence of SAEs during the remaining treatment courses was very similar
(18 and 19 SAEs in the clofarabine vs HIDAC arm, respectively).
13Discussion
As demonstrated in trial CoALL 08-09, clofarabine combined with PEG-asparaginase is
effective in the eradication of minimal residual disease and well tolerated in the frontline
treatment of ALL. In comparison to high-dose cytarabine/PEG-ASP, clofarabine/PEG-
ASP was superior in the overall reduction of an MRD burden. The frequency of MRD-
positive BCP-ALL patients in the standard arm was lower than the predicted rate of 60%,
likely due to a smaller sample size and the different distribution of risk strata in the
preceding trial, CoALL 03-07.
Although the prognostic impact of MRD in BCP-ALL is still clearly discernible in early
consolidation after the randomized courses of clofarabine vs HIDAC, the greater
cytotoxic efficacy of clofarabine did not translate into an obvious improvement of
outcome at the trial level after a median follow-up period of 3.7 years. This lack of
surrogacy of MRD at early consolidation in a survival endpoint analysis could be
explained by a small effect size, taking into account that only a single course of
clofarabine was compared with high-dose cytarabine as a part of a complex multiagent
chemotherapy backbone, the entirety of which determines treatment efficacy. Our trial
design allowed for the detection of a ∼10% difference in outcome between randomized
treatment arms at a power of 80%. Hence, the small sample size has to be considered
with regard to the number of randomized patients required in order to perform a
meaningful comparative analysis of survival in CoALL 08-09, which was a priori defined
as a secondary objective in the study protocol.
14Overall, clofarabine increased the rate of MRD negativity by 25% compared to HIDAC,
which is an incremental improvement with borderline significance in contrast to a
statistically more robust overall reduction of MRD after clofarabine (Table 2; Figure S1).
The occurrence of relapsing disease in MRD-negative patients after clofarabine (and
HIDAC) observed in this trial points at MRD as a time-dependent variable. In this regard,
early achievement of MRD negativity at the end of induction is more predictive of
outcome than achievement of MRD negativity later in treatment, most likely due to the
emergence of resistant clones, i.e. MRD-negativity does not necessarily imply true
eradication of the disease, but simply reflects a decrease to a level below the detection
limit of the PCR-based MRD assay. Inversely, MRD positivity more reliably reflects
outcome when measured later in treatment.15,16
In addition, the rarity of events after treatment of ALL in childhood might generally
compromise surrogacy of MRD as a prognostic marker of outcome at the trial level. A
previous multi-trial approach including 4830 patients with ALL demonstrated that EOI
MRD failed as a surrogate for treatment effects on EFS at the trial level, when
dexamethasone and prednisone were compared in induction treatment of AIEOP-BFM
ALL and COG trials.17-19 This meta-analysis raised caution with regard to MRD as a
surrogate marker for treatment decisions in randomized trials. In contrast to these trials,
in which the stratifying decision was made after randomization, we can exclude that the
evaluation of MRD after randomized intervention impacted a decision on the subsequent
treatment in CoALL 08-09, since the ultimate stratification had been done before
randomization on d29 in BCP-ALL and on d43 in T-ALL.
15In this trial, we applied clofarabine at a dose of 40mg/m2 daily x 5 corresponding to the
previously established single agent maximum-tolerated dose (MTD) in adult acute
leukemia which is lower than the MTD of 52mg/m2 x 5 determined in pediatric patients
with acute leukemia.2,20 The administration of high-dose clofarabine in conjunction with
PEG-asparaginase in early consolidation of CoALL 08-09 was feasible largely due to
almost non-overlapping toxicities. By contrast, clofarabine given at a reduced dose level
of 30mg/m2 x 5 or 20mg/m2 x 5, respectively, was associated with unacceptably severe
infections and myelotoxicities in heavily pretreated pediatric patients with
relapsed/refractory leukemia when combined with cyclophosphamide, etoposide,
vincristine, and PEG-ASP in the COG trial AALL1131.7
Since MRD fell short as a surrogate marker in a true endpoint analysis of survival of
randomized patient cohorts in CoALL 08-09, standard cytarabine treatment has not been
replaced by clofarabine, despite its superior cytotoxic efficacy. Notwithstanding, given its
favorable risk/benefit ratio, a further evaluation of clofarabine in combination with PEG-
ASP might be warranted as a second-line replacement or add-on strategy in specific
patients, to reduce treatment-related morbidities or to augment the depth of molecular
remission after antibody-based immunotherapy. 21,22 In particular, clofarabine/PEG-ASP
could be tested in high-risk patients and compared with other established anti-leukemic
agents that are burdened with severe acute and long-term toxicities, such as
anthracyclines or the anti-metabolite methotrexate.23,24
Word count (main text): 2492
16Data sharing
Individual patient data from the trial will not be shared publicly, since a data-sharing plan
had not been included when ethical approval was requested. All original data can be
obtained by the corresponding authors, please contact Dr. Gabriele Escherich:
escherich@uke.de
17References
1 Xie KC, Plunkett W. Deoxynucleotide pool depletion and sustained inhibition of
ribo-nucleotide reductase and DNA synthesis after treatment of human lymphoblastoid
cells with 2-chloro-9-(2-deoxy-2-fluoro-beta-D-arabinofuranosyl) adenine. Cancer Res.
1996;56(13):3030-3037.
2 Jeha S, Gandhi V, Chan KW, et al. Clofarabine, a novel nucleoside analog, is
active in pediatric patients with advanced leukaemia. Blood. 2004;103(3):784-789.
3 Huang M, Inukai T, Miyake K, et al. Clofarabine exerts antileukemic activity
against cytarabine-resistant B-cell precursor acute lymphoblastic leukemia with low
deoxycytidine kinase expression. Cancer Med. 2018;7(4):1297-1316.
4 Huguet F, Leguay T, Raffoux E, et al. Clofarabine for the treatment of adult acute
lymphoid leukemia: the Group for Research on Adult Acute Lymphoblastic Leukemia
intergroup. Leuk Lymphoma. 2015;56(4):847-857.
5 Wang H, Jones AK, Dvorak CC, et al. Population Pharmacokinetics of
Clofarabine as Part of Pretransplantation Conditioning in Pediatric Subjects before
Hematopoietic Cell Transplantation. Biol Blood Marrow Transplant. 2019;25(8):1603-
1610.
6 Hochberg J, Zahler S, Geyer MB, et al. The safety and efficacy of clofarabine in
combination with high-dose cytarabine and total body irradiation myeloablative
conditioning and allogeneic stem cell transplantation in children, adolescents, and young
adults (CAYA) with poor-risk acute leukemia. Bone Marrow Transplant. 2019;54(2):226-
235.
187 Salzer WL, Burke MJ, Devidas M, et al. Toxicity associated with intensive
postinduction therapy incorporating clofarabine in the very high-risk stratum of patients
with newly diagnosed high-risk B-lymphoblastic leukemia: A report from the Children's
Oncology Group study AALL1131. Cancer. 2018;124(6):1150-1159.
8 Escherich G, zur Stadt U, Zimmermann M, Horstmann MA, CoALL study group.
Clofarabine in combination with pegylated asparaginase in the frontline treatment of
childhood acute lymphoblastic leukaemia: a feasibility report from the CoALL 08-09 trial.
Br J Haematol. 2013;163(2):240-247.
9 Schramm F, Zimmermann M, Jorch N, et al. Daunorubicin during delayed
intensification decreases the incidence of infectious complications - a randomized
comparison in trial CoALL 08-09. Leuk Lymphoma. 2019;60(1):60-68.
10 Van der Velden VHJ, Cazzaniga G, Schrauder A, et al; European Study Group on
MRD detection in ALL (ESG-MRD-ALL). Analysis of minimal residual disease by Ig/TCR
gene rearrangements: guidelines for interpretation of real-time quantitative PCR data.
Leukemia. 2007;21(4):604-611.
11 Kaplan EL, Meier P. Nonparametric Estimation from Incomplete Observations. J
Am Stat Assoc. 1958;53(282):457-481.
12 Aalen OO. 1. The statistical analysis of failure time data (2nd edn). Kalbfleisch
JD, Prentice LR, Wiley-Interscience, Hoboken, New Jersey, 2002. Statistics in Medicine.
2004;23(21):3397-3398.
13 Gray RJ. A Class of K-Sample Tests for Comparing the Cumulative Incidence of a
Competing Risk. The Annals of Statistics. 1988;16(3):1141-1154.
1914 Margolin BH. Test for Trend in Proportions. In: Kotz S, Johnson NL, Read CB,
eds. Encyclopedia of Statistical Sciences. New York: John Wiley & Sons. 1988;vol.
9:334-336.
15 Borowitz MJ, Devidas M, Hunger SP, et al. Clinical significance of minimal
residual disease in childhood acute lymphoblastic leukemia and its relationship to other
prognostic factors: a Children's Oncology Group study. Blood. 2008;111(12):5477-5485.
16 Brüggemann M, Kotrova M. Minimal residual disease in adult ALL: technical
aspects and implications for correct clinical interpretation. Blood Adv. 2017;1(25):2456-
2466.
17 Galimberti S, Devidas M, Lucenti A, et al. Validation of Minimal Residual Disease
as Surrogate Endpoint for Event-Free Survival in Childhood Acute Lymphoblastic
Leukemia. JNCI Cancer Spectr. 2018;2(4):pky069.
18 Möricke A, Zimmermann M, Valsecchi MG, et al. Dexamethasone vs prednisone
in induction treatment of pediatric ALL: results of the randomized trial AIEOP-BFM ALL
2000. Blood. 2016;127(17):2101-2112.
19 Borowitz MJ, Wood BL, Devidas M, et al. Prognostic significance of minimal
residual disease in high risk B-ALL: a report from Children's Oncology Group study
AALL0232. Blood. 2015;126(8):964-971.
20 Kantarjian HM , Gandhi V, Kozuch V, et al. Phase I clinical and pharmacology
study of clofarabine in patients with solid and hematologic cancers. J Clin Oncol.
2003;21(6):1167-1173.
2021 Locatelli F, Whitlock JA, Peters C, et al. Blinatumomab versus historical standard
therapy in pediatric patients with relapsed/refractory Ph-negative B-cell precursor acute
lymphoblastic leukemia. Leukemia. 2020;34(9):2473-2478.
22 Curren E, Stock W. Taking a “BiTE out of ALL”: blinatumomab approval for MRD-
positive ALL. Blood. 2019;133(16):1715-1719.
23 Armenian S, Bhatia S. Predicting and Preventing Anthracycline-Related
Cardiotoxicity. Am Soc Clin Oncol Educ Book. 2018;38:3-12.
24 Bhojwani D, Sabin ND, Pei D, et al. Methotrexate-induced neurotoxicity and
leukoencephalopathy in childhood acute lymphoblastic leukemia. J Clin Oncol.
2014;32(9):949-959.
21Tables
Table 1: Demographics and clinical characteristics of randomized patients
High-dose
Cytarabine Clofarabine
(n=152) (n=151)
No. (%) No. (%) P Value
Immunophenotype
B-precursor ALL 143 (94.1) 143 (94.7)
.82
T-ALL 9 (5.9) 8 (5.3)
Gender
male 79 (52) 85 (56.3)
.45
female 73 (48) 66 (43.7)
Age at diagnosis
< 10 years 123 (80.9) 119 (78.8)
.65
≥ 10 years 29 (19.1) 32 (21.2)
WBC
< 25/nl 101 (66.4) 110 (72.8)
.73
≥ 25/nl 51 (33.6) 41 (27.2)
ETV6-RUNX1 rearrangement
positive 30 (19.7) 47 (31.1)
negative 117 (77) 104 (68.9) .02
unknown 5 (3.3) 0 (0)
KMT2A rearrangement
positive 2 (1.3) 2 (1.3)
1.0
negative 150 (98.7) 149 (98.7)
Karyotype
< 44 chromosomes 2 (1.3) 2 (1.3)
44-50 chromosomes 90 (59.2) 106 (70.2)
.31
> 50 chromosomes 48 (31.6) 38 (25.2)
unknown 12 (7.9) 5 (3.3)
Treatment response BM day 15
M1 98 (64.5) 104 (68.9)
M2 28 (18.4) 23 (15.2)
.68
M3 4 (2.6) 5 (3.3)
not available 22 (14.5) 19 (12.6)
Risk Stratification
Low-risk standard 57 (37.5) 62 (41.1)
Low-risk intensified 20 (13.2) 19 (12.6)
High-risk standard 47 (30.9) 43 (28.5)
High-risk intensified 28 (18.4) 27 (17.9)
22Table 2 :
MRD response toward clofarabine/PEG-ASP vs high-dose cytarabine/PEG-ASP
high-dose
Clofarabine All
Cytarabine
No. (%) No. (%) P Value
.03
Chi-square
B-precursor ALL MRD d50 pos. 61 (44) 45 (33) 106
.04
Fisher
MRD d50 neg. 79 (56.4) 93 (67.4) 172 .01
Cochran-
B-precursor ALL MRD d50 pos. nq 43 (30.7) 39 (28.3) 82
Armitage
-4
MRD d50 ≥ 10 18 (12.9) 6 (4.3) 24 Trend Test
.02
B-precursor ALL Cochran-
MRD neg. 16 (21.9) 27 (37) 43
EOI MRD ≥10-3 Armitage
Trend Test
MRD d64 neg. 4 (44.4) 3 (37.5) 7 .94
Cochran-
T-ALL MRD d64 pos. nq 3 (33.3) 4 (50.0) 7
Armitage
-4
MRD d64 ≥ 10 2 (22.2) 1 (12.5) 3 Trend Test
23Figure legends:
Figure 1. Treatment overview.
A: Randomized treatment block clofarabine vs high-dose cytarabine, each combined
with PEG-ASP.
B: Schematic overview of CoALL 08-09 protocol.
ADR, doxorubicin; BCP, B-cell precursor; BMP, bone marrow puncture; CNS, central
nervous system; d, day; Dex, dexamethasone; DNR, daunorubicin ; EOI, end of
induction; HIDAC, high-dose cytarabine; I, Induction; MRD, minimal residual disease;
PEG-ASP, pegylated asparaginase; R, randomization; VCR, vincristine;
Figure 2. Trial profile. Flow diagram according to CONSORT guidelines.
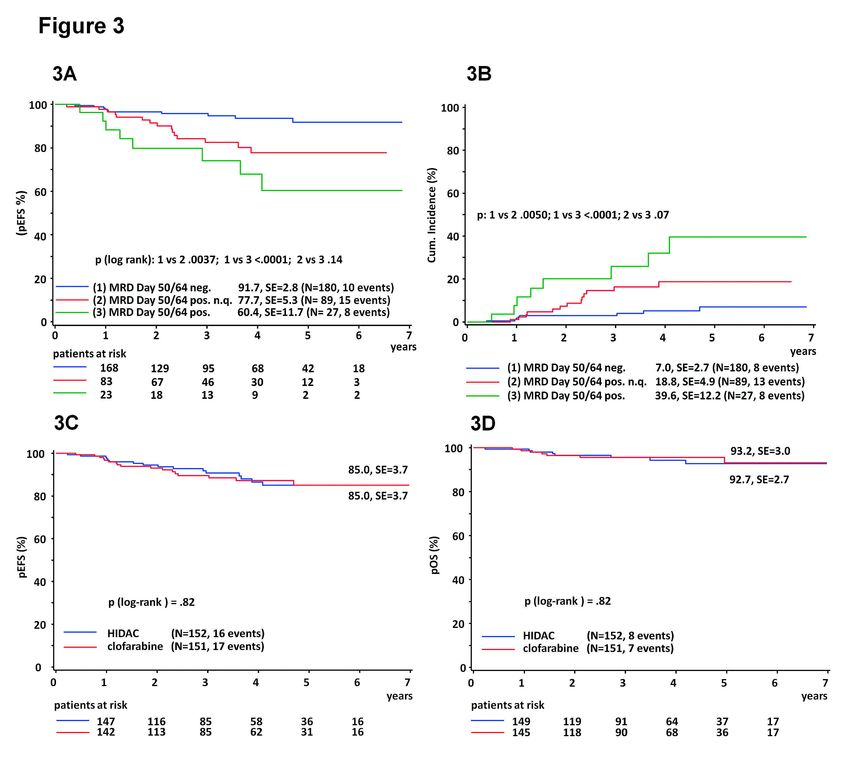
Figure 3. Outcome analyses in randomized patients.
A: Event-free survival (5 years of follow-up) in randomized patients according to MRD on
day 50/64 after completion of randomized treatment courses. For comparative outcome
probability analyses according to MRD levels, MRD negativity is denoted as 1, non-
quantifiable (n.q.) MRD positivity is denoted as 2, and MRD ≥ 1 x 10⁻⁴ is denoted as 3.
B: Cumulative relapse rate (5 years of follow-up) in randomized B-precursor and T-ALL
patients according to MRD on day 50/64.
C: Comparative analysis of overall survival (5 years of follow-up) in clofarabine/PEG-
ASP-treated vs HIDAC/PEG-ASP-treated ALL patients
24D: Comparative event-free survival (pEFS) (5 years of follow-up) analysis in
clofarabine/PEG-ASP-treated vs HIDAC/PEG-ASP-treated ALL patients
Figure 4:
Treatment-related toxicities in randomized patients according to treatment arm and CTC
criteria
25Supplementary Information:
Supplemental Table 1:
Participating trial sites
Supplemental Table 2:
Comparison of toxicities after clofarabine vs high-dose cytarabine (HIDAC) according to
CTC grades.
A: Comparison of all CTC grades
B: Comparison of CTC grades 0-2 vs 3 and 4.
Data are presented as No. (%).
Supplemental Table 3:
MRD response in BCP-ALL patients according to their ETV6-RUNX1 status.
Supplemental Table 4:
Distribution of relapses in the randomized arms according to the MRD level
Supplemental Figure 1:
Comparison of MRD response in BCP-ALL
CoALL 08-09 stratification algorithm
Definition of event-free and overall survival
Statistical analyses
Study recruitmentSupplemental Table 1: Participating trial sites Site City Country University Medical Center Ham- Hamburg Germany burg-Eppendorf, Clinic of Pediatric Hematology and Oncology Protestant Hospital of Bethel Bielefeld Germany Foundation, Department of Pediat- ric Hematology and Oncology University Hospital Bonn, Depart- Bonn Germany ment of Pediatric Hematology/On- cology Hospital Bremen-Mitte, Depart- Bremen Germany ment of Pediatric Hematology and Oncology Helios Hospital Krefeld, Depart- Krefeld Germany ment of Pediatric Hematology and Oncology University Medical Center of the Mainz Germany Johannes Gutenberg University Mainz, Department of Pediatric Hematology/Oncology University Hospital, Ludwig Maxi- Munich Germany milian Munich, Dr. von Hauner Children's Hospital Medical Faculty, Heinrich Heine Düssel- Germany University Düsseldorf, Pediatric dorf Oncology, Hematology and Clini- cal Immunology
Supplemental Table 2A,B : Comparison of toxicities

   Table 2A:

                               high-dose
                                             Clofarabine,    P Value
                               Cytarabine,
                                             No. (%)        (Fisher)
                               No. (%)
                     Grade 0   13 (8.7)      15 (10.0)
                     Grade 1   90 (60.0)     92 (61.3)
                     Grade 2   37 (24.7)     40 (26.7)
General condition                                           .38493
                     Grade 3   8 (5.3)       3 (2.0)
                     Grade 4   2 (1.3)       0
                     Total     150           150
                     Grade 0   1 (0.7)       1 (0.7)
                     Grade 1   6 (4.0)       4 (2.6)
                     Grade 2   33 (21.9)     56 (37.1)
Hemoglobin                                                  .03460
                     Grade 3   87 (57.6)     75 (49.7)
                     Grade 4   24 (15.9)     15 (9.9)
                     Total     151           151
                     Grade 0   0             0
                     Grade 1   0             0
                     Grade 2   5 (3.3)       1 (0.7)
WBC                                                         < .0001
                     Grade 3   60 (39.5)     8 (5.3)
                     Grade 4   87 (57.2)     142 (94.0)
                     Total     152           151
                     Grade 0   1 (0.8)       1 (0.8)
                     Grade 1   0             1 (0.8)
                     Grade 2   1 (0.8)       0
Neutrophils                                                 .37821
                     Grade 3   8 (6.1)       3 (2.3)
                     Grade 4   122 (92.4)    123 (96.1)
                     Total     132           128
                     Grade 0   1 (0.7)       15 (9.9)
                     Grade 1   4 (2.6)       12 (7.9)
                     Grade 2   9 (5.9)       17 (11.3)
Platelets                                                   < .0001
                     Grade 3   87 (57.2)     83 (55.0)
                     Grade 4   51 (33.6)     24 (15.9)
                     Total     152           151
                     Grade 0   46 (30.7)     106 (70.7)
                     Grade 1   84 (56.0)     34 (22.7)
Number of platelet   Grade 2   16 (10.7)     8 (5.3)
                                                            < .0001
transfusions         Grade 3   4 (2.7)       2 (1.3)
                     Grade 4   0             0
                     Total     150           150
                     Grade 0   44 (29.1)     65 (43.0)
                     Grade 1   11 (7.3)      12 (7.9)
                     Grade 2   82 (54.3)     63 (41.7)
Infections                                                  .07835
                     Grade 3   13 (8.6)      11 (7.3)
                     Grade 4   1 (0.7)       0
                     Total     151           151
                     Grade 0   41 (27.2)     67 (44.4)
                     Grade 1   65 (43.0)     55 (36.4)
Fever                                                       .01048
                     Grade 2   41 (27.2)     28 (18.5)
                     Grade 3   3 (2.0)       1 (0.7)
Grade 4 1 (0.7) 0
Total 151 151
Grade 0 44 (29.1) 70 (46.4)
Grade 1 34 (22.5) 23 (15.2)
Grade 2 61 (40.4) 48 (31.8)
Days in hospital .03230
Grade 3 8 (5.3) 8 (5.3)
Grade 4 4 (2.6) 2 (1.3)
Total 151 151
Grade 0 122 (80.3) 123 (88.7)
Grade 1 15 (9.9) 12 (8.0)
Grade 2 12 (7.9) 3 (2.0)
Stomatitis .09755
Grade 3 2 (1.3) 1 (0.7)
Grade 4 1 (0.7) 1 (0.7)
Total 152 150
Grade 0 132 (87.4) 125 (83.9)
Grade 1 15 (9.9) 16 (10.7)
Grade 2 4 (2.6) 6 (4.0)
Diarrhea .54837
Grade 3 0 2 (1.3)
Grade 4 0 0
Total 151 149
Grade 0 142 (93.4) 148 (98.0)
Grade 1 9 (5.9) 3 (2.0)
Grade 2 1 (0.7) 0
Creatinine .11123
Grade 3 0 0
Grade 4 0 0
Total 152 151
Grade 0 103 (68.2) 95 (63.3)
Grade 1 32 (21.2) 33 (22.0)
Grade 2 14 (9.3) 17 (11.3)
Bilirubine .72543
Grade 3 2 (1.3) 4 (2.7)
Grade 4 0 1 (0.7)
Total 151 150
Grade 0 18 (12.1) 10 (6.7)
Grade 1 50 (33.6) 41 (27.3)
Grade 2 43 (28.9) 27 (18.0)
Transaminases < .0001
Grade 3 36 (24.2) 52 (34.7)
Grade 4 2 (1.3) 20 (13.3)
Total 149 150
Grade 0 147 (96.7) 144 (96.6)
Grade 1 4 (2.6) 4 (2.7)
Peripheral neurotoxi- Grade 2 1 (0.7) 1 (0.7)
1.0000
city Grade 3 0 0
Grade 4 0 0
Total 152 149
Grade 0 149 (98.0) 150 (99.3)
Grade 1 3 (2.0) 0
Grade 2 0 0
Central neurotoxicity .24752
Grade 3 0 0
Grade 4 0 1 (0.7)
Total 152 151
Grade 0 135 (98.5) 133 (97.8)
Arrhythmia Grade 1 0 2 (1.5) .62177
Grade 2 1 (0.7) 1 (0.7)Grade 3 1 (0.7) 0
Grade 4 0 0
Total 137 136
Grade 0 85 (98.8) 76 (98.7)
Grade 1 0 0
Grade 2 0 1 (1.3)
Cardiac dysfunction .72317
Grade 3 1 (1.2) 0
Grade 4 0 0
Total 86 77
Grade 0 141 (92.8) 96 (64.4)
Grade 1 6 (3.9) 33 (22.1)
Grade 2 5 (3.3) 20 (13.4)
Skin condition < .0001
Grade 3 0 0
Grade 4 0 0
Total 152 149
Grade 0 .. ..
Grade 1 1 (100) ..
Veno-occlusive dise- Grade 2 .. ..
ase Grade 3 .. ..
Grade 4 .. ..
Total 1 0
Grade 0 151 (100) 149 (99.3)
Grade 1 0 1 (0.7)
Grade 2 0 0
Thrombosis .49834
Grade 3 0 0
Grade 4 0 0
Total 151 150Supplemental Table 2B:
High-dose Clofarabine,
P Value
Cytarabine, No. (%)
(Fisher)
No. (%)
Grade 0-2 140 (93.3) 147 (98.0)
General condi-
Grade 3/4 10 (6.7) 3 (2.0) .08529
tion
Total 150 150
Grade 0-2 40 (26.5) 61 (40.4)
Hemoglobin Grade 3/4 111 (73.5) 90 (59.6) .01451
Total 151 151
Grade 0-2 5 (3.3) 1 (0.7)
WBC Grade 3/4 147 (96.7) 150 (99.3) .21409
Total 152 151
Grade 0-2 2 (1.5) 2 (1.6)
Neutrophils Grade 3/4 130 (98.5) 126 (98.4) 1.0000
Total 132 128
Grade 0-2 14 (9.2) 44 (29.1)
Platelets Grade 3/4 138 (90.8) 107 (70.9) < .0001
Total 152 151
Grade 0-2 146 (97.3) 148 (98.7)
Number of plate-
Grade 3/4 4 (2.7) 2 (1.3) .68433
let transfusions
Total 150 150
Grade 0-2 137 (90.7) 140 (92.7)
Infections Grade 3/4 14 (9.3) 11 (7.3) .67696
Total 151 151
Grade 0-2 147 (97.4) 150 (99.3)
Fever Grade 3/4 4 (2.6) 1 (0.7) .37083
Total 151 151
Grade 0-2 139 (92.1) 141 (93.4)
Days in hospital Grade 3/4 12 (7.9) 10 (6.6) .82534
Total 151 151
Grade 0-2 149 (98.0) 148 (98.7)
Stomatitis Grade 3/4 3 (2.0) 2 (1.3) 1.0000
Total 152 150
Grade 0-2 151 (100) 147 (98.7)
Diarrhea Grade 3/4 0 2 (1.3) .24584
Total 151 149
Grade 0-2 149 (98.7) 145 (96.7)
Bilirubine Grade 3/4 2 (1.3) 5 (3.3) .28247
Total 151 150
Grade 0-2 111 (74.5) 78 (52.0)
Transaminases Grade 3/4 38 (25.5) 72 (48.0) < .0001
Total 149 150
Grade 0-2 152 (100) 150 (99.3)
Central neuroto-
Grade 3/4 0 1 (0.7) .49835
xicity
Total 152 151
Grade 0-2 136 (99.3) 136 (100)
Arrhythmia Grade 3/4 1 (0.7) 0 1.0000
Total 137 136
Grade 0-2 85 (98.8) 77 (100)
Cardiac dysfunc-
Grade 3/4 1 (1.2) 0 1.0000
tion
Total 86 77Supplemental Table 3: MRD response in BCP-ALL patients according to their ETV6-RUNX1
status.
Table 3A: MRD response to clofarabine vs high-dose cytarabine in ETV6/RUNX1-negative
BCP-ALL patients
high-dose
p(chi)=.04210 Cytarabine Clofarabine All
N % N % N
MRD Day 50
MRD Day 50 neg. 54 50.0 58 62.4 112
MRD Day 50 pos. nq 37 34.3 30 32.3 67
MRD Day 50 pos. 17 15.7 5 5.4 22
Table 3B: MRD response to clofarabine vs high-dose cytarabine in ETV6/RUNX1-positive
BCP-ALL patients
high-dose
p(chi)=.94619 Cytarabine Clofarabine All
N % N % N
MRD Day 50
MRD Day 50 neg. 22 75.9 35 77.8 57
MRD Day 50 pos. nq 6 20.7 9 20.0 15
MRD Day 50 pos. 1 3.4 1 2.2 2Supplemental Table 4: Distribution of relapses in absolute numbers in the randomized arms
according to MRD level
Clofarabine (n) high-dose
Cytarabine (n)
MRD negative after clofarabine/
high-dose cytarabine 5 3
BCP-ALL 4 2
T-ALL 1 1
MRD positive n.q. after clofarabine/
high-dose cytarabine 8 5
BCP-ALL 7 5
T-ALL 1 0
MRD ≥10-4 after clofarabine/
high-dose cytarabine 2 6
BCP-ALL 2 5
T-ALL 0 1
Total 15 14Supplemental Figure 1: Comparison of MRD response in BCP-ALL Comparison of MRD response after clofarabine vs high-dose cytarabine, each combined with PEG-ASP in BCP-ALL. MRD distribution at end of induction on day 29: clofarabine ≥ 1 x 10⁻² 4.6%, ≥ 1 x 10⁻³ 26.5%, ≥ 1 x 10⁻⁴ 24.5%; ≥ 1 x 10⁻⁶ 43.7%; HIDAC ≥ 1 x 10⁻² 7.2%, ≥ 1 x 10⁻³ 24.3%, ≥ 1 x 10⁻⁴ 27% ≥ 1 x 10⁻⁶ 41.4%; MRD distribution on day 50 after clofarabine: ≥ 1 x 10⁻² 0%, ≥ 1 x 10⁻³ 2%, ≥ 1 x 10⁻⁴ 2.6%, ≥ 1 x 10⁻⁶ 28.5%, negative 64%; after HIDAC: ≥ 1 x 10⁻² 0%, ≥ 1 x 10⁻³ 5.9% ≥ 1 x 10⁻⁴ 7.2%, ≥ 1 x 10⁻⁶ 30.3%, negative 54%.
CoALL 08-09 stratification algorithm

At diagnosis, patients were stratified according to conventional risk criteria, allocating patients

aged ≥10 years, with a T- or pro-B cell immunophenotype or with a white blood cell count

(WBC) ≥25/nl to the high-risk (HR) arm, and all others to the low-risk (LR) arm. A second,

more refined stratification was applied at EOI based on cytomorphological remission, molecu-

lar cytogenetics and in vivo MRD testing11. Patients not reaching remission at the end of in-

duction, carrying a KMT2A-rearrangement or exhibiting a hypodiploid karyotype were also al-

located to the HR arm. Ultimately, based on EOI MRD, three stratification arms were defined

per risk group. B-precursor (BCP)-ALL patients with a negative MRD result and T-ALL patients

with MRD EOI
from diagnosis to death by any cause or censoring at last follow-up. Cox regression was used

for multivariate analysis of the randomization groups taking into account known risk factors as

covariates.

Statistical analyses

Sample size for randomization was calculated according to estimations of the primary end-

point, i.e. MRD of BCP-ALL after the first course of consolidation, based on the preceding trial,

COALL 07-03. We estimated that 60% of patients in the control group who were MRD-positive

prior to intensification would exhibit a detectable MRD level after the administration of

HIDAC/PEG-ASP. We required 136 patients randomized to each group in order to demon-

strate a 25% reduction yielding 45% MRD-positive patients with alpha=5% (one-sided) and

beta=20%. Two interim analyses were planned in the study protocol, yielding a significance

level of 0.042 in the final analysis.

For the randomized treatment element, local trial centers documented toxicities using a spe-

cific toxicity form based on NCI Common Toxicity Criteria, version 2.0. An additional field was

implemented to capture the incidence and length of hospitalization. A lack of treatment-related

hospitalization was defined as grade 0, 15 days

of hospitalization corresponded to grade 4.

Study recruitment

From 1 November 2013 to 31 December 2019, 476 protocol patients were enrolled in phase III

of CoALL 08-09. Among those, 108 patients achieved EOI MRD-negativity (n=108), 31 pa-

tients underwent an induction failure, and three patients died during induction who were not

eligible for randomization. In addition, 31 patients could not be randomized because of paren-

tal or patients’ refusal (n=14), technical non-feasibility (n=14), or severe adverse events (SAE)

during induction (n=3).
You can also read