Growth of Sugar Maple (Acer saccharum Marsh.) after Ice Storm Damage and Forest Tent Caterpillar (Malacosoma disstria Hubner) Defoliation - MDPI
←
→
Page content transcription
If your browser does not render page correctly, please read the page content below
Article
Growth of Sugar Maple (Acer saccharum Marsh.) after Ice
Storm Damage and Forest Tent Caterpillar
(Malacosoma disstria Hubner) Defoliation
Eddie Bevilacqua               , Ralph D. Nyland *, Tori Smith Namestnik and Douglas C. Allen

                                          Department of Sustainable Resources Management, College of Environmental Science and Forestry,
                                          State University of New York, Syracuse, NY 13210, USA; ebevilacqua@esf.edu (E.B.);
                                          tori.namestnik@gmail.com (T.S.N.); dcallen@esf.edu (D.C.A.)
                                          * Correspondence: rnyland@syr.edu

                                          Abstract: The January 1998 ice storm broke off tree crowns across a wide geographic area in north-
                                          eastern North America, and forest tent caterpillar (Malacosoma disstria Hubner) defoliated some of
                                          the same stands in 2004–2007. We assessed the post-event growth responses of upper canopy sugar
                                          maples (Acer saccharum Marsh.) in previously thinned and recently rehabilitated even-aged northern
                                          hardwood stands in New York State, USA. Cores from ice-storm-damaged trees showed an initial
                                          radial growth reduction, a recovery after one year, and an increase to or above pre-storm levels after
                                          three years. A later forest tent caterpillar defoliation in the same stand caused a second reduction
                                          of growth, and another recovery after one year. We observed greater post-storm radial growth on
                                          trees released by a post-ice storm rehabilitation treatment than in the untreated control, with growth
                                exceeding pre-storm rates. Cores from another site thinned 38 years earlier and impacted only by

                                          the forest tent caterpillar showed a more moderate growth reduction, and a prompt but smaller
Citation: Bevilacqua, E.; Nyland,
                                          post-defoliation growth response than among trees affected by both the ice storm and defoliation.
R.D.; Namestnik, T.S.; Allen, D.C.
                                          Findings reflect the potential for growth of upper canopy sugar maple trees to recover after a single or
Growth of Sugar Maple (Acer
                                          two closely occurring crown disturbances, and provide guidance to managers who must decide about
saccharum Marsh.) after Ice Storm
Damage and Forest Tent Caterpillar
                                          removing or continuing to manage stands after similar kinds of ice storm damage or defoliation.
(Malacosoma disstria Hubner)
Defoliation. Forests 2021, 12, 620.       Keywords: ice storm damage; forest tent caterpillar defoliation; sugar maple growth response;
https://doi.org/10.3390/f12050620         tree ring analysis; northern hardwoods

Academic Editor: Brian Buma

Received: 16 April 2021                   1. Introduction
Accepted: 11 May 2021
                                                Ice storms have occurred intermittently across northeastern North America for decades
Published: 14 May 2021
                                          and will recur at unpredictable intervals in years ahead [1–4]. Each time, landowners must
                                          decide about continuing to manage a damaged stand, or remove it to recover the value in
Publisher’s Note: MDPI stays neutral
                                          standing and fallen trees. Much depends on the kinds and quality of trees affected by the ice
with regard to jurisdictional claims in
                                          loading, the extent of damage to them, and the prospects for crown and growth recovery.
published maps and institutional affil-
                                                This became a widespread concern after a large-scale ice storm in January 1998 dam-
iations.
                                          aged crowns of sugar maple (Acer saccharum Marsh.) and other northern hardwoods across
                                          northern New York, New England, and eastern Canada. The degree of damage depended
                                          on wind exposure, length of the storm, duration of ice loading, and tree and stand charac-
                                          teristics. Species composition, topography, slope, aspect, previous management history,
Copyright: © 2021 by the authors.
                                          overall tree health, tree age, growth form, size, diameter, and crown structure and position
Licensee MDPI, Basel, Switzerland.
                                          all influenced the level of damage [1,4–6].
This article is an open access article
                                                Many affected stands had a major component of sugar maple. The species has high
distributed under the terms and
                                          economic, ecologic, and intrinsic value. So, landowners worried about the impacts from
conditions of the Creative Commons
                                          crown breakage and other damages, and the potentials for recovery. Compared to American
Attribution (CC BY) license (https://
                                          beech (Fagus grandifolia Ehrh.) and yellow birch (Betula alleghaniensis. Brit.), sugar maples of
creativecommons.org/licenses/by/
4.0/).
                                          upper canopy positions have relatively high resistance to ice damage [7]. Crowns rebuild

Forests 2021, 12, 620. https://doi.org/10.3390/f12050620                                                   https://www.mdpi.com/journal/forests
Forests 2021, 12, 620                                                                                           2 of 14

                        due to epicormic branches forming from dormant buds along the bole within the former
                        crown area [2,4,8]. Even so, loss of half to three quarters of the crown will cause at least
                        short-term growth suppression [4]. While heavily damaged trees have a greater probability
                        of mortality than lightly or undamaged ones [8,9], dominant and codominant trees in
                        even-aged stands have a lower average rate of mortality than ones in intermediate and
                        overtopped crown positions [10].
                             Shortly after the storm, several agencies began assessing tree survival, immediate
                        post-storm growth, and other effects (See review by [4]). Among them, members of
                        SUNY College of Environmental Science and Forestry [8] established permanent plots in
                        three northern hardwood stands in northern New York, USA, to assess impacts of the ice
                        loading and test the potential for rehabilitation by releasing selected upper canopy trees to
                        reduce losses and promote crown rebuilding after icing events [4,11]. These stands had
                        moderate (40–60 mm of ice) to heavy (>60 mm of ice) damage from the 1998 storm [12].
                        A decade later, researchers [13] returned to the plots to examine the age of sugar maple
                        borer (Glycobius speciosus Say) scars and compare the incidence and timing of bole damage
                        during 10 years prior to and 10 years after the ice storm. They found no significant
                        difference in the incidence of borer injuries between the two time periods.
                             Early findings from the New York plots showed an initial decrease of radial incre-
                        ment among storm-damaged sugar maples [4]. Later assessments indicated extensive
                        crown rebuilding among upper canopy trees of that species, and growth recovery [8].
                        Other researchers [6] also observed post-storm growth responses among stands in Quebec.
                        Yet, when exactly the growth recovery started and whether radial increment returned to
                        pre-storm levels remained unclear.
                             Five years after the 1998 ice storm, forest tent caterpillar (Malacosoma disstria Hubner)
                        defoliated portions of the ice-damaged area. Outbreaks of this early season defoliator have
                        occurred every 6 and 16 years, and may recur for as many as five consecutive years in the
                        northeastern United States [14,15]. However, moderate (>50%) to heavy (≥75%) defoliation
                        in New York State and eastern Canada usually lasts for only two or three years before
                        populations collapse [16,17]. Such defoliation will result in growth reduction, and may lead
                        to extensive tree dieback and mortality [15,18]. Repeated defoliation over consecutive years
                        may deplete nutrient reserves and trigger a decline in sensitive or weakened trees [19–21],
                        especially if occurring in conjunction with other stresses such as drought or defoliation by
                        a leaf disease or insect defoliators [22].
                             Potentially, pest outbreaks, as well as damage from ice loading, have at least short-
                        term effects on growth of surviving trees. However, the timing and pattern of recovery has
                        remained unclear. We sought to evaluate patterns of periodic annual radial increment in
                        sugar maple trees damaged by the 1998 ice storm, and later defoliated by the forest tent
                        caterpillar. In addition, we wanted to compare those responses to growth in stands not
                        affected by the 1998 ice storm, but defoliated during the forest tent caterpillar outbreak.

                        2. Methods and Materials
                              The project elaborated on earlier findings [8] by exploring the duration of reduced
                        post-storm growth reported earlier [4,23], describing the temporal pattern of annual radial
                        increment recovery following both ice damage and defoliation, and assessing effects a
                        release treatment had on residual trees affected by the ice storm. Since sugar maple trees
                        of upper-canopy positions in even-aged stands have the highest vigor and best growth
                        potential after release by thinning (e.g., [24–27]), we focused the assessment on ones of
                        that stature. Our research hypotheses included: (1) radial growth would recover within
                        two years of the ice storm, and upper canopy trees released by a rehabilitation treatment
                        would have greater tree-ring widths than similar trees in a control area; (2) radial growth
                        would recover within the first year after the defoliation, and released upper canopy trees
                        would have greater tree-ring widths than similar ones in the control area; and (3) radial
                        growth responses will differ between upper canopy trees damaged by the ice storm and
                        later defoliated, compared to ones only affected by a defoliation. To test these hypotheses,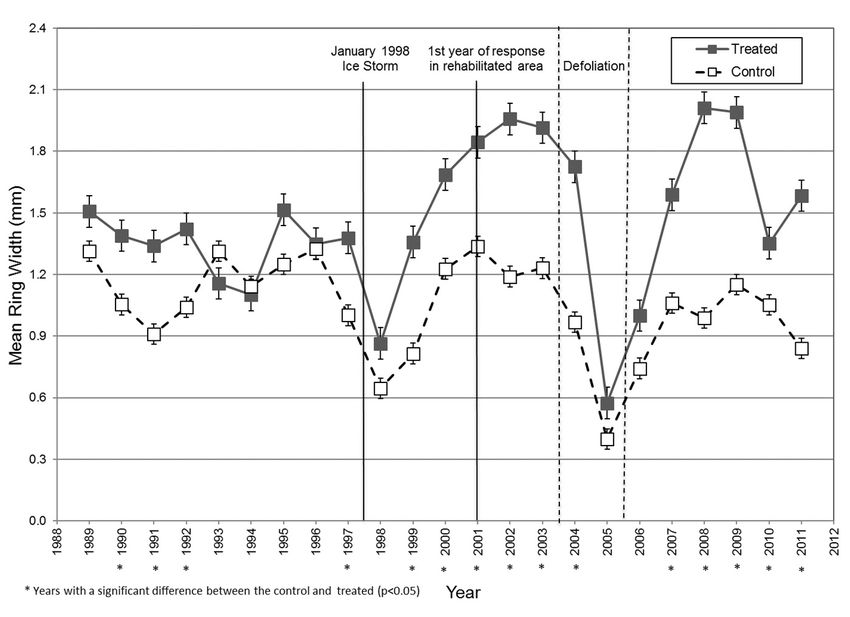
would recover within the first year after the defoliation, and released upper canopy trees
would have greater tree-ring widths than similar ones in the control area; and (3) radial
Forests 2021, 12, 620 3 of 14
growth responses will differ between upper canopy trees damaged by the ice storm and
later defoliated, compared to ones only affected by a defoliation. To test these hypotheses,
we sampled two previously thinned even-aged northern hardwood stands with no his-
tory
weofsampled
tappingtwo for maple sap production.
previously Past crown
thinned even-aged thinning
northern had favored
hardwood standsvigorous
with no trees
history
of of
upper canopy
tapping for positions,
maple sapleaving high-quality
production. Past crown stems as the residuals.
thinning had favoredWe vigorous
suspectedtrees
that of
theupper
1974 canopy
thinningpositions,
at one siteleaving
might high-quality
still influencestems as the residuals.
tree growth We suspected
through 2010, so we alsothat
the 1974 thinning
hypothesized at onegrowth
that current site might
ratesstill influence
differed treeplots
across growth through
thinned earlier2010, so we also
to different
hypothesized
levels of residualthat current growth rates differed across plots thinned earlier to different
density.
levels
For of
theresidual
currentdensity.
research, we revisited one of the stands used earlier [8] to assess im-
pacts ofForthethe1998current research,
ice storm. we revisited
The previously one of
thinned the even-aged
12-ha stands used earlier hardwood
northern [8] to assess
impacts
stand lies inof the
the Taylor
1998 iceCreek
storm. TheForest
State previously
near thinned 12-ha even-aged
West Pierrepont northern County,
in St. Lawrence hardwood
NY,stand
USAlies in the Taylor
(44.47132° Creek State
N, 75.03469° Forest
W, Figure 1).near West
It had Pierrepont
damage in St.
from the 1998 Lawrence County,
ice storm, and
NY, USA (44.47132 ◦ N, 75.03469◦ W, Figure 1). It had damage from the 1998 ice storm,
defoliation by forest tent caterpillar in 2004–2005. Following the ice storm, the stand had
andwith
trees defoliation by forest
tops broken tentthe
within caterpillar in 2004–2005.
crown (estimated Following
at about 70% oftheallicepresent)
storm, the stand
and/or
had trees with tops broken within the crown (estimated at about
broken branches, as well as some bent over and uprooted by the ice loading. Permanent70% of all present) and/or
broken
sample branches,
plots as wellinas1999
established somedocumented
bent over and theuprooted
species, by the ice loading.
diameter, Permanent
and condition of
sampletrees
standing plots[8].
established
We sampled in trees
1999 from
documented the species, diameter, and condition of
that inventory.
standing trees [8]. We sampled trees from that inventory.
Figure 1. Location of Taylor Creek (1) and Ranger School (2) stands used to assess growth responses
Figure 1. Location
following crownof Taylorby
damage Creek (1) and and
ice loading Ranger School (2)
defoliation standstent
by forest used to assess Adirondack
caterpillar, growth re- Region
sponses
of Newfollowing crown
York State, USA.damage by ice loading and defoliation by forest tent caterpillar, Adiron-
dack Region of New York State, USA.
In 2000, half the Taylor Creek area received a rehabilitation treatment that removed all
In 2000,
except half the
selected Taylor Creek
single-stem area received
upper-canopy treesaatrehabilitation treatment
7.6–10.7 m intervals, that removed
leaving a residual
allrelative
except selected
density single-stem upper-canopy
of 40–45% (after [28,29]). The treesreleased
at 7.6–10.7 m had
trees intervals, leavingwithin
tops broken a resid-the
ualcrown
relative density
and/or of 40–45%
broken (afterHowever,
branches. [28,29]). The released
all had some trees hadlive
residual topsbranches,
broken within
signs of
thecrown
crownrebuilding,
and/or broken branches.
no major However,
structural damage all had some
to the residual
bole, live branches,
no important signs
lean (>10%),
of no
crown rebuilding,
evidence no major
of cavities structural
or fungal damage
fruiting bodiesto the bole,bole,
on the no important
and bark lean (>10%),
characteristics
noand
evidence
other of cavitiesindicative
features or fungal fruiting
of high bodies on thetobole,
vigor prior and bark
the crown loss.characteristics
They representedand
the features
other best trees availableofwithin
indicative the treated
high vigor prior toareathe (Figure 2a). They
crown loss. The other half of the
represented the best
stand
remained
trees untreated
available within asthea treated
control. area
It had comparable
(Figure 2a). The kinds of damage
other half of theduestand
to theremained
ice loading,
but remained
untreated at a greater
as a control. density
It had of treeskinds
comparable having ofadamage
wider rangedue ofto heights and diameters.
the ice loading, but
Among them,
remained we randomly
at a greater densitysampled
of treestrees froma the
having samerange
wider rangeofofheights
diameters andas diameters.
the residuals
in the them,
Among rehabilitated area, assuming
we randomly sampledthat treesthey
from also
thecame
samefromrangetheofmain canopy
diameters asand
the had like
resid-
uals in the rehabilitated area, assuming that they also came from the main canopy andthe
kinds and degrees of damage (see [8] for details about the rehabilitation cutting and
condition of trees in the treated and control areas).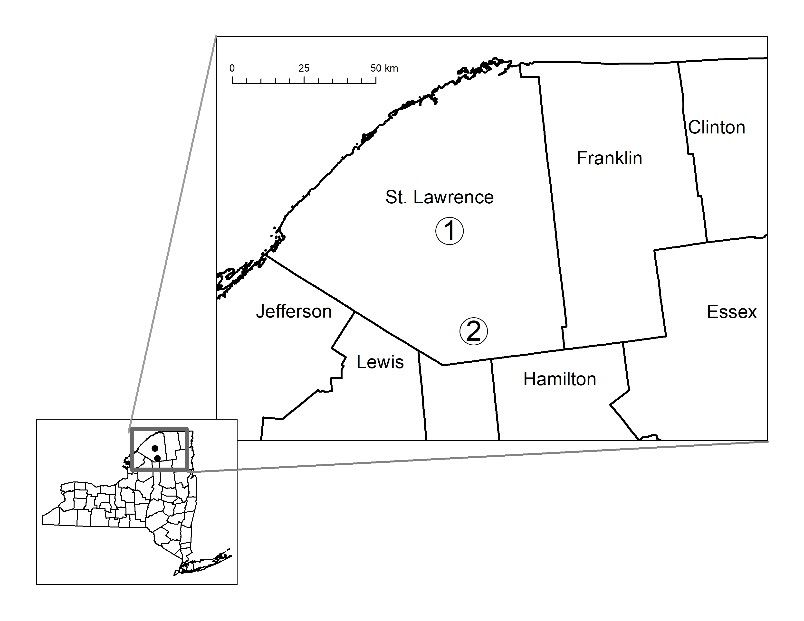
, 12, x FOR PEER REVIEW 4 of 14
Forests 2021, 12, 620 4 of 14
had like kinds and degrees of damage (see [8] for details about the rehabilitation cutting
and the condition of trees in the treated and control areas).
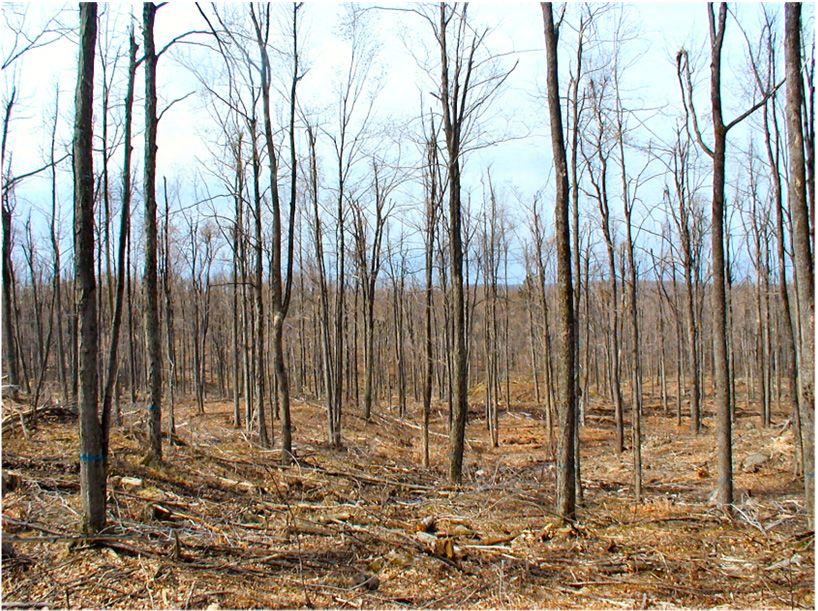
(a) (b)
Figure 2. Figure 2.stand
Residual Residual stand
at Taylor at Taylor
Creek Creek
(a) after (a) after cutting
rehabilitation rehabilitation cutting
that reduced that reduced
stocking stocking40–45%
to approximately to relative
density ofapproximately 40–45% relative
the best upper-canopy trees at density
7.6–10.7ofmthe best upper-canopy
spacing, trees at 7.6–10.7
and showing residual m spacing,
conditions and
at 33 years after crown
thinning showing residual
to 61% relative conditions
density at 33
at Ranger years(b).
School after crown thinning to 61% relative density at Ranger
School (b).
The second site lies 35.7 km to the south, on the SUNY College of Environmen-
The secondtal Science
site andkm
lies 35.7 Forestry
to theRanger
south, School
on theForest
SUNYnear Wanakena,
College NY, USA (44.15677◦ N,
of Environmental
◦
74.92923Ranger
W, Figure 1). ItForest
has northern hardwood plots
Science and Forestry School near Wanakena, NY,usedUSA for(44.15677°
a 1974 thinning
N, study that
74.92923° W, Figure 1). It has northern hardwood plots used for a 1974 thinning study that in winter
included an uncut control (96% relative density), plus 1.4-ha sub-plots thinned
included an uncut 1974 to 71%,
control 61%,relative
(96% or 42% residual
density),relative density
plus 1.4-ha [30]. Permanent
sub-plots thinned BAF-10
in winterpoint samples
1974 to 71%, 61%, or 42% residual relative density [30]. Permanent BAF-10 point samples with data
installed prior to and resampled periodically after thinning had numbered trees,
installed prior toabout species, diameter, and crown position. The 1974 treatments used crown thinning
and resampled periodically after thinning had numbered trees, with data
to release the best trees of upper-canopy positions, leaving residuals at uniform spacing
about species, diameter, and crown position. The 1974 treatments used crown thinning to
(Figure 2b). The plots had no additional management after the initial thinning. Within
release the best trees of upper-canopy positions, leaving residuals at uniform spacing (Fig-
each of the plots, we used inventory data gathered from the permanent points in 2010 to
ure 2b). The plots had no additional
randomly select treesmanagement
for sampling as after thebelow,
noted initial and
thinning.
removed Within
coreseach
fromofthem in 2012.
the plots, we used inventory
While the icedata
storm gathered
did notfrom
affectthe permanent
this stand, forestpoints
tentin 2010 to randomly
caterpillar defoliated the site in
select trees for sampling
2005–2007. as noted below, and removed cores from them in 2012. While the
ice storm did not affectOne this stand,
other forest
factor tenthave
might caterpillar
affecteddefoliated
diameter the
growthsite in
of 2005–2007.
sugar maple trees at both
One other factor might have data
sites. Precipitation affected
fromdiameter
2006 indicategrowth of sugar
that during Julymaple trees atonly
and August both50% and 30%,
sites. Precipitation data fromof2006
respectively, indicate
average that precipitation
monthly during July fell andatAugust
Canton,onlyNY 50% andnortheast of
(6.8 km
30%, respectively,theofTaylor Creek
average site), and
monthly no precipitation
precipitation fell atfell duringNY
Canton, July(6.8
andkm August at the Wanakena
northeast
Rangersite),
of the Taylor Creek Schoolandstation
no (2.45 km southeast
precipitation fell ofduring
the Ranger
July School plots). Levels
and August at thereached 128%
and 135%, respectively, during June 2006 for the two
Wanakena Ranger School station (2.45 km southeast of the Ranger School plots). Levels locations, and 115% and 130% for
reached 128% and September [31].
135%, respectively, during June 2006 for the two locations, and 115%
and 130% for September [31].
2.1. Data Collection
During 1999–2000, monitoring began at the Taylor Creek site (Table 1). It used a
2.1. Data Collection
systematic grid of permanent plots (809 m2 per plot) with numbered and tagged trees,
During 1999–2000, monitoring
and recorded speciesbegan at the Taylor
and diameter Creekheight
at breast site (Table
(DBH).1).After
It used a sys- period, re-
a 10-year
tematic grid of permanent plots (809 the
searchers remeasured m per
2
plotsplot)
[8] towith numbered
determine and tagged
if crowns trees, and
had recovered, how well the
recorded speciestrees
and had
diameter at breast height (DBH). After a 10-year period, researchers
grown after the storm damage, and the rates of mortality. The observations
remeasured the didplots
not[8]include
to determine
any dataif to
crowns had recovered,
characterize the annualhow well the
patterns trees
of pre- andhad
post-ice storm
grown after the storm
growth.damage, and the
We therefore rates oftomortality.
returned the stand inThe observations
2012 did not include
and took increment cores for a thorough
tree-ring the
any data to characterize analysis.
annualSince the Taylor
patterns of pre-Creek
andsite had a major
post-ice storm forest
growth.tentWecaterpillar
there- defoliation
fore returned to the stand in 2012 and took increment cores for a thorough tree-ring anal- response
in 2004–2005, we sought to use the tree-ring measurements there to compare
patterns
ysis. Since the Taylor Creek following
site hadboth the ice
a major storm
forest damage
tent and the
caterpillar defoliation.
defoliation in 2004–2005,
we sought to use the tree-ring measurements there to compare response patterns follow-
ing both the ice storm damage and the defoliation.
The Ranger School thinning plots had a systematic grid of permanent point samples
(BAF-10) with numbered and tagged trees. Periodic remeasurements through 36 yearsForests 2021, 12, 620 5 of 14
Table 1. Number and range of diameters for sampled trees.
Number Trees Mean Diameter
Diameter Ranges
Site and Plot Cored per Plot Sampled (cm)
Taylor Creek
Control 63 14.5–56.1 32.0
Rehabilitated 63 14.5–53.1 32.3
Ranger School
Unthinned (96% RD) 29 3.4–58.4 35.8
71% RD 29 23.4–66.5 37.3
61% RD 29 23.4–55.6 36.3
42% RD 29 23.6–59.7 37.6
The Ranger School thinning plots had a systematic grid of permanent point samples
(BAF-10) with numbered and tagged trees. Periodic remeasurements through 36 years after
thinning included species and DBH. To characterize the annual patterns of post-defoliation
growth, we returned in 2012 to take increment cores for a thorough tree-ring analysis.
2.2. Tree Core Collections
We cored a total of 242 trees: 126 trees at Taylor Creek, and 116 at Ranger School.
Within the rehabilitated area at Taylor Creek, sugar maple trees were selected based on a
stratified random sample, stratified across the full range of residual tree diameters (Table 1).
For the control area, we randomly drew trees within the same range of diameters, but did
not sort them for crown position or likely vigor. At the Ranger School, we collected
cores from 29 sugar maple trees within each sub-plot, randomly selecting ones from the
2010 list of trees >22.9 cm DBH (Table 1). We extracted a single 10.16 cm long core at a
height of 1.37 m from the east side of each sample tree, noting the site, plot, tree number,
and current DBH. We later dried and polished the cores using progressively finer grit
sandpaper, and scanned them into digital images (1200 dpi, equating to a precision of
0.02 mm). Then we measured annual tree-ring widths and crossdated the cores using Cybis
Elektronik’s CooRecorder and CDendro 7.6 programs [32].
2.3. Taylor Creek Data Analysis
All statistical analyses were carried out using SAS 9.3 statistical software [33]. Tree-
ring widths included 9 years before the ice storm and 14 years afterward. We compared
differences in tree-ring widths between the control and rehabilitated areas (α = 0.05) using
a linear mixed model in PROC MIXED with ring width as a function of the 1989 DBH,
treatment group, year, and year × treatment. This first order autoregressive model estimated
future tree-ring width based on a weighted sum of the preceding ring widths, assuming that
preceding values affected current ones. The Kenward-Rogers approach [34] removed small-
sample bias from the calculation of the F statistic for fixed effects. Least squares marginal
means were calculated for each treatment × year combination, and years with significant
differences (p-value < 0.05) between control and treated groups were identified. Next,
we calculated a standardized ring width index (RWI) for each year based on mean ring
width during the 9-year pre-ice storm growth period. This removed the excess variation in
growth and other changes that might result from aging or tree size. These unit-less RWI’s
represent a ratio of the observed to the expected values based on the null conditions of
annual ring growth (after [35]). Median inter-tree correlations in RWI were r = 0.197 and
r = 0.186 for control and rehabilitated trees, respectively.
We again compared differences in RWI between treatment groups using a linear mixed
model with a first order autoregressive covariance structure, and as a function of treatment
group, year, and year × treatment. Least squares means and percent change were used
to compare the relative magnitude of growth between the treatment and control groups
(Table 2). Time series plots displaying least squares means estimates and standard error of
ring width and RWI by year were obtained.Forests 2021, 12, 620 6 of 14
Table 2. ANOVA Table for Ring Width Data at Taylor Creek. Highlighted values represent p < 0.05
indicating that all parameters had a significant influence on the variation of mean tree-ring widths.
Source of Variation Numerator df Denominator df F-Statistic p-Value
DBH 1998 1 293 24.79Mean annual tree-ring widths ranged from 0.397 to 1.336 mm for the control area at
Taylor Creek, and 0.573 to 2.012 mm for the rehabilitated area, with a standard error value
of ±0.107 mm for both areas as shown at the different data points on Figure 3. All main
Forests 2021, 12, 620 effects and interactions in the linear mixed model had a significant influence on the7 var- of 14
iation of mean tree-ring widths, so we sliced the data by year for each year × treatment
interaction to test for differences in ring width due to treatment (Table 2). The Type III
test for fixed effects revealed a statistically significant difference (p < 0.0001) in the mean
to test for differences in ring width due to treatment (Table 2). The Type III test for fixed
tree-ring widths for the control trees over time compared with trees in the rehabilitated
effects revealed a statistically significant difference (p < 0.0001) in the mean tree-ring widths
area.
for the control trees over time compared with trees in the rehabilitated area.
Figure 3. Taylor Creek annual pattern of ring width growth (mm) for 9 years prior to and 13 years
Figure 3. Taylor Creek annual pattern of ring width growth (mm) for 9 years prior to and 13 years
after the
after the January
January 1998
1998 ice
icestorm
stormwith
withstandard error(±
standarderror 0.1068), and
(±0.1068), andthe
therecovery
recoverypattern
patternafter
aftera 2-year
a 2-
(2004–2005) defoliation by the forest tent caterpillar. Years with significant differences
year (2004–2005) defoliation by the forest tent caterpillar. Years with significant differences in theinmean
the
ring width
mean between
ring width treatment
between groupsgroups
treatment are designated by asterisk
are designated (p < 0.05).
by asterisk (p < 0.05).
Radial growth
Radial growth differed
differed significantly
significantly between
between trees
trees in
in the
the control
control and
and rehabilitated
rehabilitated
areas during five of the nine years prior to the January 1998 ice storm, but
areas during five of the nine years prior to the January 1998 ice storm, but followed
followed the
the
same general pattern and ultimately decreased in 1998 after the crown
same general pattern and ultimately decreased in 1998 after the crown damage. Meandamage. Mean tree-
tree-
ring widths
ring widths differed
differed significantly
significantly between
between thethe control
control and
and rehabilitated trees throughout
rehabilitated trees throughout
most of the post-storm period, except for 2005 and 2006. On average,
most of the post-storm period, except for 2005 and 2006. On average, within the within the range
range of
of
diameters that
diameters thatwe
wesampled,
sampled,larger treestrees
larger had wider post-storm
had wider tree-ring
post-storm widths widths
tree-ring than smaller
than
trees. The coefficient for the 1998 DBH variable was 0.021 ± 0.010
smaller trees. The coefficient for the 1998 DBH variable was 0.021± 0.010 mm mm per cm, indicating
per cm,
that ring width increased by a factor of ±0.010 mm for every added centimeter of diameter.
indicating that ring width increased by a factor of ±0.010 mm for every added centimeter
During the two years between the ice storm and rehabilitation treatment that removed
of diameter.
all except selected trees at a 7.6–10.7 m spacing, released trees had significantly larger
During the two years between the ice storm and rehabilitation treatment that re-
average tree-ring widths than the trees that had no post-storm release (Figure 3). Growth
moved all except selected trees at a 7.6–10.7 m spacing, released trees had significantly
increased for all trees by one year after the ice storm, and the control trees returned to
larger average tree-ring widths than the trees that had no post-storm release (Figure 3).
pre-storm growth rates by the third growing season. Trees in the rehabilitated area grew
Growth increased for all trees by one year after the ice storm, and the control trees re-
more rapidly than ones in the control area for all years following the storm (Figure 3),
turned to pre-storm growth rates by the third growing season. Trees in the rehabilitated
with mean tree-ring widths averaging 159% (range: 129–204%) of that for control trees.
area grew more rapidly than ones in the control area for all years following the storm
(Figure
3.1.2. RWI3), with mean tree-ring widths averaging 159% (range: 129–204%) of that for con-
Analysis
trol trees.
RWI values ranged from 0.396 to 1.270 for the control trees, and 0.517 to 1.826 for the
treated ones, with a standard error value of 0.103 (Figure 4). Similar to results with tree-ring
3.1.2. RWI Analysis
widths, all main effects and interactions had a significant influence on the variation of
mean RWI, so we sliced by year for each year × treatment interaction. The Type III test
for fixed parameters revealed a significant difference between the control and the treated
RWI over time (p < 0.0001). All pre-storm years showed no significant difference for
RWI between the control and treated trees. However, most years after the storm differed
significantly, with released trees having significantly greater RWI, except for 2005, 2006,
and 2010 (Figure 4). During the post-storm period, mean RWI for treated trees averaged
146% of that for control trees. For years with a significant difference, treated trees grew atof mean RWI, so we sliced by year for each year × treatment interaction. The Type III test
for fixed parameters revealed a significant difference between the control and the treated
RWI over time (p < 0.0001). All pre-storm years showed no significant difference for RWI
between the control and treated trees. However, most years after the storm differed sig-
Forests 2021, 12, 620 nificantly, with released trees having significantly greater RWI, except for 2005, 2006,8 and
of 14
2010 (Figure 4). During the post-storm period, mean RWI for treated trees averaged 146%
of that for control trees. For years with a significant difference, treated trees grew at faster
rates than expected if no ice-storm disturbance had occurred, with an annual percent
faster rates
change thanbetween
in RWI expectedthe
if no ice-storm
treated and disturbance hadranging
control groups occurred, with
from an annual
126% percent
to 189%.
change in RWI between the treated and control groups ranging from 126% to 189%.
Figure 4. Taylor Creek annual pattern of mean RWI for 9 years prior to and 13 years after the January
Figure 4. Taylor Creek annual pattern of mean RWI for 9 years prior to and 13 years after the Janu-
1998 ice storm
ary 1998 with
ice storm standard
with standarderror (±0.1030),
error and
(±0.1030), andthe
therecovery
recoverypattern
patternafter
afteraa2-year
2-year(2004–2005)
(2004–
2005) defoliation by the forest tent caterpillar. Years with significant differences inmean
defoliation by the forest tent caterpillar. Years with significant differences in the ring ring
the mean width
index between treatment groups are designated by an asterisk (p < 0.05).
width index between treatment groups are designated by an asterisk (p < 0.05).
Using 99 years
Using years prior
prior to
to the
the ice
ice storm
storm asas aa baseline
baseline resulted
resulted in
in similar RWI patterns
similar RWI patterns for
for
the two areas (Figure 4). For the first growing season immediately following
the two areas (Figure 4). For the first growing season immediately following the storm, the storm,
growth decreased
growth decreased significantly
significantlyamong
amongthe thecontrol trees,
control followed
trees, followedbyby
a small increase
a small in the
increase in
second
the growing
second season,
growing and and
season, a fulla return above
full return pre-storm
above RWI RWI
pre-storm values by the
values bythird year.
the third
RWI in the control trees remained relatively constant at about 20% above pre-ice storm
year. RWI in the control trees remained relatively constant at about 20% above pre-ice
levels until the defoliation in 2004. By contrast, released trees grew significantly better
storm levels until the defoliation in 2004. By contrast, released trees grew significantly
following the storm. They had RWIs almost 50% above pre-ice storm levels for the two
better following the storm. They had RWIs almost 50% above pre-ice storm levels for the
years between the ice storm and rehabilitation treatment, and almost 80% above pre-ice
two years between the ice storm and rehabilitation treatment, and almost 80% above pre-
storm levels after treatment (Figure 4).
ice storm levels after treatment (Figure 4).
3.2. Effects of Forest Tent Caterpillar Defoliation
3.2. Effects of Forest Tent Caterpillar Defoliation
Growth decreased during 2004 and 2005 within both the control and rehabilitated
plotsGrowth
at Taylordecreased
Creek dueduring 2004 and 2005
to the defoliation, withinbyboth
followed the control
a greater and rehabilitated
post-defoliation increase
plots at Taylor Creek due to the defoliation, followed by a greater post-defoliation
among treated as compared to control trees (Figure 3). Figure 5 shows the average annual in-
crease among treated as compared to control trees (Figure 3). Figure 5 shows the average
ring width prior to, during, and after the first year of defoliation for the treated and control
annual
trees at ring width
Taylor Creekprior
andto, during,
Ranger and after
School. the first
Tree-ring year
widths of defoliation
decreased for the
in all trees treated
during the
defoliation period, with a larger reduction at Taylor Creek. Afterwards, tree-ring widths
increased slightly at the Ranger School, but more so at Taylor Creek.
The linear mixed model of the three-way factorial with site (S), treatment (T), and pe-
riod (P) as main effects revealed that average ring width decreased for all trees at Taylor
Creek and Ranger School (p < 0.0001) during defoliation as compared to pre- and post-
defoliation periods (Figure 6). The significant site × period interaction (p = 0.0010) indicated
a greater reduction in ring width during the defoliation period at Taylor Creek than Ranger
School. The significant site × treatment interaction (p = 0.0192) reflects greater tree-ring
widths among treated trees compared to controls at Taylor Creek, but not between groups
of plots at Ranger School.and control trees at Taylor Creek and Ranger School. Tree-ring widths decreased in all
trees during the defoliation period, with a larger reduction at Taylor Creek. Afterwards,
Forests 2021, 12, 620 9 of 14
tree-ring widths increased slightly at the Ranger School, but more so at Taylor Creek.
Figure 5. Taylor Creek and Ranger School mean ring width (mm) with standard error bars in rela-
tion to the initial defoliation year (zero) by site and treatment group.
The linear mixed model of the three-way factorial with site (S), treatment (T), and
period (P) as main effects revealed that average ring width decreased for all trees at Taylor
Creek and Ranger School (p < 0.0001) during defoliation as compared to pre- and post-
defoliation periods (Figure 6). The significant site × period interaction (p = 0.0010) indi-
cated a greater reduction in ring width during the defoliation period at Taylor Creek than
Ranger School. The significant site × treatment interaction (p = 0.0192) reflects greater tree-
ring widths among
Taylor treated
Creekand treesSchool
andRanger
Ranger compared to controls
meanring
ring at Taylor
width(mm)
(mm) Creek,error
with standard
standard but not between
Figure
Figure 5. 5.
Taylor Creek School mean width with error bars
bars in
in relation
rela-
groups of plots at Ranger School.
to the initial defoliation year (zero) by site and treatment group.
tion to the initial defoliation year (zero) by site and treatment group.
The linear mixed model of the three-way factorial with site (S), treatment (T), and
period (P) as main effects revealed that average ring width decreased for all trees at Taylor
Creek and Ranger School (p < 0.0001) during defoliation as compared to pre- and post-
defoliation periods (Figure 6). The significant site × period interaction (p = 0.0010) indi-
cated a greater reduction in ring width during the defoliation period at Taylor Creek than
Ranger School. The significant site × treatment interaction (p = 0.0192) reflects greater tree-
ring widths among treated trees compared to controls at Taylor Creek, but not between
groups of plots at Ranger School.
Figure 6. Mean ring width (mm) by site and treatment for 4 years pre-defoliation, 2–3 years during
defoliation, and 4 years post-defoliation.
During the first year of the forest tent caterpillar defoliation at Taylor Creek, trees in the
control area had a significantly greater reduction in absolute growth (∆ = −0.40 mm, −33%)
and RWI (∆ = −0.34, −35%) compared to those in rehabilitated area (growth ∆ = −0.37 mm,
−22%; RWI ∆ = −0.17, −18%). Growth in the rehabilitated area decreased significantly
during the second year of defoliation, followed by a recovery in the third year. Significant
differences in RWI among defoliation periods (p < 0.0001) is evidenced by the decrease in
RWI during the defoliation, followed by a return to pre-defoliation levels for both groups
of plots at both sites (Figure 7). A significant site × period interaction (p < 0.0001) indicates
that trees previously injured by the ice-storm at Taylor Creek had significantly lower RWI
during the defoliation, and were more severely impacted by the defoliation compared
to ones at the Ranger School site that had not sustained any ice damage. We found no−33%) and RWI (Δ = −0.34, −35%) compared to those in rehabilitated area (growth Δ = −0.37
mm, −22%; RWI Δ = −0.17, −18%). Growth in the rehabilitated area decreased significantly
during the second year of defoliation, followed by a recovery in the third year. Significant
differences in RWI among defoliation periods (p < 0.0001) is evidenced by the decrease in
RWI during the defoliation, followed by a return to pre-defoliation levels for both groups
Forests 2021, 12, 620 10 of 14
of plots at both sites (Figure 7). A significant site × period interaction (p < 0.0001) indicates
that trees previously injured by the ice-storm at Taylor Creek had significantly lower RWI
during the defoliation, and were more severely impacted by the defoliation compared to
ones at the Ranger
significant School siteeffect
main treatment that had
(p =not sustained
0.1717) any×ice
or a site damage.interaction
treatment We found(p no=signif-
0.4184)
icant main treatment effect (p = 0.1717) or a site × treatment interaction (p = 0.4184) on RWI.
on RWI.
Figure 7. Mean ring width index by site and treatment for 4 years pre-defoliation, 2–3 years during
Figure 7. Mean ring width index by site and treatment for 4 years pre-defoliation, 2–3 years during
defoliation, and 4 years post-defoliation.
defoliation, and 4 years post-defoliation.
4. Discussion
4. Discussion
Our study assessed responses among sugar maple trees of upper-canopy positions
thatOur study assessed
managers would favorresponses among
as residuals sugar
when maple
doing trees thinning
a crown of upper-canopy positions
or post-disturbance
that managers would favor as residuals when doing a crown thinning or
rehabilitation in even-aged northern hardwood stands. Generally, these trees have large post-disturbance
rehabilitation
crowns, highinvigor,
even-aged northern
and better hardwood
diameter growthstands. Generally,
than ones of lesserthese
canopytrees have large
positions (27).
crowns, high vigor,
Past studies showed andthat
better diameter
growth rates growth
of such than
treesones of lesser
decreased canopy positions
appreciably (27).
after damage
Past
fromstudies showed
ice loading that growth
and/or ratesby
defoliation offorest
such trees decreased Then,
tent caterpillar. appreciably after damage
the crowns rebuilt or
from
refoliated, and growth rates eventually recovered [4,6,8,21,23]. Primarily, we wantedorto
ice loading and/or defoliation by forest tent caterpillar. Then, the crowns rebuilt
refoliated,
know howand growth
soon rates increased
the growth eventually recovered
after [4,6,8,21,23].
crown damage by ice Primarily,
loading and/orwe wanted to
defoliation
know howtent
by forest sooncaterpillar,
the growth increased
and how long after
thecrown damage by
rates remained ice loading
depressed and/or
before defolia-
reaching pre-
tion by forest
damage tentFurther,
levels. caterpillar,
sinceand
we how
used long
plotsthe
leftrates remained
at different depressed
levels before reaching
relative density following
pre-damage
past cuttinglevels. Further,we
treatments, since we also
could usedassess
plots left at different
whether trees levels
on plotsrelative density
of lower fol-
residual
lowing past
densities cutting treatments,
responded differently we
fromcould
othersalso assess
after whether
either or bothtrees
kindson of plots
crownofdisturbance.
lower re-
Findings
sidual from responded
densities the researchdifferently
address those
fromquestions.
others after either or both kinds of crown dis-
turbance. Findings from the research address those questions.
4.1. Taylor Creek after the Ice Storm
Mean tree-ring widths differed significantly between the control and treatment trees
during four of the nine years prior to the ice storm (Table 2, Figure 3). Yet, both groups
showed the same general growth pattern during that time (Figure 3). The significant
difference in pre-storm growth between control and treated trees at Taylor Creek might
result from sample tree selection. Residual trees left at 7.6–10.7 m spacing in the treated
area had been vigorous ones in upper canopy positions, while we randomly chose control
trees only for similar diameters. These likely included trees with similar crown damage,
but some of more average vigor and lesser growth potential. Even so, using RWI allowed
us to standardize the growth response and account for differences in pre-storm growth
rates between the treated and control trees (Figure 4).
As reported earlier [8], trees in the rehabilitation plots reduced to 40–45% relative
density increased more in diameter than ones in the control area during the years following
the ice-storm. This response was also observed among both measured tree-ring widthsForests 2021, 12, 620 11 of 14
and RWI’s for the years 1999 and 2000 (Figures 3 and 4). It likely reflects a higher vigor
and seemingly greater potential for recovery among trees released by the rehabilitation
treatment. Standardizing growth using RWI did not appear to dampen this selection bias.
For two growing seasons after the ice storm, control trees had lower than average
radial growth than during the two previous years (Figures 3 and 4). This supports earlier
findings [23,36] about effects of crown loss on growth. Radial growth of control trees
returned to pre-storm levels by the third year, and treated trees exceeded the pre-storm
rates. Similarly, growth of sugar maples in Quebec recovered to some degree within six
years after the 1998 ice storm [6]. With our data, trees in the Taylor Creek rehabilitated area
continued to increase in growth through the entire 10-year period, while that of control
trees returned to around pre-storm rates.
4.2. Response to Forest Tent Caterpillar Defoliation Event
Radial growth during the first full growing season after defoliation (i.e., 2006) did not
differ significantly between the control and released trees at Taylor Creek, suggesting that
carbohydrate reserves remained adequate for crown recovery and radial growth. By the
second year (i.e., 2007), control trees grew at pre-defoliation rates, while released trees grew
better than before defoliation (Figure 4). The second crown disturbance at Taylor Creek
had a greater impact than a defoliation alone at Ranger School (Figure 6), with overall
radial growth during the defoliation event showing a greater decline at Taylor Creek. Yet,
growth recovered at both sites during the four-year post-defoliation period, with treated
trees responding slightly better than control trees (Figure 6).
RWI revealed that growth of control (Group 2 at Ranger School) trees decreased
more due to defoliation as compared to treated (Group 1 at Ranger School) trees at both
sites (Figure 7). At Taylor Creek, ring width and RWI data both showed radial growth
in control trees was more severely impacted during defoliation as compared to released
trees. For the treated trees, mean RWI after defoliation was 12% higher (non-significant)
than pre-defoliation levels, suggesting a prompt recovery after a second crown disturbance,
as well as a lasting effect of the 2000 release treatment.
At Ranger School, the mean ring width for the plots initially thinned to 60% or
higher relative density (Group 2) decreased significantly during defoliation, with a modest
(non-significant) increase afterward. For the trees in plot initially thinned to 45% relative
density (Group 1), both the ring width and RWI analyses showed no significant difference
in mean growth rates during any of the time periods evaluated, although there was a
modest decrease during the defoliation years. This suggests that the forest tent caterpillar
defoliation did not significantly alter the average growth rate of trees in the 42% relative
density plot.
Due to the great variability in tree-ring widths between sample trees, the standard-
ized RWI may better represent overall trends, independent of site. Our data revealed
a significant difference in the average growth rates between the Group 1 and Group 2
trees at Ranger School only during the defoliation period, with Group 1 trees growing
faster during that time. Growth decreased significantly among both groups from the
pre- to the during-defoliation periods, and then increased significantly after defoliation.
Neither groups of trees had significantly different mean RWI values between pre- and
post-defoliation periods, indicating that sugar maple trees recovered within a relatively
short time, consistent with findings from an earlier forest tent caterpillar outbreak at Ranger
School [37].
Our analyses did not specifically test for possible effects from the shortfall in growing
season precipitation during 2006. Yet, neither the annual ring widths nor information from
the ring width index analysis reflects any depression of diameter growth during that year.
We did find a growth depression in the Taylor Creek control area during 2008, with growth
increasing again during 2009. We cannot explain it. Growing season precipitation during
2008 exceeded the monthly average. Perhaps the single-year reduction resulted from an
undetected error in field measurement or the ring width assessment.Forests 2021, 12, 620 12 of 14
Sugar maple borer also affected both stands, causing scars within 5 m of the ground on
19% of the sample trees in the rehabilitated plots, and 31% in the untreated area at Taylor
Creek. Within both sets of plots, the average 24-year total radial increment did not differ
significantly between trees with and lacking sugar maple borer scars. At Ranger School,
an average of 10 % of Group 1 sample trees and 12% of those in Group 2 had sugar maple
borer scars, but available data do not indicate what specific trees had scars. Therefore,
we could not test for possible effects on growth rates between trees having or lacking scars.
Yet, unlike a bark beetle infestation that destroys several sizeable areas or patches of the
cambium, the gallery of a sugar maple borer is usually nearly vertical [13]. Based on that
characteristic, and the lack of significant differences in growth between trees with and
lacking scars at Taylor Creek, it seems unlikely that a sugar maple borer injury would have
affected the radial increment at Ranger School in a demonstrable way.
Overall, findings indicate that the growth of sugar maple trees at Taylor Creek recov-
ered within one year after both damage by ice loading and the later defoliation by forest
tent caterpillar, reflecting the overall effects of refoliation reported earlier [8,21]. In addition,
trees in the lower-density rehabilitated plot grew more rapidly than ones in the untreated
control area. At Ranger School, growth also rebounded within one year after defoliation,
and trees in the plot thinned to 42% relative density 36 years earlier grew better than those
in plots left at higher densities. Altogether, findings show the flexibility managers have for
continuing the management of even-aged northern hardwood stands affected by similar
kinds of disturbance.
5. Conclusions
Sugar maple tree growth at Tayler Creek recovered quickly after both ice storm damage
and later defoliation by forest tent caterpillar, returning to or exceeding pre-disturbance
rates within about three years (Figures 3 and 4). The impact of a second disturbance on
radial growth appears cumulative (Figure 7), with a larger decrease in tree-ring widths
due to defoliation at Taylor Creek (second disturbance) compared to the Ranger School
(only disturbance). Cores from trees only defoliated by the forest tent caterpillar at the
Ranger School showed similar post-disturbance responses to those after ice damage at
Taylor Creek, with the more vigorously growing upper canopy trees responding sooner
and with higher growth rates. Overall, findings reflect the growth recovery potential of
upper-canopy sugar maple trees after a single or two of these closely occurring crown
disturbances. Results also suggest that landowners can feel confident that the growth of
upper canopy trees will recover promptly when deciding about removing or continuing to
manage stands after similar kinds of crown loss.
Author Contributions: Conceptualization, R.D.N., E.B., and D.C.A.; Methodology, R.D.N., E.B.,
and T.S.N.; Formal Analysis, T.S.N. and E.B.; Investigation, T.S.N.; Resources, D.C.A. and R.D.N.;
Data Curation, R.D.N.; Writing—Original Draft Preparation, R.D.N., T.S.N., E.B., and D.C.A.,
based on M.Sc. thesis by T.S.N.; Writing—Review and Editing, R.D.N., E.B., D.C.A., and T.S.N.;
Supervision, R.D.N. and E.B.; Project Administration, D.C.A. and R.D.N.; Funding Acquisition,
D.C.A. and R.D.N. All authors have read and agreed to the published version of the manuscript.
Funding: The U.S. Department of Agriculture, Forest Service, Northeastern Area State and Private
Forestry provided funding for this project.
Acknowledgments: New York State Department of Environmental Conservation, and SUNY College
of Environmental Science and Forestry offered additional logistical support and access to their forests
to assess the growth responses reported here. D. Keenshaw and M.F.J. Pisaric provided helpful
comments about earlier versions of this manuscript.
Conflicts of Interest: The authors declare no conflict of interest.Forests 2021, 12, 620 13 of 14
References
1. Miller-Weeks, M.; Eagar, C.; Petersen, C.M. The Northeastern Ice Storm 1998: A Forest Damage Assessment for New York, Vermont,
New Hampshire, and Maine; Miscellaneous Report; North East States Foresters Association: Concord, NH, USA, 1999.
2. Irland, L.C. Ice storm 1998 and the forests of the northeast. J. For. 1998, 96, 32–40.
3. Irland, L.C. Ice storms and forest impacts. Sci. Total Environ. 2000, 262, 231–242. [CrossRef]
4. Kraemer, M.J.; Nyland, R.D. Hardwood Crown Injuries and Rebuilding Following Ice Storms: A Literature Review; Gen. Tech. Rpt.;
GTR-NRS-60; U.S. Department of Agriculture, Forest Service, Northern Research Station: Newtown Square, PA, USA, 2010.
5. Hauer, R.J.; Dawson, J.O.; Werner, L.P. Trees and Ice Storms: The Development of Ice Storm-Resistant Urban Tree Populations, 2nd ed.;
College of Natural Resources, University of Wisconsin-Stevens Point: Stevens Point, WI, USA; Department of Natural Resources
and Environmental Sciences and Office of Continuing Education, University of Illinois: Urbana Champaign, IL, USA, 2006.
6. Pisaric, M.F.J.; King, D.J.; MacIntosh, A.J.M.; Bemrose, R. Impact of the 1998 ice storm on the health and growth of sugar maple
(Acer saccharum Marsh.) dominated forests in Gatineau park, Quebec. J. Torrey Bot. Soc. 2008, 135, 530–539. [CrossRef]
7. Rhoads, A.G.; Hamburg, S.P.; Fahey, T.J.; Siccama, T.G.; Hane, E.N.; Battles, J.; Cogbill, C.; Randall, J.; Wilson, G. Effects of an
intense ice storm on the structure of a northern hardwood forest. Can. J. For. Res. 2002, 32, 1763–1775. [CrossRef]
8. Nyland, R.D.; Dalton, J.L.; Allen, D.C.; Bevilacqua, E. Response of ice-damaged northern hardwood stands in northern New York.
For. Chron. 2016, 92, 77–89. [CrossRef]
9. Turcotte, R.M.; Elliott, T.R.; Fajvan, M.A.; Park, Y.; Snider, D.A.; Tobin, P.C. Effects of ice storm damage on hardwood survival and
growth in Ohio. North. J. Appl. For. 2012, 29, 53–59. [CrossRef]
10. Allen, D.C.; Molloy, A.W.; Cooke, R.R.; Pendrel, B.A. A ten-year regional assessment of sugar maple mortality. In Sugar Maple
Ecology and Health: Proceedings of an International Symposium, 2–4 June 1998; General Technical Report, NE-261; Warren, P.A.,
Horsley, S.B., Long, R.P., Eds.; U.S. Department of Agriculture, Forest Service: Newtown Square, PA, USA, 1999; pp. 27–45.
11. Downs, A.A. Glaze damage in the birch-beech-maple-hemlock type of Pennsylvania and New York. J. For. 1938, 36, 63–70.
12. Risk Management Solutions, Inc. The 1998 Ice Storm: 10-Year Retrospective. Risk Manage. Solutions Special Rep. 2008. Available
online: http://www.rms.com/publications/1998_ice_storm_retrospective (accessed on 31 July 2020).
13. Allen, D.C.; Dalton, J.; Nyland, R.D.; Bevilacqua, E. Response of the sugar maple borer to ice damaged in three northern hardwood
stands. For. Chron. 2016, 92, 183–188. [CrossRef]
14. Batzer, H.O.; Morris, R.C. Forest Tent Caterpillar; U.S. Department of Agriculture, Forest Service, Forest Insect & Disease Leaflet 9.
U.S. Government Printing Office: Washington, DC, USA, 1978; ISBN 1987-0-793-300.
15. Dukes, J.S.; Pontius, J.; Orwig, D.; Garnas, R.J.; Rodgers, V.L.; Brazee, N.; Cooke, B.; Theoharides, K.A.; Stange, E.E.; Harrington,
R.; et al. Responses of insect pests, pathogens, and invasive plant species to climate change in the forests of northeastern North
America: What can we predict? Can. J. For. Res. 2009, 39, 231–248. [CrossRef]
16. Sippell, L. Outbreaks of the forest tent caterpillar, Malacosoma disstria Hbn., a periodic defoliator of broad-leaved trees in Ontario.
Can. Entomol. 1962, 94, 408–416. [CrossRef]
17. Kraus, N. NYS DEC Forest Tent Caterpillar Defoliator Report. 2005; New York State, Department of Environmental Conservation:
Albany, NY, USA, 2006. Available online: https://www.dec.ny.gov/docs/lands_forests_pdf/defoliator2005.pdf (accessed on 21
August 2020).
18. Gross, H.L. Dieback and growth loss of sugar maple associated with defoliation by the forest tent caterpillar. For. Chron. 1991,
67, 33–42. [CrossRef]
19. Cook, E.R.; Peters, K.L. Calculating unbiased tree-ring indices for the study of climatic and environmental change. Holocene 1997,
7, 361–370. [CrossRef]
20. Hartmann, H.; Messier, C. The role of forest tent caterpillar defoliation and partial harvest in the decline and death of sugar
maple. Ann. Bot. 2008, 102, 377–387. [CrossRef] [PubMed]
21. Wink, R.A.; Allen, D.C. The combined effects of defoliation and modified timber stand improvement on hardwoods in the Tug
Hill region of New York. North. J. Appl. For. 2007, 24, 43–51. [CrossRef]
22. Hall, J.P.; Unger, J.D.; Bast, T.C.; Kauffman, N.C.; Regester, B.S. Factors associated with rapid mortality of sugar maple in
Pennsylvania. In An International Symp, June 2–4, 1998; General Technical Report; GTR-NE-261; U.S. Department of Agriculture,
Forest Service: Radnor, PA, USA, 1999; pp. 51–54.
23. Smith, K.T.; Shortle, W.C. Radial growth of hardwoods following the 1998 ice storm in New Hampshire and Maine. Can. J. For.
Res. 2003, 33, 325–329. [CrossRef]
24. Assmann, E. The Principles of Forest Yield Study: Studies in the Organic Production, Structure, Increment, and yielD of Forest Stands;
Elsevier: Amsterdam, The Netherlands, 1970.
25. Clatterbuck, W.K. Are overtopped white oak good candidate or management? In Seventh Biennial Southern Silviculture Research
Conference; General Technical Report, GTR-SO-93; Brissette, J., Ed.; U.S. Department of Agriculture, Forest Service, Southern
Forest Experiment Station: New Orleans, LA, USA, 1993; pp. 497–499.
26. Marquis, D.A. Independent effects and interactions of stand diameter, tree diameter, crown class, and age on tree growth in
mixed-species, even-aged hardwood stands. In Proceedings of the Eighth Central Hardwood Forest Conference, University Park,
PA, USA, 4–6 March 1991; General Technical Report, GTR-NE-148; McCormick, H., Gottshalk, K.W., Eds.; U.S. Department of
Agriculture, Forest Service, Northeastern Forest Experiment Station: Radnor, PA, USA, 1991; pp. 442–458.You can also read