Genotype Fingerprints Enable Fast and Private Comparison of Genetic Testing Results for Research and Direct-to-Consumer Applications - MDPI
←
→
Page content transcription
If your browser does not render page correctly, please read the page content below
G C A T
T A C G
G C A T
           genes
Article
Genotype Fingerprints Enable Fast and Private
Comparison of Genetic Testing Results for Research
and Direct-to-Consumer Applications
Max Robinson         and Gustavo Glusman *
 Institute for Systems Biology, 401 Terry Ave N, Seattle, WA 98109, USA; Max.Robinson@SystemsBiology.org
 * Correspondence: Gustavo@SystemsBiology.org; Tel.: +1-206-732-1273

 Received: 31 August 2018; Accepted: 2 October 2018; Published: 4 October 2018

 Abstract: Genetic testing has expanded out of the research laboratory into medical practice
 and the direct-to-consumer market. Rapid analysis of the resulting genotype data now has a significant
 impact. We present a method for summarizing personal genotypes as ‘genotype fingerprints’ that meets
 these needs. Genotype fingerprints can be derived from any single nucleotide polymorphism-based
 assay, and remain comparable as chip designs evolve to higher marker densities. We demonstrate
 that these fingerprints support distinguishing types of relationships among closely related individuals
 and closely related individuals from individuals from the same background population, as well as
 high-throughput identification of identical genotypes, individuals in known background populations,
 and de novo separation of subpopulations within a large cohort through extremely rapid comparisons.
 Although fingerprints do not preserve anonymity, they provide a useful degree of privacy by
 summarizing a genotype while preventing reconstruction of individual marker states. Genotype
 fingerprints are therefore well-suited as a format for public aggregation of genetic information to support
 ancestry and relatedness determination without revealing personal health risk status.

 Keywords: computational genomics; genome comparison; algorithms; genetic testing; privacy;
 direct-to-consumer; study design; population genetics

1. Introduction
     A large number of genotypes have been produced by DNA hybridization, employing a variety
of array designs [1]. The low cost of hybridization assays relative to sequencing, including
whole-genome sequencing (WGS), exome sequencing, and other forms of targeted sequencing,
has led to the commoditization of array-based genotyping and enabled commercial companies
(including 23andMe, AncestryDNA, Family Tree DNA, and others [2]) to offer this service directly to
consumers (DTC), which typically yield results with high concordance [3] and low no-call rates [4].
Genotyping the same individual using different array designs can yield slightly different results as
each technology has its own biases. Even when using the same technology, genotype reference version,
and variant encoding format, genotyping the same individual repeatedly can produce slightly different
results due to the stochastic nature of genome processing and analysis, batch effects, or differences
in the computational pipelines. Some companies regularly reanalyze the raw data for all customers,
refining the results over time. As a result, customers who download their genotype data repeatedly
over the years may have slightly differing results even from the same sample. In addition to
relatedness applications, array-based genotyping is used as a quality control step prior to WGS
when comprehensive variant information is desired.
     Many methods exist for comparing genome-wide genotypes in order to infer relatedness with
varying degrees of accuracy [5]. Most methods are computationally demanding and require full access

Genes 2018, 9, 481; doi:10.3390/genes9100481                                     www.mdpi.com/journal/genes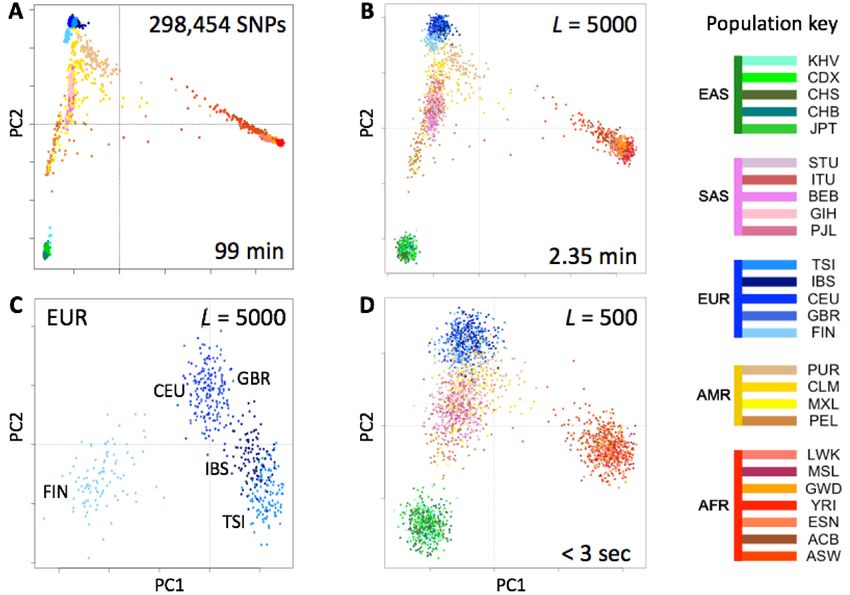
Genes 2018, 9, 481                                                                                       2 of 13

 to the genotype data of the individuals to be compared, potentially precluding their application to
 the study of samples with restricted access, or direct use of these methods by non-specialists interested
 in exploring their ancestry and genealogy.
      A genotype determined by DNA hybridization enumerates all observed alleles for a predefined
 set of variants of interest—typically common single-nucleotide polymorphisms (SNPs). In this format,
 each SNP is identified by its identifier (reference SNP identifier, or rsid) in the dbSNP database [6].
 For each rsid, the observed genotype of the individual is stated, including those for which
 the individual is homozygous for the reference allele. The chromosome and coordinate of the SNP,
 relative to a version of the reference that is (hopefully) stated in the ‘header’ of the genotype file,
 is implied by the rsid and not recorded in the genotype file.
      We recently published a method for converting personal whole genome sequence data into
‘genome fingerprints’ that facilitate and accelerate their comparison [7]. Our method encodes
 the characteristics of pairs of consecutive single nucleotide variants (SNVs) relative to a reference,
 as represented in variant call format (VCF) files or structurally equivalent formats. In contrast to the format
 of genotyping results, WGS results in VCF format typically encode only differences from the reference.
 Genomic locations in which the individual is homozygous for the reference allele are typically not stated,
 achieving a more compact representation.
      We present here an analogous method for summarizing personal genotypes, yielding genotype
 fingerprints that can be readily compared to estimate relatedness. The genotype fingerprints can be
 computed starting from any of several chip array designs, with genome coordinates expressed
 relative to any reference version. The resulting fingerprints are directly comparable without
 further conversion. Computation on the genotype fingerprints is fast and requires little memory,
 enabling comparison of large sets of genomes. No individual variants or other detailed features
 of the personal genome can be reconstructed from the fingerprint, allowing private information
 to be more closely guarded and protected, and enabling decoupling genome comparison from
 genome interpretation. Fingerprints of different sizes allow balancing the speed and accuracy of
 the comparisons. Due to the high value of estimating relatedness, the potential applications of
 genotype fingerprinting range from basic science (study design, population studies) to personalized
 medicine, forensics, and data privacy.

2. Materials and Methods

2.1. Methodology Overview
      We fingerprinted genotypes in four stages. First, we summarized a genotype as a tally of biallelic
SNPs, stratified by observed alleles, by variant identifiers, and accounting for allele frequencies
(raw fingerprint, Figure 1). We then normalized the raw fingerprint to account for systematic
methodological patterns. The resulting normalized fingerprint preserves differences between
individuals from different groups (populations), and are appropriate for clustering individuals by
population. To determine whether individuals were assigned to populations a priori or via clustering,
we averaged the normalized fingerprints of the individuals in a population to produce a ‘population’
fingerprint, which characterizes the population rather than an individual. To improve detection of
relationships within a population, we derived a ‘population-adjusted’ fingerprint from an individual’s
normalized fingerprint by subtracting the associated population fingerprint. Documentation, code,
and sample datasets are available at the project’s website. [8].
Genes 2018, 9, 481                                                                                          3 of 13

      Figure 1. Overview of method. Single nucleotide polymorphisms (SNPs) in the input genotype
      file were encoded into a table (raw) by observed alleles and rsid numerical value, considering allele
      frequencies. This could optionally be approximated by subtracting allele counts estimated from a simple
      model of an observed cohort (dashed arrows). The raw fingerprint was then normalized and could
      be adjusted to represent deviation from the center of the closest population. Rectangles and ellipses
      pertain to individual genotypes or to multiple genotypes, respectively; darker gray denotes the flow of
      information for one genotype from the input file to the normalized and adjusted fingerprints.

2.2. Raw Fingerprints
      A raw fingerprint is a 4-row by L-column table of SNP allele counts, where L is the main parameter
of the method and determines the information content of the fingerprint. By default, L = 1000. The four
rows correspond to the permitted alleles of binary SNPs (A, C, G and T); variants with other possible
alleles (including insertions, deletions, and multi-nucleotide variants) were ignored, partly because
binary SNPs are so abundant but also because other variant classes are subject to more variation in how
each observable allele is reported. We tallied all observed alleles for each SNP (reference and alternate).
Each SNP was tallied in a column determined from its rsid, which is its reference number in the dbSNP
database [6]. The full process is as follows:

(1)   Filter out all variants that are not autosomal, biallelic SNPs with reference and alternate alleles
      limited to A, C, G, and T. Optionally, include only SNPs in a preselected set, e.g., 23andMe
      (Mountain View, California, USA) V2 and V3. The remaining steps are applied to each
      retained SNP.
(2)   Determine a fingerprint column as the rsid modulo L (when L = 1000, SNP rs1801133 will be
      recorded in column 133).
(3)   For each SNP, count observations of each nucleotide: nA is the count of A alleles (0, 1, or 2), nC is
      the count of C alleles, etc., with nN = nA + nC + nG + nT = 2.
(4)   Determine the expected count E[nX ] = nN fX for each nucleotide X from a set of known allele
      frequencies fA + fC + fG + fT = 1. Depending on the context, these frequencies may be specific to
      each SNP (e.g., for human data, extracted from dbSNP), or without reference to external data,
      and may be computed per column from all SNPs contributing to the column among an observed
      cohort of genotypes (detailed below).
(5)   In the column for the SNP’s rsid, tally differences nX − E[nX ] from expectation for each row
      (add nA − E[nA ] to the row for A, nC − E[nC ] to the row for C, etc.).

     Retrieving the allele frequencies for each observed rsid requires prior knowledge and can incur
significant computational costs. A more efficient variant involves computing expected frequencies
for each row and column directly from a cohort of genotypes of a common type (determined with
the same assay, array design, etc.) as follows: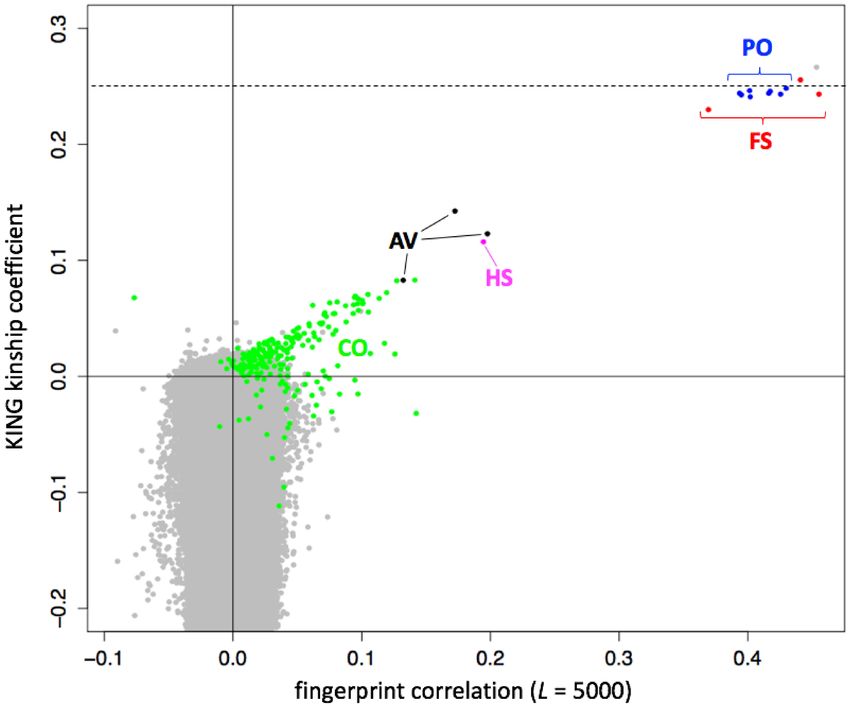
Genes 2018, 9, 481                                                                                4 of 13

(1)   Tally allele counts separately for each individual as above, except in step 5, increase the value
      in the [4 × L] matrix by 1 for each observed allele. In case of homozygosity, increasing twice
      results in an increase by 2. These tallies result in summed NA , NC , NG , and NT values in each
      column, with column total NN = NA + NC + NG + NT = 2k, twice the number of SNPs assigned
      to the column. The steps below do not require reprocessing the full genotypes, only these 4 × L
      tallies per individual.
(2)   Compute cohort average frequencies by summing the tallied allele counts in each column across
      all individuals and dividing by the column total. This produces four expected allele frequencies
      E[fX ] for each column, and corresponding expected tallies E[NX ] = NN E[fX ].
(3)   Finish computing each entry in each individual’s raw fingerprint by subtracting the expected
      tallies, tX = NX − E[NX ].

2.3. Fingerprint Normalization
     In this step, we accounted for unequal assortment of genotype information within the fingerprint.
This imbalance was due to a methodological aspect of the fingerprinting process (grouping of variants
by rsid), not a source of information of the fingerprinted individuals.

(1)   We subtracted the mean and divided by the standard deviation of each column,
      which mitigated differences between columns in the types of nucleotide substitutions
      (transitions and transversions), which were derived from the set of rsids assigned to each column.
(2)   We then subtracted the mean and divided by the standard deviation of each row. This further
      mitigated methodological differences between values within the fingerprint, which primarily
      reflect the genotyping methodology rather than variation between individuals.

2.4. Population Fingerprints
     We computed a population fingerprint as the average of the normalized fingerprints from
the individuals in the population. Note that genotype fingerprints are only directly comparable
when computed using the same format parameter L; different values of L cause rsids to be grouped
into columns differently. However, different versions of a genotype array design contain substantial
overlaps in the set of SNPs included in the array, and rsids are grouped in the same manner for a given
value of L regardless of array design. Thus, genotypes from the same population on slightly different
variants of the same array design may be mixed in computing the population fingerprint.

2.5. Adjusting Fingerprints for Population
     We then computed a population-adjusted fingerprint for an individual by subtracting a population
fingerprint from the normalized fingerprint of that individual. These individual fingerprints
and the population fingerprint must have been computed using the same parameter L.

2.6. Fingerprint Comparison
     To compare two fingerprints, concatenate the rows of each fingerprint matrix into a vector
and compute the Spearman correlation between the two vectors. This same procedure was appropriate
for comparing two normalized fingerprints or two population-adjusted fingerprints, whether adjusted
to the same or different populations.

2.7. Family Analyses
      We obtained 23andMe SNP chip genotype data for a family of five [9], including mother, father,
son, daughter, and aunt. The son was 23andMe V2 data and the rest of the family were 23andMe V3
data. We computed normalized genotype fingerprints (L = 5000) for the five individuals and performed
all pairwise comparisons. We also extracted from these samples the lists of rsids observed in V2 and V3
for use in further analyses.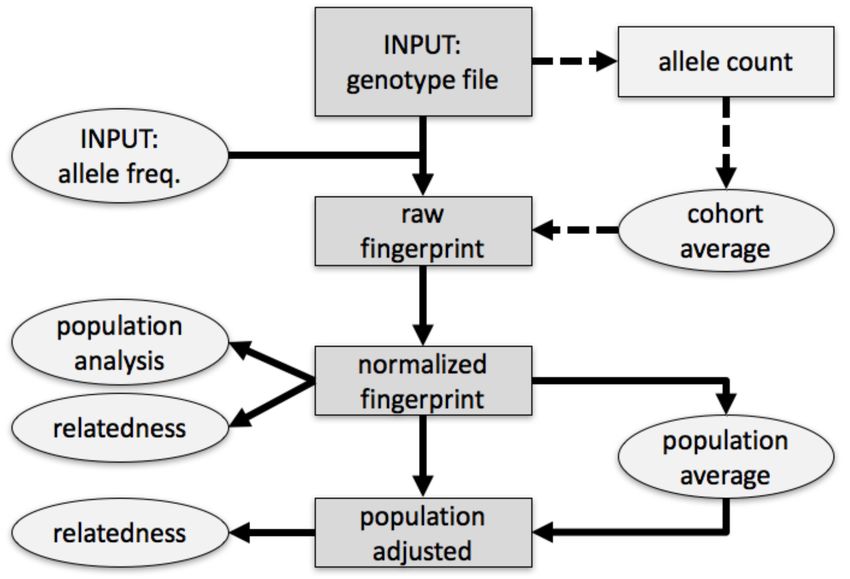
Genes 2018, 9, 481                                                                                    5 of 13

     We also studied WGS data from 35 individuals in a large family (Figure S1). All genomes
were sequenced by Complete Genomics, Inc. (Mountain View, California, USA) from blood
(n = 25) or saliva (n = 10) samples, and processed using pipeline version 2.5.0.20. The genome
data and a description of the family pedigree were donated by the private family. For each individual,
we extracted observed genotypes twice, once for each rsid in the 23andMe V2 SNP list and once using
the V3 SNP list. We then computed genotype fingerprints (L = 5000) from these extracted genotypes.
We categorized all pairwise relationships within the family as sibling, parent/child, half-sibling,
aunt/uncle, grandparent, cousin, second cousin, second cousin once removed, and unrelated.
We excluded more complex relations, e.g., child and grandchild of half-siblings. We computed
all pairwise correlations using the same chip design (e.g., both individuals in the pair using the V2
SNP list) and using discordant chip designs (e.g., one individual with V2 and the other with V3).
Finally, we computed the average and standard deviation of the computed correlations, stratified by
the relationship categories listed above.

2.8. Population Structure Analysis
     Principal components analysis (PCA) is a standard method for characterizing population
structure prior to genome-wide association studies (GWAS). We therefore compared
well-characterized population structures within data from the 1000 Genomes Project (release 20130502,
ALL.chrNN.phase3_shapeit2_mvncall_integrated_v5.20130502.genotypes.vcf.gz). As a genomic method,
we identified SNPs with a minor allele frequency of 5% or more, removed SNPs in complete linkage
disequilibrium with a SNP to the left (i.e., a smaller chromosomal position), retained 5% at random (298,454
SNPs), and counted occurrences of the minor allele (0, 1, or 2) in each genome to form a 2504 × 298,454
genotype matrix M.
     As a fingerprint-based method, we extracted observed genotypes for each of the 2504 genomes
twice, once for each rsid in the 23andMe V2 SNP list and once using the V3 SNP list. We then
computed genotype fingerprints from these extracted genotypes using L = 500, 1000, and 5000,
resulting in fingerprint data matrices of 2504 × 2000, 2504 × 4000, and 2504 × 20,000 entries,
respectively. We performed standard PCA separately on the six resulting matrices (V2 or V3 and L = 500,
1000, or 5000) using the R function call prcomp(M,center=TRUE,scale.=TRUE).

2.9. Evaluation of “Nearest Population Fingerprint” for Population Assignment
     We computed a population fingerprint for each of the 26 populations selected for study in the 1000
Genomes Project. We then re-classified each individual via fingerprint comparison against the 26
population fingerprints, as described above for comparing individual fingerprints. Each individual
was classified as belonging to the population with the closest population fingerprint. To avoid
overfitting, we excluded each individual from the computation of their own population fingerprint in
leave-one-out fashion.

3. Results

3.1. Method for Encoding Genotyping Data
     We developed a locality sensitive hashing [10] algorithm for computing fingerprints from
genotype data, including data produced by a DTC genetics company (23andMe, Mountain View,
California, USA). These genotype fingerprints meet the characteristics of genotype data: they can be
rapidly computed starting from any of several chip array designs, with genome coordinates expressed
relative to any reference version, and the resulting fingerprints are directly comparable as long as
the same fingerprint length L is used. We described fingerprints generated using SNP lists derived
from two array designs used by 23andMe: V2, based on Illumina (Foster City, California, USA)
HumanHap550 Genotyping BeadChip (~550,000 SNPs) and V3, based on Illumina OmniExpress
Genotyping BeadChip (~960,000 SNPs). The fingerprints are a reduced representation of the genotype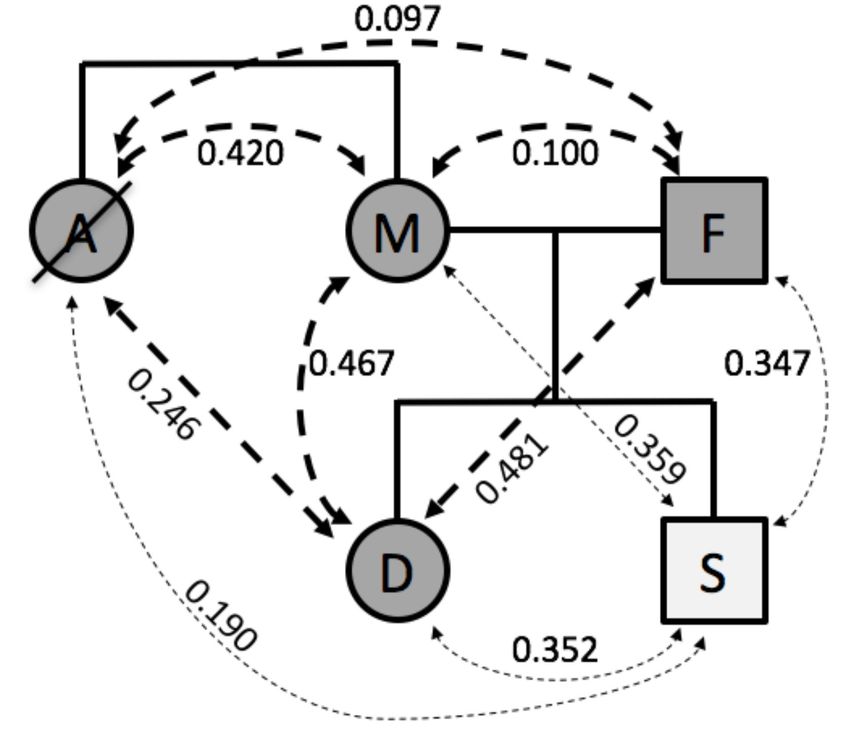
Genes 2018, 9, 481                                                                                   6 of 13

data computed once per individual, and can be efficiently databased and compared to determine
whether two genotypes represent the same individual, closely related individuals, or unrelated
individuals. As with our previously reported genome fingerprints [7], individual alleles cannot be
reconstructed from the genotype fingerprint beyond what is predictable from detectable population
and family relationships, enabling sharing of fingerprints for comparison when privacy concerns
prevent sharing the full genotype file itself.
     The main parameter of our algorithm, L, determines the size and SNP groupings of the fingerprint.
Smaller fingerprints (e.g., L = 100) average variants over fewer bins and are useful for extremely fast,
low-resolution comparisons, to determine identity, whereas larger fingerprints (L = 1000 or 5000)
are higher resolution and better support detailed analyses including population reconstruction.

3.2. Computation on Genotype Fingerprints is Fast
     Generation of raw genotype fingerprints is simple, and its speed is limited by the time
required to read the file rather than the fingerprint size L. On our workstations, it required
10–15 s per 500,000–960,000-SNP genotype. For higher speeds, each raw fingerprint is independent
and the process is readily parallelized. In our population studies, population fingerprints for
all 26 populations of the 1000 Genomes cohort required less than 60 s, fingerprint normalization
averaged 0.13 s per genotype, and serializing the 2504 fingerprints for efficient comparison required
only 37 s. The 3,133,756 “all-against-all” comparisons for this data set took 15 CPU seconds for
L = 1000 (4.8 microseconds per comparison) and 79 CPU seconds for L = 5000 (25.2 microseconds per
comparison). Although parallelization was not required for this cohort, it is straightforward and may
be helpful for all-against-all comparisons of cohorts of tens to hundreds of thousands of genotypes.

3.3. Rapid Relationship Detection
     Here, we illustrate the use of genotype fingerprints for characterizing family relationships within
a family of five [4] who had previously made their 23andMe genotype results publicly available.
Comparisons of these fingerprints resulted in similarity scores (Spearman’s rho values) that were
consistent with the known family relationship types (Figure 2). Rho values for full sibling pairs
(aunt and mother 0.420, daughter and son 0.352) and parent-offspring pairs (0.481, 0.467, 0.359,
and 0.347) were higher than for avuncular relationships (aunt and daughter 0.246, aunt and son 0.190),
which in turn were higher than unrelated pairs (aunt and father 0.097, mother and father 0.100).
     The correlations between the son and the other family members was reduced, as expected for
comparisons across SNP lists (V2 for son, V3 for all others) with both substantial overlap and differences.
To further quantify this effect, we compared genotype fingerprints based on both chip designs
(V2 and V3) in the context of a larger family pedigree (Figure S1). We observed a ratio of 0.75
when comparing pairwise correlations of fingerprints based on discordant designs (i.e., V2–V3)
vs. correlations of fingerprints based on the same design, i.e., V2–V2 and V3–V3 (Figure S1C). It is
thus possible to adjust by scaling the correlations observed from discordant designs (Figure S1D),
yielding comparable correlations for each relationship level independent of chip design.
Genes 2018, 9, 481 7 of 13
Figure 2. Comparison within a family of five. A: Aunt (deceased); M: Mother; F: Father; D: Daughter;
S: Son. Dashed lines represent family relationships; thin lines denote comparison between individuals
assayed on different versions of the genotyping platform.
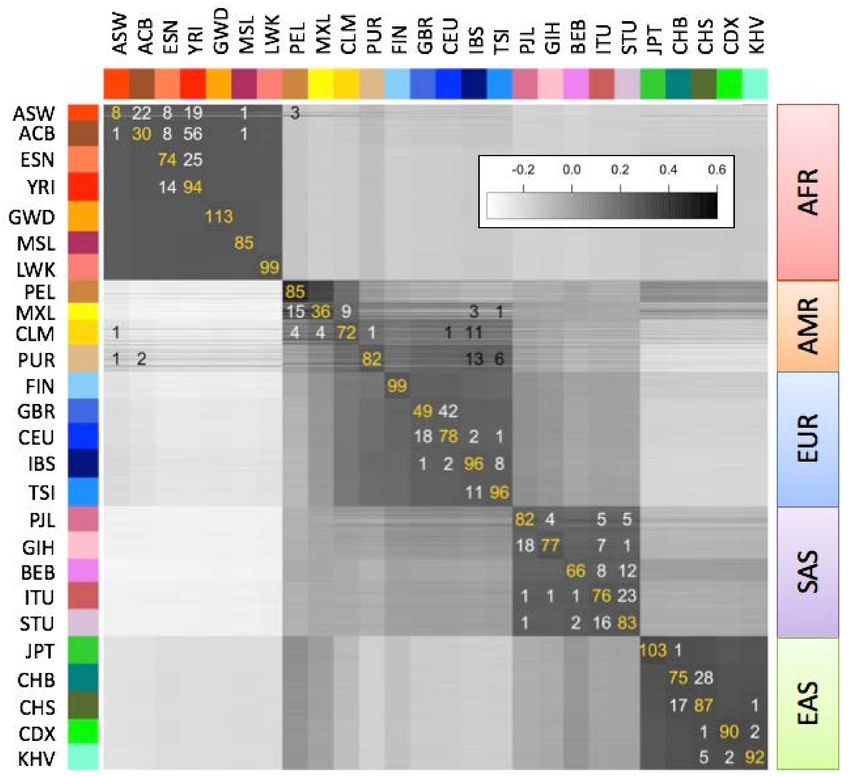
3.4. Rapid Analysis of Population Structure
We tested the utility of genotype fingerprints for population studies. We extracted genotypes
for all 2504 individuals of the 1000 Genomes Project cohort from their VCF-format genomes
using the 23andMe V3 SNP list, fingerprinted each extracted genotype, and used PCA to
reconstruct the known population structure (Figure 3). This entire process required a fraction of
the time and memory to perform the same task using a more standard approach (see Methods).
As expected, the quality of the reconstruction depended on fingerprint resolution (L): fingerprints
with L = 5000 yielded excellent population structure reconstruction, comparable to the results of
population reconstruction using high-resolution genome fingerprints (compare Figures 3 and 5
from Glusman et al. [7]). Genotype fingerprints with smaller values of L yielded progressively
lower-resolution results at proportionally higher speeds (seconds rather than more than an hour,
Figure 3). Analysis of only the closely related European populations (Figure 3C) showed the same
separations apparent in analyses of a limited number of SNPs (not shown): full separation of the Finns
(FIN), the Northwestern Europeans: Utah Residents with Northern and Western European Ancestry
(CEU), British in England and Scotland (GBR), and the Mediterraneans: Iberians in Spain (IBS),
Toscani in Italy (TSI), with less separation of IBS from TSI and essentially none between CEU
and GBR. Thus, genotype fingerprints retain differences at both large and small scales, allow a suitable
balance between resolution and speed, and support scaling of population structure studies to whole
population-scale genotype data, without requiring analysis of linkage disequilibrium and other
complications prior to analysis.Genes 2018, 9, 481 8 of 13
Figure 3. Estimates of population structure in the 1000 Genomes Project data set at different
resolutions. Individuals are color coded according to their population as per the key to the right.
EAS, SAS, EUR, AMR and AFR: East Asian, South Asian, European, Admixed American, and African,
respectively. (A) Principal components analysis (PCA) of the 2504 individuals using ~300,000 SNPs.
(B) PCA on genotype fingerprints (N = 2504) with L = 5000. (C) PCA on genotype fingerprints
of European populations (N = 503) with L = 5000. (D) PCA on genotype fingerprints (N = 2504)
with L = 500.
3.5. Rapid Population Assignment
We computed “population fingerprints” in the 1000 Genomes data set by averaging genotype
fingerprints (V3 set, L = 5000) of the individuals in each population. To determine each individual’s
population of origin, we then computed the correlation between the fingerprint of a query genome
and the fingerprint of each population (Figure 4), and classified each individual as belonging
to the population with the strongest fingerprint correlation. We evaluated this classification
method using leave one out cross-validation. The annotated population had the highest correlation
for 2027 of the 2504 samples (81%), or among the top two- (92.9%) or top three-most (96.1%)
correlated. The only misclassifications to a population from another continent involved the Admixed
American populations (AMR); excluding these populations increased correct classifications to 85.7%
(best match), 97.8% (top two) and 99.2% (top three). In general, misclassifications both between
and within continental groups occurred between historically or geographically associated population
pairs: Americans of African Ancestry in Southwest USA (ASW) and African Caribbeans in Barbados
(ACB) with Nigerian populations Esan (ESN) and Yoruban (YRI); Latin American populations
Mexican Ancestry from Los Angeles (MXL), Colombians from Meellín (CLM), and Puerto Ricans
(PUR) with Mediterranean populations IBS, TSI; Northern and Southern Han Chinese populations
CHB, CHS; South Indian populations Indian Telugu from the UK (ITU), Sri Lankan Tamil from
the UK (STU), suggesting that admixture was the principal source of misclassification. Even for very
closely related population pairs (e.g., CEU and GBR), individuals were more often correctly classified
than misclassified.Genes 2018, 9, 481 9 of 13
Figure 4. Correlations between the genotype fingerprints of the 2504 individuals (rows) and the average
fingerprints of the 26 populations (columns) in the 1000 Genomes Project. Population codes and colors
as in Figure 3. Numbers in gold, white, and black denote population assignments: to the same
annotated population, to the same continent but different population, or to a different continent,
respectively. Inset: correlation color scale.
3.6. Robustness to SNP List
We evaluated whether genotype fingerprints can be compared across chip array designs.
We fingerprinted genotypes for each individual in the 1000 Genomes Project data set, extracted using
the 23andMe V2 and V3 SNP lists (548,911 and 902,448 SNPs, respectively), yielding a mixed set
of 5008 fingerprints (V2 and V3 fingerprints for each of 2504 individuals). We studied this joint set
using PCA (Figure 5A) and observed that the first two principal components reconstruct the known
population structure (Figure 3). PC3 separated between fingerprints computed on V2 and V3 versions
(Figure 5B). The correlations between the two versions of each individual (self, Figure 5C) were always
higher than those between related individuals (parent/offspring, full siblings), which in turn were
higher than those between unrelated individuals.
We further evaluated the robustness of genotype fingerprints for population assignment across
array designs, for example, when the individual being studied was genotyped on a different array
than the populations being used as reference. As above, we classified each of the individuals in the 1000
Genomes data set using genotype fingerprints (L = 5000) based on the V2 or the V3 sets, and relative
to population fingerprints derived from the V2 or the V3 sets. All four combinations yielded similar
classifications (Figure S2). As expected, the classifications using discordant SNP lists were slightly
less accurate.
Although fingerprints derived using different versions of the same chip design were
distinguishable, comparisons between them would still be useful for detecting identical individuals,
family analysis (Section 3.3.), and population analysis.Genes 2018, 9, 481 10 of 13
Figure 5. Comparison of genotype fingerprints relative to different SNP lists. We deduced normalized
genotype fingerprints (L = 5000) for the 1000 Genomes Project cohort using the 23andMe V2 (red) and V3
(blue) SNP lists. (A) First two principal components, showing population structure. (B) Third and fourth
principal components, showing separation between the two SNP lists. (C) Distribution of cross-correlations
between the two sets of genotype fingerprints (all possible pairs of V2 vs. V3). Comparisons between
the two genotype fingerprints for the same individual (self) and comparisons between parent/offspring
and full-sibling pairs (PO, FS) formed distinct, high-correlation subsets.
3.7. Fast Detection of Close Relationships
Based on our work with genome fingerprints, we reasoned that using population fingerprints to
cancel out correlations due to information shared among a population would allow close relationships
to be distinguished from shared population backgrounds. We therefore adjusted the L = 5000 V3-type
fingerprints (see Section 3.6.) for their annotated population of origin and performed all pairwise
comparisons of these adjusted fingerprints. We compared the fingerprint correlations with kinship
coefficients computed using KING [11] and with previously reported relationships [12] computed using
RELPAIR [13] (Figure 6). As expected, the correlation between individuals from the same annotated
population (Figure 4), but not related within a few generations, was removed by adjustment to
the population average (Figure 6), and population-adjusted fingerprints for unrelated individuals
were essentially uncorrelated. Comparison of population-adjusted genotype fingerprints supports
the detection of individuals in the 1000 Genomes cohort previously reported as closely related [12].
The highly-correlated pairs correspond to relationships of degrees varying from full siblings to cousins.
For these pairs, fingerprint correlations showed a linear relationship with kinship coefficients computed
by KING (Figure 6, colored points). Parent-offspring and full sibling relationships, which haveGenes 2018, 9, 481 11 of 13
the same expected KING kinship coefficient (0.25) but different variance from that expected value,
produced equivalent high fingerprint correlations of around 0.4.
Figure 6. Identification of close relationships in the 1000 Genomes Project. Comparison between
the correlations of population-adjusted genotype fingerprints (V3 set, L = 5000) and the kinship
coefficient computed using KING, highlighting close relationships identified using RELPAIR.
FS: full siblings (red). PO: parent/offspring (blue). HS: half siblings (magenta). AV: avuncular (black).
CO: cousins (green). All other pairs in gray. One FS pair (HG03873 and HG03998, with maximal
kinship, in gray) was not identified by RELPAIR.
4. Discussion
We presented a method for computing fingerprints of genome-wide SNP array genotypes as reported
by DTC genetics companies, using 23andMe data as an example. Like our previously reported fingerprints
from whole-genome resequencing data, genotype fingerprints retain sufficient information to enable
ultrafast comparison of genotypes, without retaining the sensitive individual SNP data necessary to
predict phenotypes. Genotype fingerprints are therefore suitable for databasing and sharing ancestry
and close relationship determination without exposing more sensitive health-related information.
We demonstrated the utility of genotype fingerprints for rapid versions of common tasks:
identifying genotypes from the same individual, from closely related individuals, or from a known
population, and de novo clustering of individuals into subpopulations. Comparing fingerprints
derived from two different SNP lists (23andMe V2 and V3), our genotype fingerprints were robust
to differences in the number of SNPs assayed for detecting identity, detecting close relationships,
and delineating populations.Genes 2018, 9, 481 12 of 13
Conceptually, genotype fingerprints are an adaptation of our genome fingerprinting method [7]
to more widely available, more standardized, but lower-resolution genotype data. Whereas genome
fingerprints facilitate comparison of data across different reference sequence versions by encoding
consecutive SNV pairs, genotype fingerprints achieve a similar interoperability by encoding individual
SNPs using annotated rsids, alleles, and allele frequencies. SNPs are simply SNVs with high population
frequency, but this frequency difference has practical consequences. Although whole genome sequencing
is expected to reveal an increasing number of rare SNVs, the vast majority of SNPs have already
been identified, evaluated for linkage, assigned stable identifiers (rsids), and incorporated into
high-throughput assays. In contrast, many SNVs either lack identifiers or have been assigned preliminary
identifiers still subject to change (e.g., by merging with a different identifier representing the same
variant). Stable identifiers facilitate matching variants across genome reference versions and assays,
enabling the desired robustness to a changing reference genome using the simpler encoding method
presented here.
Insertions and deletions have also been assigned standard representations in genotype files
(symbols I and D, respectively), but are much less abundant in the genome than SNPs, are not as widely
assayed, and require normalization prior to extraction as genotypes from WGS or exome data [14].
For simplicity and consistency, we therefore chose to exclude them from analysis, as we did for
computing genome fingerprints from VCF files. We also chose to exclude SNPs on the sex chromosomes,
which vary in count between males and females and may lead to distorted similarity values.
Sharing genetic information raises several privacy concerns. Much attention has been paid
to the risk of re-identification of de-identified samples [15], even when querying genetic data sets
via bandwidth-limiting interfaces like the GA4GH beacons. These concerns have given rise to privacy
preservation strategies such as obscuring rare variants and budgeting queries [16]. While enabling
an important and powerful query, namely, “has this allele been seen before?” [17], these strategies for
preventing re-identification preclude multiple other potential applications, thus limiting the utility
of genome data sharing. There are, however, genetic data sharing scenarios in which anonymity is
not, but phenotype prediction is, an issue. For example, an individual may wish to compare their
genotype (obtained via a DTC genetic testing company) to the genotypes of other individuals for
ancestry and relationship determination, but without revealing whether their genome harbors alleles
associated with a specific phenotype (e.g., Alzheimer’s disease) both currently known alleles and ones
whose significance may be discovered in the future. Like genome fingerprints, genotype fingerprints
decouple genotype comparison from genotype interpretation, supporting the identification of closely
related individuals without exposing individual variant states.
At present, the number of private individuals who have used DTC genetics services to
ascertain their own genotype vastly exceeds the number of individuals with full genome data.
We expect genotype fingerprints to have immediate applicability for facilitating genotype comparisons,
empowering citizen science without concomitantly revealing sensitive private genetic information.
Supplementary Materials: The following are available online at the project website [8], and at this link: http:
//www.mdpi.com/2073-4425/9/10/481/s1, Figure S1: Genotype fingerprints analysis of larger family pedigree,
Figure S2: Correlations between the genotype fingerprints of the 2504 individuals (rows) and the average
fingerprints of the 26 populations (columns) in the 1000 Genomes Project.
Author Contributions: G.G. designed the study. M.R. and G.G. performed analyses, wrote the manuscript,
and approved its final version.
Funding: This research was funded by NIH grant number U54 EB020406.
Acknowledgments: We wish to thank the Corpas family for releasing their individual genotypes as CC0.
Conflicts of Interest: G.G. and M.R. hold a provisional patent application on the method described in this
manuscript. G.G. holds stock options in Arivale, Inc. Arivale, Inc. did not fund the study and was not involved in
its design, implementation, or reporting. The funders had no role in the design of the study; in the collection,
analyses, or interpretation of data; in the writing of the manuscript, and in the decision to publish the results.Genes 2018, 9, 481 13 of 13
References
1. Canada, R. Exploring Microarray Chips. Available online: http://haplogroup.org/exploring-microarray-
chips/ (accessed on 17 August 2018).
2. List of DNA testing companies—ISOGG Wiki. Available online: https://isogg.org/wiki/List_of_DNA_
testing_companies (accessed on 17 August 2018).
3. Imai, K.; Kricka, L.J.; Fortina, P. Concordance study of 3 direct-to-consumer genetic-testing services.
Clin. Chem. 2011, 57, 518–521. [CrossRef] [PubMed]
4. Glusman, G.; Cariaso, M.; Jimenez, R.; Swan, D.; Greshake, B.; Bhak, J.; Logan, D.W.; Corpas, M. Low budget
analysis of Direct-To-Consumer genomic testing familial data. F1000 Research 2012, 1. [CrossRef] [PubMed]
5. Ramstetter, M.D.; Dyer, T.D.; Lehman, D.M.; Curran, J.E.; Duggirala, R.; Blangero, J.; Mezey, J.G.;
Williams, A.L. Benchmarking relatedness inference methods with genome-wide data from thousands of
relatives. Genetics 2017, 207, 75–82. [CrossRef] [PubMed]
6. Sherry, S.T.; Ward, M.H.; Kholodov, M.; Baker, J.; Phan, L.; Smigielski, E.M.; Sirotkin, K. dbSNP: The NCBI
database of genetic variation. Nucleic Acids Res. 2001, 29, 308–311. [CrossRef] [PubMed]
7. Glusman, G.; Mauldin, D.E.; Hood, L.E.; Robinson, M. Ultrafast comparison of personal genomes
via precomputed genome fingerprints. Front. Genet. 2017, 8, 136. [CrossRef] [PubMed]
8. Genotype fingerprints’ homepage. Available online: http://db.systemsbiology.net/gestalt/genotype_
fingerprints (accessed on 17 August 2018).
9. Glusman, G.; Cariaso, M.; Jimenez, R.; Swan, D.; Greshake, B.; Bhak, J.; Logan, D.W.; Corpas, M. 23andMe
SNP chip genotype data 2012. Available online: https://figshare.com/articles/23andMe_SNP_chip_
genotype_data/92682 (accessed on 17 August 2018).
10. Indyk, P.; Motwani, R. Approximate nearest neighbors. In Proceedings of the thirtieth annual ACM
symposium on Theory of computing—STOC ’98; ACM Press: New York, NY, USA, 1998; pp. 604–613.
11. Manichaikul, A.; Mychaleckyj, J.C.; Rich, S.S.; Daly, K.; Sale, M.; Chen, W.-M. Robust relationship inference
in genome-wide association studies. Bioinformatics 2010, 26, 2867–2873. [CrossRef] [PubMed]
12. Gazal, S.; Sahbatou, M.; Babron, M.-C.; Génin, E.; Leutenegger, A.-L. High level of inbreeding in final phase
of 1000 Genomes Project. Sci. Rep. 2015, 5, 17453. [CrossRef] [PubMed]
13. Epstein, M.P.; Duren, W.L.; Boehnke, M. Improved inference of relationship for pairs of individuals. Am. J.
Hum. Genet. 2000, 67, 1219–1231. [CrossRef]
14. Tan, A.; Abecasis, G.R.; Kang, H.M. Unified representation of genetic variants. Bioinformatics 2015,
31, 2202–2204. [CrossRef] [PubMed]
15. Erlich, Y.; Williams, J.B.; Glazer, D.; Yocum, K.; Farahany, N.; Olson, M.; Narayanan, A.; Stein, L.D.;
Witkowski, J.A.; Kain, R.C. Redefining genomic privacy: Trust and empowerment. PLoS Biol. 2014,
12, e1001983. [CrossRef] [PubMed]
16. Raisaro, J.L.; Tramèr, F.; Ji, Z.; Bu, D.; Zhao, Y.; Carey, K.; Lloyd, D.; Sofia, H.; Baker, D.; Flicek, P.;
Shringarpure, S.; Bustamante, C.; Wang, S.; Jiang, X.; Ohno-Machado, L.; Tang, H.; Wang, X.; Hubaux, J.-P.
Addressing beacon re-identification attacks: Quantification and mitigation of privacy risks. J. Am.
Med. Inform. Assoc. 2017, 24, 799–805. [CrossRef] [PubMed]
17. Glusman, G.; Caballero, J.; Mauldin, D.E.; Hood, L.; Roach, J.C. Kaviar: An accessible system for testing SNV
novelty. Bioinformatics 2011, 27, 3216–3217. [CrossRef] [PubMed]
© 2018 by the authors. Licensee MDPI, Basel, Switzerland. This article is an open access
article distributed under the terms and conditions of the Creative Commons Attribution
(CC BY) license (http://creativecommons.org/licenses/by/4.0/).You can also read