The Effects of Virtual and Computer Based Real Laboratory Applications on the Attitude, Motivation and Graphic Skills of University Students
←
→
Page content transcription
If your browser does not render page correctly, please read the page content below
International Journal of Innovation in Science and Mathematics Education, 27(1), 1-17, 2019

The Effects of Virtual and Computer Based
Real Laboratory Applications on the
Attitude, Motivation and Graphic Skills of
University Students
Uğur Saria, H. Miraç Pektaşa, Harun Çelika, Talip Kirindia

Corresponding author: Uğur Sarı (ugursari@kku.edu.tr)
a
  Kırıkkale University, Education Faculty, Department of Mathematics and Science Education, Turkey

Keywords: physics laboratory, computer based laboratory, computer simulations, graphical
skills, motivation, attitude

International Journal of Innovation in Science and Mathematics Education, 27(1), 1-17, 2019.

Abstract
In recent years, experience of students in technology-equipped laboratories has been seen as an effective way to
teach and learn physics. In this sense, experiments and demonstrations using computer based data collection
systems and simulations that allow students to design their own virtual experiments in the physics laboratory come
into prominence. In this study, the usage of computer based laboratory and virtual laboratory applications in the
physics laboratory are discussed. In this context, the effects of computer based laboratory applications and virtual
laboratory applications on students' graph drawing, understanding and interpretation skills, attitudes towards the
physics laboratory and motivation for learning science were investigated. Sixty university students participated in
the pre-test post-test semi-experimental design study. While the control group carried out experiments on the laws
of motion with computer based laboratory, the experimental group performed the same experiments with virtual
laboratory applications. The data of the study were collected through attitude scale, motivation scale and graph
drawing, understanding and interpretation test. Independent sample t-tests were used in the analysis of the data.
The findings show that computer based laboratory practices are more effective in the development of students'
ability to draw, understand and interpret graphics than virtual laboratory applications. It has been determined that
both computer based laboratory and virtual laboratory applications have a positive effect on students' attitudes
and motivations. Also, computer based laboratory applications were found to be more effective in increasing
students' motivation levels for communication, collaborative work, and participation than virtual laboratory
applications. The findings of the study suggest that computer based laboratory applications in physics laboratories
are more effective than virtual laboratory applications.

Introduction
When we look at technology-assisted science education research, computer use is mostly seen
as computer-based laboratory (CBL) and virtual laboratory (VL) applications (Daineko,
Dmitriyev, & Ipalakova, 2017; Duman & Avcı, 2016; Liu, Wu, Wong, Lien, & Chao, 2017).
CBL is the system using for conducting experiments, collecting and analyzing data and
providing graphical systems. They include several modelling and data acquisition tools like
computer, sensors and timer (Amrani & Paradis, 2010; Liu et al., 2017). The richness of CBL
applications and modelling tools are very important in physics education (Bozkurt, 2008).
Especially with CBL applications, students can create graphs which are moving and changing
continuously through software which is transferred to computer by using sensors and receivers.
Physical parameters such as position, speed, acceleration, force and temperature can be
measured and shown to students using such software. Therefore, the waste of time in the
collection of data and in drawing the graphs is eliminated (Bozkurt, 2008; Tortosa, 2012). Thus,

                                                         1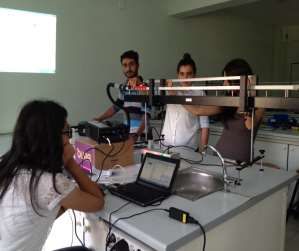
International Journal of Innovation in Science and Mathematics Education, 27(1), 1-17, 2019

students can focus their attention in explaining the relationship among the data variables (Liu
et al., 2017). VL applications are computer modelling tools with visualizations, animations and
simulations that present theoretical or simplified models of real life processes and phenomena
(Mcdonald, 2016; Smetana & Bell, 2012). Despite not providing real equipment, experimental
data generated by VL are empowered by mathematical models. Thus, at the end of the virtual
experiment, students are provided with reasonable experimental data for data processing and
analysis at an advanced level (Daineko et al., 2017). Especially in recent years, the use of
computer simulations as technological products to increase the effectiveness of physics
education is in the foreground (Jaakkola, Nurmi, & Veermans, 2011; Rutten, van Joolingen, &
Van der Veen, 2012; Rutten, Van der Veen, & van Joolingen, 2015; Daineko et al., 2017).
The rapid spread of technology in schools and integration of it into teaching reshaped the
interaction of teachers, students, curricula and technologies, and eventually transformed the
learning environment (Wu, Chang, & Guo, 2009). This process, which makes the use of
computer technology in teaching and learning applications important, has increased the
motivation and meaningful learning of students for physics learning (Berrett, 2012). So, it has
been reshaped in laboratories as an important learning environment in physics teaching, and
technology has been used in laboratories (Chiu, DeJaegher, & Chao, 2015). The use of
technology in science laboratories provides useful opportunities for students who can
participate in high-budget, dangerous and complex experiments which are difficult to realize
(Akçayır, Alçayır, Pektaş & Ocak, 2016). Research on the use of technology in science
laboratories has shown that it yields positive results (Olympiou & Zacharias, 2013; Trundle &
Bell, 2010). On the other hand, some studies reported that the use of educational technology
did not significantly affect the effectiveness of science laboratories (Klahr, Triona, & Williams,
2007; Wiesner & Lan, 2004).
Learning has become richer and more permanent with the inclusion of technological tools such
as projection and smart boards in the classroom as well as in science laboratories. These
applications increase student motivation, enable students to learn at their own pace and
combine computer technology with self-learning principles (Uşun, 2004). Thus, technology
allows students to access educational resources virtually from anywhere at any time (Zhang,
de Pablos, & Xu, 2014). The theories and approaches that are based on the curriculum have
been integrated into the technology, too. There are various student-cantered, active learning
methods and techniques suitable for constructivist learning environments. One of the most
popular applications supporting these methods and techniques is the use of simulations (Azar
& Aydın-Şengüleç, 2011; Jaakkola & Nurmi, 2008; Jaakkola et al., 2011; Rutten et al., 2012).
Some studies have shown that simulations are effective ways to increase students’ perceptions
and interests and to encourage students' cognitive structures (Rutten et al., 2012). It can be said
that learning environments enriched by CBL and VL applications contribute to physics
teaching. However, teachers' use of technology in learning environments may vary because the
physical and technological equipment of schools and the effects of technology on learning
products may change.
Several empirical studies were carried out on the advantages of CBL and VL. Kaberman and
Dori (2009) showed that CBL applications provide significant improvement in students'
higher-order thinking skills. Gunhaart and Srisawasdi found the improvement of learners' in-
depth understanding of scientific concepts with the assistance of CBL in physics classes
(Gunhaart & Srisawasdi, 2012). In another study, it was determined that learners did experience
a realistic process of scientific inquiry with CBL (Russell, Lucas, & McRobbie, 2004). The
question of how VL applications should be used most effectively in science education comes
up in research (Moser, Zumbach, & Deibl, 2017; Rutten et al., 2012). Many researchers have
tried to answer such a question with studies focusing on the effects of VL practices on students'

                                                    2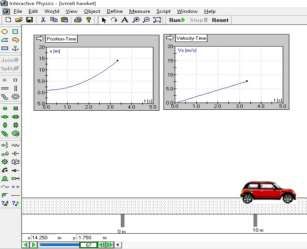
International Journal of Innovation in Science and Mathematics Education, 27(1), 1-17, 2019

understanding of scientific concepts and increasing their motivation (Rutten et al., 2012). Some
researchers have used simulations to improve the effectiveness of traditional methods
(Jimoyiannis & Komis, 2001), and some have compared the computer methods with traditional
methods (Chen & Howard 2010; Sarı & Güven 2013). Other researchers used simulations as
pre-laboratory activities to increase the effectiveness of laboratory equipment (Zacharia, 2007;
Ulukök, Çelik, & Sarı, 2013). It has also been investigated whether VL can replace traditional
laboratories (Finkelstein, Perkins, Adams, Kohl, & Podolefsky, 2004; Ünlü & Dökme, 2011).
However, there are almost no studies to compare VL and CBL applications. This study
compares CBL and VL in terms of the effects on students' graphic skills, attitudes towards
physics laboratories and their motivation for science learning

Theoretical background
Learning physics is considered a challenge for many students who develop a negative attitude
towards physics. For this reason, effective physics teaching should encourage learning by
developing positive attitudes in students (Sarı, Hassan, Güven, & Şen, 2017). Such learning
occurs when physics teaching focuses on creating interactive learning to facilitate student self-
direction in constructing physical science understandings (Zacharia, 2003). Laboratory
activities that enable students to work individually or in groups in physics teaching are very
important. Significant laboratory experience is necessary for students to promote, demonstrate
and strengthen the concepts of physics (Darrah, Humbert, Finstein, Simon, & Hopkins, 2014).
Laboratory activities enable students to have first-hand experience in seeing how physics laws
work. On the other hand, in recent years, with the development of technology, many technology
products have taken place both in the laboratory and in the classroom in order to increase the
effectiveness of physics teaching. Laboratories are enriched with these technology products
and made more modern and technologically equipped than traditional structure. According to
Mottmann (1999), the two most important reasons for putting technology and other
instructional innovations in physics teaching are improving the physical skills of the students
and changing the negative attitudes of the students about physics. Rios and Madhavan (2000)
identified four technologies suitable for physics education: (1) computer interface equipment
to collect and process data, (2) experimental or theoretical modelling, (3) computer simulations
requiring graphics, and (4) research and presentation programs for presenting, reporting and
data collection. CBL systems are used to conduct experiments in physics laboratories, to collect
and analyse data, to provide graphical systems, and they include technological products such
as computer, sensor and timer. CBL experiments have been successfully applied in science and
technology schools for decades (Thornton & Sokoloff, 1990; Steinberg, 2003). Especially,
CBL experiments have been developed and applied in the field of physics. Appropriate sensors,
interfaces and software have been used to create an effective data collection system for
collection, analysis and display of experimental data (Amrani & Paradis, 2010). Students who
experiment on these systems can examine the real-time display of their results and graphics.
Thus, interpretation of the data takes place in a very short time. The CBL experiment improves
learning by allowing students to perceive the relationship between independent and dependent
variable parameters. Discovery with real-time measurements provides feedback and
understanding of the subject by presenting the data graphically to the students. It also allows
them to predict the relationships between variables and to confirm the nature of these
relationships (Trumper & Gelbman, 2000).
Computer simulations have a special importance in physics teaching and learning. They
provide new learning environments that aim to improve the teaching potential of teachers and
facilitate active participation of students (Jimoyiannis & Komis, 2001). Moreover, simulations
are realized by presenting dynamic theoretical or simplified models of phenomena or processes

                                                   3
International Journal of Innovation in Science and Mathematics Education, 27(1), 1-17, 2019
and encouraging students to observe, discover, reconstruct and instantly receive feedback on
objects, events and processes. The simulations allow students to change variables and observe
the results to produce scientific results. Simulations can also provide opportunities to visualize
dangerous, time-consuming or complex events to interact in class or in the laboratory
(McDonald, 2016). The contribution of the simulations to the learning environment and to the
learner according to many studies in the literature can be listed as follows (Çelik &
Karamustafaoğlu; Daineko et al., 2017; Jimoyiannis & Komis, 2001; Mcdonald, 2016; Rutten
et al., 2012):
1. Reduces the risk of potential hazards and reduces the economic cost.
2. The virtual laboratory allows the creation of a model for objects, processes and
phenomena that cannot be realized in an educational institution or that cannot be actually
observed.
3. Virtual laboratory studies are interactive. They can respond to user behaviour in different
ways. For example, the weight or drop height of a selected object can only be changed
by pointing with a cursor.
4. Virtual laboratories provide an interactive application in accordance with individual
learning speed.
5. Virtual laboratory applications provide a variety of experimental materials.
6. It provides an alternative to the cost of creating laboratories in institutions and
organizations.
7. It can be easily used individually and collaboratively as a component of a teaching model
and method in classroom applications.
8. It provides a safer working environment and data variety by preventing possible data
loss.
9. Interfaces and visual interactions in the structure of it contribute to students' affective and
cognitive development.
In the physics laboratories, whatever method is used, students are expected to use the skills of
observation, hypothesis building and testing, experimenting and making conclusions and
comments based on them in the process of conducting scientific experiments. Steps for
understanding experimental data are to classify, to establish significant relationships and
present them to interested parties. The ability to draw and understand graphics is important
here. Because transforming the recorded data into a graph and identifying the relationship
between variables as a result of analysing the graph is an important step in reaching the end of
the experimental work (Çelik & Pektaş, 2017; Taşar, Kandil-İngeç & Ünlü-Güneş, 2002). It is
very important for individuals to develop the skills of drawing, understanding and interpreting
the graphs which are important in signification of the data. Therefore, this study investigates
the development of these skills in students with CBL and VL activities.
Research purposes
Science laboratories are considered as learning environments where students develop high-
level conceptual learning (Çepni, Kaya, & Küçük, 2005). In the realization of this conceptual
learning, attitude is in the foreground. Attitudes towards science laboratories affect the
efficiency of laboratory training (Palic & Pirasa, 2012). Attitude is also a factor in students'
achievements in science (Gonen, 2008; Osborne, Simon, & Collins, 2003). Studies
investigating the impact of the use of technology products such as computer, timer, sensor and
simulation on the students' attitudes towards the laboratory in science laboratories should
provide more information about the literature. Therefore, the first aim of the study is to
4International Journal of Innovation in Science and Mathematics Education, 27(1), 1-17, 2019
determine whether the difference between the attitudes of the students using CBL applications
and the attitudes of the students who use VL applications is meaningful.
Motivation is another factor that plays an important role in students' learning in science classes
(Bonney, Kempler, Zusho et al., 2005). Motivation is an important factor that influences
students' learning products (Chen, 2001). Motivation, which tries to explain behaviour and
willingness in different activities (Watters & Ginns, 2000), is an effective force for students to
be successful, to study and learn more in school (Martin, 2001). Motivation which has such a
significant place in science is also active in physics laboratories. Therefore, the second aim of
this study is to determine whether the difference between the motivations of the students using
CBL applications and motivations of students using VL applications is significant on learning
science.
Graphs are important tools that express the relationships between many physics concepts.
Therefore, the ability of students to understand and interpret the relationships between variables
in physics concepts directly depends on the degree of comprehension and interpretation of
graphs (Demirci & Uyanık, 2009; Planinic, Milin-Sipus, Katic et al., 2012). Graphical
drawings and diagrams support predicting the physical phenomena and understanding abstract
concepts (Kozhevnikov, Hegarty, & Mayer, 2002). Students encounter difficulty using some
graphics because of their complex structure, such as in the (a) analysis and interpretation of
kinematics graphs representing movement; (b) identification of specific events in velocity-
time, acceleration-time, and location-time graphics; and (c) analysis of deceleration and
acceleration (Şengel & Özden, 2010). Although graphics are used as scientific language in
science classes, research results show that this language is not used effectively by students
(Beichner, 1994). Therefore, VL and CBL applications were used to develop students' skills in
drawing, understanding and interpreting graphics. So, another aim of this study is to determine
whether there is a significant difference between the students using CBL applications in terms
of skills like drawing, understanding and interpreting graphs and the skills of the students using
VL applications.
The question underpinning this research is: “Is there a significant difference between CBL
applications with air rail test set and VL applications with simulation programs in students'
attitudes towards physics laboratory, motivation for science learning and drawing graphs,
comprehension and interpretation skills?” Based on this question, the sub-problems of the
research were determined as follows:
1. Is there a significant difference between the groups in the attitudes of the students towards
the physics laboratory?
2. Is there a significant difference between the groups in the motivation of the students
towards science learning?
3. Is there a significant difference between the groups in the students' ability to draw,
understand and interpret graphics?
Method
A semi-experimental method with pre-test, post-test control group was used in the study. Semi-
experimental method is a design involving the experimental state which places the samples in
control and experiment groups different from a randomly distributed way (Çepni, 2005;
Campbell & Stanley, 1966; Creswell, 2009). Within the scope of the study, experiments were
carried out which are related to the laws of motion and collisions in the Curriculum of General
Physics Laboratory I of the first semester of the Science Teacher Training Program of the
Faculty of Education. The students were divided into two groups. While control group
performed these experiments by using the air rail test set, the experimental group performed
5International Journal of Innovation in Science and Mathematics Education, 27(1), 1-17, 2019
them by using simulation programs. The data of the study were collected via attitude scale
towards science laboratory (SLAS), motivation scale for science learning (SLMS) and graph
drawing, comprehension and interpretation test (GDCIT) (Table 1).
Table 1: Quasi-experimental design with pre-test and post-test control group
Groups pre-test post-test Model used Environment
Experi- VL applications supported by Class (Having a smart
mental simulations board)
SLAS SLMS GDCIT
CBL applications (Air rail
Control Laboratory (with computer)
test set)
Study group
Criteria sampling was used for purposeful sampling methods in this study. The basic of the
criteria sampling method is related to the study of all situations that meet a set of predetermined
criteria. The mentioned criterion can be created by the researcher or a previously prepared
criterion list can be used (Yıldırım & Şimşek, 2008).
In the selection of the study group to participate in the research, the basic criterion was the
students to be the second year students of Science Teacher Training who have succeeded in
General Physics 1 course. In accordance with this basic criterion, study has been carried out on
the basis of volunteerism with 60 students among the 70 students who are studying in the
second grade of education faculty of a university, in Anatolian Turkey. In one of the groups
(control group), experiments related to the laws of motion were carried out with CBL (air rail
test set) while in the other group (experimental group) the same experiments were carried out
with VL applications.
Data collection tools
The tests applied to the groups as pre-test and post-test were attitude scale, motivation scale,
graph drawing, understanding and interpretation test.
SLAS: A 5-point Likert-type scale developed by Nuhoğlu and Yalçın (2004) was used to
determine the students' attitudes towards the laboratory and the effect of the teaching materials
used in the groups on their attitudes. The scale contains 36 items, and 19 of them are positive
and 17 of them are negative. These items were scaled in five categories: "I Participate Totally,
Participate, Undecided, I Do Not Participate, and Never Participate". In the scope of the
research, the reliability of the scale was reapplied, and the reliability coefficient was calculated
as α = 0, 92. After applying the scale, the positive cues were scored as 5, 4, 3, 2, 1 and negative
cues as 1, 2, 3, 4, 5 starting from the category "Totally Participating".
SLMS: The motivation scale developed by Dede and Yaman (2008) was used in order to
determine the motivation level of the students to learn science and to examine the effect of the
teaching materials used in laboratory applications on motivation levels. The response options
of the items in the scale are arranged as "I Participate Totally, Participate, Undecided, I Do Not
Participate, and Never Participate". As the scores were between 1.00 and 5.00, it was accepted
that as the scores got closer to 5.00, the participation level of the students was higher and as
the scores got closer to 1.00 it was lower. Materials with a negative sentence root were reversed
in the scoring phase. It was determined that the developed test tool had a KMO test result of
0.85.
6International Journal of Innovation in Science and Mathematics Education, 27(1), 1-17, 2019
GDCIT: The test developed by Demirci, Karaca and Çirkinoğlu (2006) was used to investigate
the effects of the simulation software used in laboratory applications and the computer aided
air ray test set on the students' ability to draw, understand and interpret graphics. This test as a
whole examines all three sub-skills in one dimension. The test consists of eighteen questions,
nine of which are multiple-choice and nine open-ended. Nine multiple-choice questions from
these questions were applied to the study group and the Cronbach alpha reliability coefficient
of the test was found as α = 0.78.
Planning and implementation phase of laboratory activities
In the study, laboratory applications were carried out within the scope of General Physics I
(mechanical) subjects. The information on experimental activities is given in Table 2.
Experiment manuals containing guidelines for 7 different experiments were distributed to
groups, and students completed experimental activities by working in groups of 4-5 people.
Table 2: Information on laboratory activities performed by students
No Name of the experiment Aim of the experiment
Verification Experiment of Newton's 1st To examine Newton's 1st Law for one
1
Law for Linear Motion dimensional motion
To test the accuracy of Newton's 2nd law for
Application of Newton's 2nd Law on Air
2 one-dimensional smooth accelerating
Rail set
motion.
Draw a time-distance chart for a smooth
Kinetic Energy of an Object
3 accelerating motion. To define kinetic
Accelerating Properly
energy and total energy
Observation of kinetic energy and
4 Flexible Collision in Air Rail Set momentum conservation by flexible
collision
Observation of kinetic energy and
5 Inflexible Collision in Air Rail Set momentum conservation by inflexible
collision
Understanding the relationship between
6 Distance-Velocity Measurements
distance and speed, drawing a graph.
Draw a distance-time graph of a smoothly
7 Distance-Time Measurements
accelerating motion
VL activities
The experimental group students used Interactive Physics simulation program to perform
experiments (www.design-simulation.com/IP/). This simulation and modelling software is an
environment in which almost every physical state can be reconstructed and tracked, and it can
provide excellent visual images with numerical, graphical or vector representations (Graham
& Rowlands, 2000). Interactive physic is software that is widely used in the world that can
easily develop course material without knowing any programming languages. Especially, it can
be used in the field of physics and force-motion issues for creating virtual experiments, problem
solving and modelling. In this software, there are simple operations like creating objects,
moving objects, applying force, changing the values (mass, position, speed and so on) of
7International Journal of Innovation in Science and Mathematics Education, 27(1), 1-17, 2019
objects, measuring quantities (energy, position, speed and so on), drawing graphs, adding
control buttons for variables and adding menu buttons.
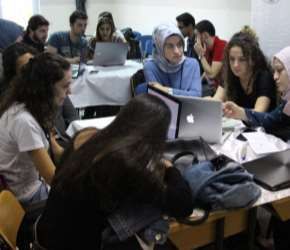
(a) (b)
Figure 1: (a) Students’ studies on VL applications (b) Graphical drawings of motion
experiment with the use of simulation program
The interactive physics program was introduced to the experimental group, and applications
were made during a term. Then, as shown in Fig. 1a, the students were divided into groups of
4-5, and they conducted activities (Table 2) in a collaborative learning environment. Firstly,
students in the groups designed experiments according to the guidelines in the experiment
manuals. In this design carried out on paper, variables, control parameters, measurement
parameters and process steps were determined. Then, a virtual experiment was created by
modelling in the program interface. Measurements were taken as graphical representation or
numerical values by using the relevant buttons and menus on the program. The data were
interpreted, and it was resulted with discussion in the groups. Although these activities were
carried out as group work, the students had also opportunity to use the relevant buttons and
menus individually by taking into account the importance of the students' interaction with the
software. An example of the data generated at the end of the study is given in Fig. 1b.
CBL activities
The CBL system (air rail set) was first introduced to the control group and its working principle
was explained in detail. Then, students were divided into groups of 4-5 students in this study
and the experiments given in Table 2 were performed in groups. One of the most important
features of the experimental set shown in Fig. 2a is the ability to connect to a computer. The
device that provides this connection is called "Sensor-Cassy". Sensor-Cassy is an arrangement
to transfer the movements of the air rail set to the computer. Thus, students can transfer to the
computer the data of the experiment on the air rail, and they have a chance to compare theory
and practice. As seen in Fig. 2a, students in the groups carry out experiments according to the
guidelines in the experiment manuals. First, they set up the experimental setup on the air rail.
Then, they started the movement and transferred the data to the computer via the Sensor-Cassy.
In the meantime, they collected the data at both numerical values form and a graphical
representation. The data were interpreted, and it was resulted with discussion in the groups. As
these activities were carried out as group work, each student in the group was allowed to
perform the installation of the experiment individually. An example data of the study done by
the students is given in Fig. 2b.
8International Journal of Innovation in Science and Mathematics Education, 27(1), 1-17, 2019
(a) (b)
Figure 2: (a) Students’ studies on CBL applications (b) Graphical drawings of motion
experiment with the help of Sensor-Cassy
Analysis of data
Quantitative data from tests and scales were analysed using the SPSS 17 program. Independent
group t-test analyses were used to determine whether there was a meaningful relationship
between scores of attitude scale, motivation scale and graph drawing, comprehension and
interpretation test as pre- and post-test. The significance level between the variables was
accepted as pInternational Journal of Innovation in Science and Mathematics Education, 27(1), 1-17, 2019
Table 4: Attitude scale post-test t test results for the physics laboratory
Groups x N S T SD P(significance)*
Experimental 4.04 30 0.19
0.97 58 0.34
Control 4.37 30 0.28
p* 0.05).
Table 5: Motivation scale for science learning pre-test t-test results
Scale Factors Groups x N S t SD P(significance)*
Experimental 23.66 30 9.82 -
For Research Approach 58 0.65
Control 24.50 30 1.69 0.46
Experimental 19.23 30 2.52 -
For Performance 58 0.08
Control 20.40 30 2.67 1.74
Experimental 16.63 30 1.29 -
For Communication 58 0.14
Control 17.13 30 1.25 1.52
Experimental 13.50 30 2.64 -
For Collaborative study 58 0.11
Control 14.36 30 1.27 1.62
Experimental 11.30 30 1.17 -
For Participation 58 0.63
Control 11.46 30 1.47 0.48
p*International Journal of Innovation in Science and Mathematics Education, 27(1), 1-17, 2019
Table 6: Motivation scale post-test t-test results for learning science
Scale Factors Groups x N S t SD P(significance)*
For Research Experimental 25.30 30 2.38
-0.76 58 0.45
Approach Control 25.70 30 1.62
Experimental 21.20 30 2.31
For Performance -1.08 58 0.28
Control 21.80 30 1.95
For Experimental 18.46 30 2.13
-3.71 58 0.00
Communication Control 20.83 30 2.76
For Collaborative Experimental 14.73 30 2.36
-4.10 58 0.00
study Control 16.87 30 1.59
Experimental 13.10 30 1.60
For Participation -3.91 58 0.00
Control 14.47 30 1.04
p*International Journal of Innovation in Science and Mathematics Education, 27(1), 1-17, 2019
Table 8: Post-test t-test results for Graph Drawing, Understanding and Interpretation
Test
Groups x N S t SD P(significance)*
Experimental 15.83 30 3.09
2.55 58 0.01
Control 17.87 30 3.08
p*International Journal of Innovation in Science and Mathematics Education, 27(1), 1-17, 2019
than VL applications. This can be considered as a result of the effective implementation of
teamwork and cooperation in CBL applications. According to the literature, the students, who
think that the contributions of team members and their interaction add value to their education,
are indicated that they enjoy more and learning occurs with increasing levels of motivation
(Gomez, Wu, & Passerini, 2010). In VL applications, although they work as a group, it can be
considered that the individual interaction of students is not very effective in providing
motivation for communication, cooperation and participation
While a significant difference was found between the post-test scores in favour of the control
group, there was no significant difference between the pre-test scores of the graph drawing,
comprehension and interpretation tests of the study groups. This result suggests that CBL
applications are more effective in the development of students' ability to draw, understand and
interpret graphics than VL applications. The implementation of the CBL experiments requires
students several advantages like real-time data collection and graphical display. Thanks to these
advantages, students can interpret the data in a short time (Amrani & Paradis, 2010). Students
receive instant feedback by the graphics in real time from the displayed data. Rapid
visualization of the data allows modification of experimental parameters within a reasonable
time. These advantages are thought to be beneficial in the development of graphical skills. On
the other hand, when the graphical skills of the experimental group were compared with the
pre-test and post-test point average, it was observed that VL applications also improved the
skills of drawing, understanding and interpreting graphics. The graphical representation of the
interactive physics program used in this study is quite good (Graham & Rowlands, 2000).
Students have converted the virtually obtained data into graphical form using appropriate
buttons and menus. According to the literature, computer simulations are good tools for
improving students' graphic interpretation skills (Sahin, 2006). However, this study shows that
CBL applications are more effective in the development of graphical skills than VL
applications. If the students of experiment group could not learn the simulation program
sufficiently, they could be challenged to design virtual experiments using the software and to
obtain data and graphical representations. Thus, students may have spent most of their time
using the software. In order to avoid such a problem, students should be taught the simulation
program adequately and the practices should be made. In the present study, this process may
be insufficient. On the other hand, it is not considered that this kind of problem has been
encountered in the CBL applications. Students performing CBL experiments did not encounter
any difficulties in using various probes, interfaces and software. Most of the lab time was spent
observing, interpreting, discussing and analysing physical phenomena (Carlson, Igglund, &
Bernhard, 1998). Therefore, it was quite easy to display experimental results, create graphs and
use existing function tools that match the measured values.
Within the scope of the research, university students 'attitude, motivation and graphing,
understanding and interpreting skills in favour of the control group can be related to the
students' interaction with the materials in the learning process. Indeed, the need for a learning
environment to interact with all sense organs is likely to positively affect learning products. In
the study, students performed CBL applications using experimental equipment in real
laboratory environment. Researches have proven that an approach that combines real and
virtual experiences gives the best results. Students should train themselves in practical and
motor skills and gain practical experience with physical equipment to specialize in
experimental procedures and learn science content (De Jong, Linn, & Zacharia, 2013). By
integrating the training technology into the real laboratory environment, students can optimize
their learning (De Jong et al., 2013; Lui & Slotta, 2013). In sum, education technology should
not completely separate students from the real laboratory environment and equipment.
13International Journal of Innovation in Science and Mathematics Education, 27(1), 1-17, 2019
Acknowledgement
This study was supported as Scientific Research Project of Kırıkkale University, coded as 2011/078.
References
Akçayır, M., Akçayır, G., Pektaş, H. M., & Ocak, M. A. (2016). Augmented reality in science laboratories: The
effects of augmented reality on university students’ laboratory skills and attitudes toward science
laboratories. Computers in Human Behavior, 57, 334-342.
Amrani, D., & Paradis, P. (2010). Use of computer-based data acquisition to teach physics laboratories: case
study-simple harmonic motion. Latin-American Journal of Physics Education, 4(3), 511-514.
Azar, A., & Şengüleç, Ö. A. (2011). Computer-Assisted and Laboratory-Assisted teaching methods in physics
teaching: The effect on student physics achievement and attitude towards physics. Eurasian Journal of
Physics & Chemistry Education, 3(1), 43-50.
Beichner, R. J. (1990). The effect of simultaneous motion presentation and graph generation in a kinematics lab.
Journal of Research in Science Teaching, 27(8), 803–815. doi:10.1002/tea.3660270809.
Berrett, D. (2012). How ‘flipping’ the classroom can improve the traditional lecture. The Chronicle of Higher
Education, 12(19), 1-3.
Bonney, C. R., Kempler, T. M., Zusho, A., Coppola, B. P., & Pintrich, P. R. (2005). Student learning in science
classrooms: What role does motivation play? In W.W. Cobern et al. (Eds) Beyond Cartesian dualism (pp.
83-97), Science & Technology Education Library, Vol 29. Springer: Dordrecht.
Bozkurt, E. (2008). Fizik eğitiminde hazırlanan bir sanal laboratuvar uygulamasının öğrenci başarısına
etkisi (Doctoral dissertation, Selçuk Üniversitesi Fen Bilimleri Enstitüsü).
Campbell, D. T., & Stanley, J. C. (1966). Experimental and quasi experimental designs for research. Chicago:
Rand McNally & Company.
Carlson H., Igglund R., & Bernhard J. (1998). Implementing computer based lab work in Physics. International
Conference Practical Work in Science Education, Copenhagen, 20 – 23 May.
Chang, K. E., Chen, Y. L., Lin, H. Y., & Sung, Y. T. (2008). Effects of learning support in simulation-based
physics learning. Computers & Education, 51(4), 1486-1498.
Chen, A. (2001). A theoretical conceptualization for motivation research in physical education: An integrated
perspective. Quest, 53(1), 35-58.
Chen, C. H., & Howard, B. (2010). Effect of live simulation on middle school students' attitudes and learning
toward science. Educational Technology & Society, 13(1), 133–139.
Chiu, J. L., DeJaegher, C. J., & Chao, J. (2015). The effects of augmented virtual science laboratories on middle
school students' understanding of gas properties. Computers & Education, 85, 59-73.
Creswell, J. W. (2009). Research design: Qualitative, quantitative, and mixed methods approaches (3rd ed.).
Thousand Oaks, CA: Sage.
Çelik, H., & Karamustafaoğlu, O. (2016). Science prospective teachers' self-efficacy and views on the use of
information technologies in the teaching of physics concepts. Necatibey Faculty of Education Electronic
Journal of Science & Mathematics Education, 10(1), 182-208.
Çelik, H., & Pektaş, H. M. (2017). Graphic comprehension and interpretation skills of preservice teachers with
different learning approaches in a technology-aided learning environment. International Journal of Science
and Mathematics Education, 15(1), 1-17.
Çepni, S. (2005). Araştırma Ve Proje Çalışmalarına Giriş. İkinci Baskı, Üçyol Kültür Merkezi, Trabzon.
Çepni, S., Kaya, A., & Küçük, M. (2005). Determining the physics teachers’ in-service needs for laboratories. J.
Turkish Educ. Sci, 3(2), 181-194.
Daineko, Y., Dmitriyev, V., & Ipalakova, M. (2017). Using virtual laboratories in teaching natural sciences: An
example of physics courses in university. Computer Applications in Engineering Education, 25(1), 39-47.
Darrah, M., Humbert, R., Finstein, J., Simon, M., & Hopkins, J. (2014). Are virtual labs as effective as hands-on
labs for undergraduate physics? A comparative study at two major universities. Journal of Science
Education and Technology, 23(6), 803-814.
Dede, Y., & Yaman, S. (2008). A questionnaire for motivation toward science learning: A validity and
reliability study. Necatibey Faculty of Education Electronic Journal of Science and Mathematics
Education, 2(1), 19-37.
De Jong, T., Linn, M. C., & Zacharia, Z. C. (2013). Physical and virtual laboratories in science and engineering
education. Science, 340(6130), 305-308.
Demirci, N., Karaca, D., & Çirkinoğlu, A. G. (2006). Üniversite öğrencilerinin grafik anlama ve yorumlamaları
ile kinematik başarıları arasındaki ilişki. VII. Ulusal Fen Bilimleri ve Matematik Eğitimi Kongresi, Gazi
Üniversitesi, Gazi Eğitim Fakültesi, 7-9.
Demirci, N., & Uyanık, F. (2009). The correlation between tenth grade students’ understanding and interpreting
graphs and their kinematics achievement. Necatibey Faculty of Educ. Elect. J. Sci. Math. Educ, 3(2), 22-51.
14International Journal of Innovation in Science and Mathematics Education, 27(1), 1-17, 2019
Duman, M. Ş., & Avcı, G. (2016). Sanal laboratuvar uygulamalarının öğrenci başarısına ve öğrenilenlerin
kalıcılığına etkisi. Erzincan Üniversitesi Eğitim Fakültesi Dergisi, 18(1), 13-33.
Finkelstein, N. D., Perkins, K. K., Adams, W., Kohl, P., & Podolefsky, N. (2004). Can computer simulations
replace real equipment in undergraduate laboratories? Department of Physics: University of Colorado,
Boulder.
Gomez, E. A., Wu, D., & Passerini, K. (2010). Computer-supported team-based learning: The impact of
motivation, enjoyment and team contributions on learning outcomes. Computers & Education, 55(1), 378-
390.
Gonen, S. (2008). A study on student teachers' misconceptions and scientifically acceptable conceptions about
mass and gravity. Journal of Science Education and Technology, 17(1), 70-81.
Graham, T., & Rowlands, S. (2000). Using computer software in the teaching of mechanics. International
Journal of Mathematical Education in Science and Technology, 31(4), 479-493.
Gunhaart, A., & Srisawasdi, N. (2012). Effect of integrated computer-based laboratory environment on students'
physics conceptual learning of sound wave properties. Procedia-Social and Behavioral Sciences, 46, 5750-
5755.
Jaakkola, T., & Nurmi, S. (2008). Fostering elementary school students’ understanding of simple electricity by
combining simulation and laboratory activities. Journal of Computer Assisted Learning, 24(4), 271-283.
Jaakkola, T., Nurmi, S., & Veermans, K. (2011). A comparison of students’ conceptual understanding of electric
circuits in simulation only and simulation-laboratory contexts. Journal of Research in Science Teaching,
48(1), 71–93.
Jimoyiannis, A., & Komis, V. (2001). Computer simulations in physics teaching and learning: A case study on
students’ understanding of trajectory motion. Computers and Education, 36(2), 183–204.
Kaberman, Z., & Dori, Y. J. (2009). Question posing, inquiry and modeling skills of chemistry students in the
case-based computerized laboratory environment. International Journal of Science and Mathematics
Education, 7, 597-625.
Klahr, D., Triona, L. M., & Williams, C. (2007). Hands on what? The relative effectiveness of physical versus
virtual materials in an engineering design project by middle school children. Journal of Research in Science
Teaching, 44(1), 183-203.
Kozhevnikov, M., Hegarty, M. & Mayer, R. (2002). Spatial abilities in problem solving in kinematics. In M.
Anderson, B. Meyer & P. Olivier (Eds.), Diagrammatic representation and reasoning (pp. 155–171).
London, England: Springer.
Liu, C., Wu, C., Wong, W., Lien, Y. & Chao, T. (2017). Scientific modeling with mobile devices in high school
physics labs. Computers and Education, 105, 44-56.
Lui, M. & Slotta, J. D. (2013). Exploring evolutionary concepts with immersive simulations. In N. Rummel, M.
Kapur, M. Nathan, & S. Puntambekar (Eds.) (2013). To See the World and a Grain of Sand: Learning across
Levels of Space, Time, and Scale: CSCL 2013 Conference Proceedings Volume 1 - Full Papers &Symposia.
International Society of the Learning Sciences. pp. 304-311.
Martin, A. J. (2001). The student motivation scale: A tool for measuring and enhancing motivation. Australian
Journal of Guidance and Counselling, 11, 11-20.
Moser, S., Zumbach, J., & Deibl, I. (2017). The effect of metacognitive training and prompting on learning
success in simulation-based physics learning. Science Education, 101(6), 944-967.
Mcdonald, C. V. (2016). STEM education: A review of the contribution of the disciplines of science,
technology, engineering and mathematics', Science Education International, 27, 4, 530-569.
Mottmann, J. (1999). Innovations in physics teaching. The Physics Teacher, 37, 74-77.
Nuhoğlu, H., & Yalçın, N. (2004). The development of attitude scale for physics laboratory and the assessment
of pre-service teachers’ attitudes towards physics laboratory. Gazi University Kırsehir Faculty of Education
Journal, (5), 317-327.
Olympiou, G., & Zacharias, Z. (2013). Making the invisible visible: Enhancing students' conceptual
understanding by introducing representations of abstract objects in a simulation. Instructional Science, 41(3),
575-596.
Osborne, J., Simon, S., & Collins, S. (2003). Attitudes towards science: A review of the literature and its
implications. International Journal of Science Education, 25(9), 1049-1079.
Palic, G., & Pirasa, N. (2012). A study of pre-service teachers' tendency for imprudent behaviour and physics
laboratory attitudes. Procedia-Social and Behavioral Sciences, 47, 823-828.
Planinic, M., Milin-Sipus, Z., Katic, H., Susac, A., & Ivanjek, L. (2012). Comparison of student understanding
of line graph slope in physics and mathematics. International Journal of Science and Mathematics
Education, 10(6), 1393-1414.
Rios, J., & Madhavan, S. (2000). Guide to adopting technology in the physics classroom. The Physics Teacher,
38, 94-97.
15International Journal of Innovation in Science and Mathematics Education, 27(1), 1-17, 2019
Russell, D. W., Lucas, K. B., & McRobbie, C. J. (2004). Role of the microcomputer-based laboratory display in
supporting the construction of new understandings in thermal physics. Journal of Research in Science
Teaching, 41(2), 165-185.
Rutten, N., Van Joolingen, W. R., & Van der Veen, J. T. (2012). The learning effects of computer simulations in
science education. Computers and Education, 58, 136–153.
Rutten, N., Van der Veen, J. T., & Van Joolingen, W. R. (2015). Inquiry-based whole-class teaching with
computer simulations in physics. International Journal of Science Education, 37(8), 1225–1245.
Sahin, S. (2006). Computer simulations in science education: Implications for distance education. Online
Submission, 7(4).
Sarı, U., & Güven, G. B. (2013). The effect of interactive whiteboard supported inquiry- based learning on
achievement and motivation in physics and views of prospective teachers towards the instruction. Necatibey
Faculty of Education Electronic Journal of Science and Mathematics Education, 7(2), 93–125.
Sarı, U., Hassan, A. H., Güven, K., & Şen, Ö. F. (2017). Effects of the 5E teaching model using interactive
simulation on achievement and attitude in physics education. International Journal of Innovation in Science
and Mathematics Education (formerly CAL-laborate International), 25(3), 20-35.
Smetana, L. K., & Bell, R. L. (2012). Computer simulations to support science instruction and learning: A
critical review of the literature. International Journal of Science Education, 34(9), 1337-1370.
Steinberg, R. (2003). Effect of computer-based laboratory instruction on future teachers’ understanding of
nature of science. Journal of Computers in Mathematics and Science Teaching, 22, 185-205.
Şengel, E., & Yaşar Özden, M. (2010). The effects of computer simulated experiments on high school students'
understanding of the displacement and velocity concepts. Eurasian Journal of Educational Research
(EJER), (39).
Taşar, M. F., Kandil-İngeç, S., & Ünlü-Güneş, P. (2002). Grafik çizme ve anlama becerisinin saptanması
[Measuring students’ skills of drawing and understanding graphs]. Poster session presented at the Fifth
National Congress of Science and Mathematics Education. Ankara, Turkey: Middle East Technical
University.
Thornton, R. C., & Sokoloff, D. R. (1990). Learning motion concepts using real-time microcomputer-based
laboratory tools. Am. J. Phys., 58, 858-867.
Tortosa, M. (2012). The use of microcomputer based laboratories in chemistry secondary education: Present
state of the art and ideas for research-based practice. Chemistry Education Research and Practice, 13(3),
161-171.
Trumper, R., & Gelbman, M. (2000). Investigating electromagnetic induction trough a minicomputer-based
laboratory, Phy. Educ., 35, 90-95.
Trundle, K. C., & Bell, R. L. (2010). The use of a computer simulation to promote conceptual change: a quasi-
experimental study. Computers & Education, 54(4), 1078-1088.
Ulukök, Ş., Çelik, H., & Sarı, U. (2013). The effects of computer-assisted instruction of simple circuits on
experimental process skills. Journal of Theoretical Education Science, 6(1), 77–101.
Uşun, S. (2004). Bilgisayar destekli öğretimin temelleri [Foundations of computer assisted instruction]. Ankara,
Turkey: Nobel Yayıncılık.
Ünlü, Z. K., & Dökme, İ. (2011). The effect of combining analogy-based simulation and laboratory activities on
Turkish elementary school students’ understanding of simple electric circuits. Turkish Online Journal of
Educational Technology, 10(4), 320–329.
Yaşar, Ş., & Anagün, Ş. S. (2008). İlköğretim beşinci sınıf fen ve teknoloji dersi tutum ölçeğinin güvenirlik ve
geçerlik çalışmaları. Anadolu Üniversitesi Sosyal Bilimler Dergisi, 8 (2), 223-234.
Yıldırım, A., & Şimşek, H. (2008). Nitel araştırma yöntemleri.(7. Baskı). Ankara: Seçkin Yayıncılık.
Watters, J. J., & Ginns, I. S. (2000). Developing motivation to teach elementary science: Effect of collaborative
and authentic learning practices in preservice education. Journal of Science Teacher Education, 11(4), 301-
321.
Wiesner, T. F., & Lan, W. (2004). Comparison of student learning in physical and simulated unit operations
experiments. Journal of Engineering Education, 93, 195-204.
Wu, W., Chang, H. P., & Guo, C. J. (2009). The development of an instrument for a technology-integrated
science learning environment. International Journal of Science and Mathematics Education, 7(1), 207–233.
doi:10.1007/s10763-007-9116-5.
Zacharia, Z. C. (2003). Beliefs, attitudes, and intentions of science teachers regarding the educational use of
computer simulations and inquiry-based experiments in physics. Journal of Research in Science Teaching,
40(8) 792–823.
Zacharia, Z. C. (2007). Comparing and combining real and virtual experimentation: An effort to enhance
student’s conceptual understanding of electric circuits. Journal of Computer Assisted Learning, 23(2), 120–
132.
16International Journal of Innovation in Science and Mathematics Education, 27(1), 1-17, 2019
Zhang, X., De Pablos, P. O., & Xu, Q. (2014). Culture effects on the knowledge sharing in multi-national virtual
classes: A mixed method. Computers in Human Behaviour, 31, 491-498.
17You can also read