2019 E-Expectations Trend Report - How to Amplify Digital Engagement of High School Students During the College Search Process - Enrollment Management
←
→
Page content transcription
If your browser does not render page correctly, please read the page content below

ENROLLMENT

 2019 E-Expectations®
        Trend Report
		   How to Amplify Digital Engagement
     of High School Students During the
                College Search Process

                            ENROLLMENT
INTRODUCTION
           The high school students you want to recruit spend nine hours a day on their digital devices.1
           That’s four times the average time they spend doing homework,2 twice the average time spent
           on daily extracurricular activities, and even more than the average 8.5 hours they spend sleeping.3
           In fact, almost half of teens report that they’re online almost constantly.4

           These startling statistics confirm what higher education marketers and administrators have
           witnessed in recent years: digital engagement is the most important strategy for engaging
           Generation Z.

           But what are the right solutions and strategies to maximize your engagement with this crucial target
           market? Which approaches align with the expectations of the students you are trying to reach? And
           more importantly, how can you make your institution’s unique brand stand out in a technological
           sea of messages?

           The 2019 E Expectations® Trend Report will help you answer these questions with insightful data
           about the digital habits of high school sophomores, juniors, and seniors. This extensive report
           identifies new preferences related to college search and answers key questions such as:

                         What search terms do students use                                   What are teens’ attitudes about images
                         when looking for colleges online?                                   and videos on college websites?

                         How do teens feel about artificial                                  What are the preferred methods
                         intelligence (AI) on websites such                                  of communication for sophomores,
                         as automated chats?                                                 juniors, and seniors?

                         Do teens conduct voice-activated                                    How involved do parents continue
                         online search—and how?                                              to be in the college search process?

                   ABOUT THE 2019 STUDY
                   NEW FOR 2019                                BASED ON
                   Survey data from
                   sophomores
                                                               900
                                                               participants                      PLEXUSS provided
                                                                                                 a survey list of 25,000
                                                                                                 sophomores, juniors,
                   26%                       37%                       37%                       and seniors for this study.
                   SENIORS                   JUNIORS                   SOPHOMORES

           1
               Common Sense Media (2015). U.S. teens use an average of nine hours of media per day.
           2
               ICAN Education (2017). How much time should be spent on homework based on grade?
           3
               Bureau of Labor Statistics (2016). American time use survey.
           4
               Pew Research Center (2018). Teens, social media, & technology 2018.

© 2019 Ruffalo Noel Levitz | 2019 E-Expectations® Trend Report		              			                         			                         2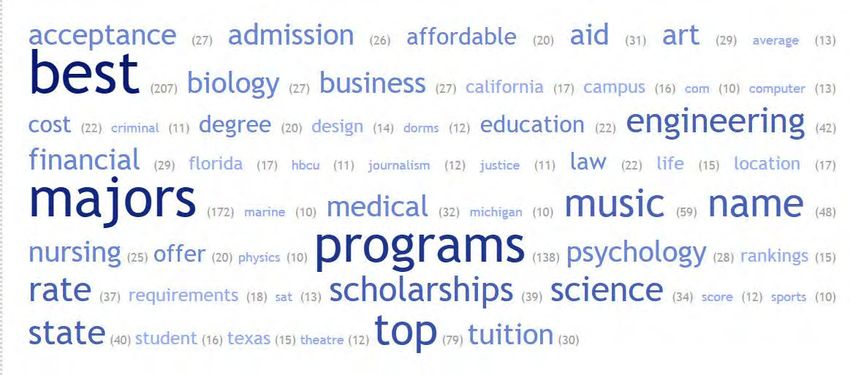
ENROLLMENT

           MOST INFLUENTIAL RESOURCES
           Most influential resources students use for college search

                     FACT: Students at all class levels take a multichannel approach to college search. They
                     typically visit the website first, but complement their search with information from email,
                     social media, video, and texts.

           MOST INFLUENTIAL INFORMATION RESOURCES
           (1-5 scale, 5=most influential, sorted by 2019 juniors)

                                                                       2019      2018      2019        2018        2019
              RESOURCE                                               SENIORS   SENIORS   JUNIORS     JUNIORS   SOPHOMORES

              College's website                                       4.09      4.02      4.04        4.16        4.06

              Results from a financial aid or
                                                                      3.72      4.05      3.95         3.9        3.96
              scholarship calculator

              Phone calls from admissions counselors                  3.44      3.14      3.85        3.49        3.93

              Email from a particular school                          3.51      3.73      3.76        3.73        3.81

              Texts or live messages from admissions counselors       3.49      3.03      3.73        3.37        3.92

              Videos of campus, classrooms, students,
                                                                      3.63      3.31      3.67        3.33        3.76
              residence halls

              College planning website                                3.29      2.99      3.58        3.46        3.64

              Virtual reality videos                                  3.35      2.57      3.57        2.73        3.57

              Printed brochures about the school                      3.25      3.27      3.54        3.49        3.58

              Virtual tours                                           3.27      2.95      3.37        3.03        3.5

              Social media posts                                      2.99       2.6      3.08        2.87        3.11

              Rankings found in magazines                             3.12      2.93      3.06        3.02        3.32

           KEY TAKEAWAYS
                          CONTINUE CALLING AND TEXTING—THEIR INFLUENCE CONTINUES
                          Text messaging and calls from counselors are becoming more influential in the
                          decision-making processes for juniors and sophomores.

                          INCORPORATE MORE OUTCOMES-FOCUSED INFORMATION
                          Statistics that show salaries attained by recent graduates was the fourth highest-rated
                          influencer.

                          CONSIDER VIRTUAL REALITY (VR) AS ITS USE IS GROWING
                          VR videos had the biggest gain in influence than any other communication method
                          between the 2018 and 2019 studies. Campuses may want to consider moving into VR
                          videos as a way to engage students about campus life and learning.

© 2019 Ruffalo Noel Levitz | 2019 E-Expectations® Trend Report		      			                    			                         3
INQUIRING ABOUT COLLEGE                                                                  FACT: Inquiring about
                                                                                                    majors or programs of study
           When students want to learn
                                                                                                    is the most popular reason
           more, what are their preferred                                                           for contacting a campus.
           ways to reach out?

           By a large margin, most students start with a form on a school’s website to
           get more information.
           HOW STUDENTS WILL CONTACT AN INSTITUTION

              ACTION                                                                      OVERALL   SENIORS    JUNIORS   SOPHOMORES

              I fill out a form on the school’s website to get more information            76%        72%       81%         75%

              I list the school when I fill out the PSAT, SAT, or ACT forms                54%       65%        58%         38%

              I use college planning sites                                                 49%        38%       53%         59%

              I email the school                                                           46%        63%       29%         43%

              I schedule a visit to the campus                                             40%        59%       41%         18%

              I respond to brochures or letters I get in the mail from specific schools    39%        32%       34%         54%

              I complete a cost or scholarship calculator form online                      28%       40%        17%         27%

              I call the school                                                            13%        25%        7%         4%

              I fill out a form on the athletics page of the website                        8%        6%         5%         13%

              My parent(s) or guardian(s) contact schools for me                            4%        4%         2%         5%

           KEY TAKEAWAYS
                           MAKE IT EASY FOR STUDENTS TO FIND AND ENGAGE WITH YOUR REQUEST FOR
                           INFORMATION FORM
                           Given their keen interest in academic programs and majors, be sure to highlight the
                           request for information form as a key call to action on these pages.

                           HELP SENIORS TO PLAN A VISIT
                           Seniors are more likely to plan a campus visit (24 percent compared to only 4 percent
                           of juniors and 2 percent of sophomores).

                           PROVIDE MULTIPLE WAYS TO INTERACT
                           Students use website forms the most, so make them easy to find on your website. Also
                           provide other channels to communicate such as texts, emails, chats, and even snail mail.

© 2019 Ruffalo Noel Levitz | 2019 E-Expectations® Trend Report		                  			                       			                   4
ENROLLMENT

           REQUEST FOR INFORMATION (RFI) FORMS
           TMI is a turnoff
           Results show that students stop completing RFI forms when too much information is required.
           In other words, keep it simple.

                     FACT: Best way to respond to an RFI? Seniors say “text me.” Juniors want an email,
                     and sophomores want brochures.

           When forms are easy to follow, students will provide most of the
           information a school requires.
           HAVE STUDENTS STOPPED FILLING OUT A FORM BECAUSE IT ASKED
           FOR TOO MUCH INFORMATION?

                               OVERALL                  SENIORS    JUNIORS             SOPHOMORES
              YES              40%                      47%        34%                 38%

© 2019 Ruffalo Noel Levitz | 2019 E-Expectations® Trend Report		   			                 			                5
INFORMATION STUDENTS ARE WILLING TO SHARE WITH INSTITUTIONS
ACTION OVERALL SENIORS JUNIORS SOPHOMORES
Name 96% 94% 95% 99%
Mailing address 90% 91% 85% 95%
Email address 98% 99% 98% 96%
Cell phone 77% 79% 78% 73%
Home phone 31% 37% 31% 25%
Parent email 57% 54% 69% 46%
Parent phone 42% 41% 53% 32%
High school 82% 81% 80% 85%
Programs you're considering 89% 91% 90% 86%
Career aspirations 72% 63% 78% 77%
How you learned about the school 62% 68% 61% 57%
Preferences for future communication 56% 54% 61% 54%
Opt in for text messages 39% 47% 39% 29%
I wouldn't share any personal information 1% 0% 2% 0%
BEST WAY FOR COLLEGES TO GET BACK TO STUDENTS AFTER SUBMITTING A FORM
DESIRED RESPONSE OVERALL SENIORS JUNIORS SOPHOMORES
Send brochures in the mail 63% 43% 65% 86%
Send an email with recommendations for next steps and links to
61% 52% 72% 61%
other online resources
Have an admissions counselor email me 56% 50% 61% 57%
Text me 46% 54% 44% 38%
Show me confirmation screen with recommendations for next
29% 31% 26% 29%
steps and links to other online resources
Call me 17% 25% 18% 5%
Message me through an app 11% 7% 7% 18%
Connect me with someone on campus through a live chat tool 7% 7% 5% 7%
© 2019 Ruffalo Noel Levitz | 2019 E-Expectations® Trend Report 6ENROLLMENT
KEY TAKEAWAYS
KEEP IT SHORT
To get as many completed RFI forms as possible, make your form requirements streamlined and simple.
RESPOND OVER MULTIPLE CHANNELS
The desired response results show that students like to receive responses across a variety of digital
and traditional channels.
MEETING WITH ADMISSIONS COUNSELORS
How many counselors do students meet with, and what steps do
they take after?
There are many ways for students to demonstrate interest in a college or university. They can meet
admissions counselors in person when the counselors visit their high school, or they can reach out
via phone, Skype call, or live chat. Face-to-face meetings are the gold standard for most seniors, just
over half of the juniors, and a third of sophomores in this study.
HOW MANY MEETINGS DO STUDENTS HAVE WITH
ADMISSIONS COUNSELORS?
1 or 2
Seniors 44%
Juniors 53%
Sophomores 73%
FACT:
3 or 4
60% Seniors 31%
of seniors
Juniors 28%
51% Sophomores 12%
of juniors,
and
5+
25%
31% Seniors
of sophomores Juniors 20%
met admissions
counselors Sophomores 15%
© 2019 Ruffalo Noel Levitz | 2019 E-Expectations® Trend Report 7The actions students take after meeting with an admissions counselor
shed light on the path to admission.
ACTION AFTER MEETING WITH ADMISSIONS REPRESENTATIVE AT HIGH SCHOOL
ACTION OVERALL SENIORS JUNIORS SOPHOMORES
Went to the website 71% 73% 69% 69%
Filled out a form to get more information 61% 58% 67% 58%
I looked at application requirements 52% 56% 56% 39%
I told my parents about the school 48% 44% 51% 50%
I looked at their social media sites (like Snapchat, Instagram,
38% 31% 39% 50%
Twitter, Facebook, or YouTube)
I applied for admission 29% 58% 10% 4%
I watched videos on the site 21% 23% 18% 23%
I registered for an open house or planned a visit 20% 25% 21% 12%
KEY TAKEAWAYS
DRAW ON THE INSIGHTS OF YOUR ADMISSIONS COUNSELORS
Because your counselors speak one-on-one with prospects, they have intimate
knowledge about how students think and what they are looking for in the college
admissions process. Their insights are invaluable when looking for ways to keep your
website and other marketing channels fresh and relevant.
CREATE CLEAR CALLS TO ACTION AFTER A MEETING
Students will take many different types of actions after a meeting with a counselor,
so direct them to the paths that will increase their engagement and keep them
communicating with you.
EXPERIMENT WITH SPECIFIC LANDING PAGES FOR HIGH SCHOOLS
OR COUNSELORS
Given students’ high likelihood of visiting your website after a counselor visits their
school, experiment with providing unique landing pages that correspond to their
school or your counselor to aid in tracking and engagement.
© 2019 Ruffalo Noel Levitz | 2019 E-Expectations® Trend Report 8ENROLLMENT
APPLICATIONS
Comparing the Common Application with the Coalition Application
The Common Application makes it easy for students to apply to multiple institutions because it allows
them to enter information only once and then auto-populate fields in various applications. It also allows
students to keep track of their applications on one website. The Common Application is now used by
more than 800 institutions. It is free to complete, but most institutions charge a fee to apply.
The Coalition Application was introduced in 2016 as a way to curtail perceived bias against
low-income students by removing barriers created by the language and semantics of the Common
Application. The Coalition Application is also free to complete and includes additional resources
and tools for students to use during the college application process, as well as a locker for storing
documents in the cloud. It is currently used by more than 130 institutions, most of which also require
a fee. Has the introduction of this second application option changed how students apply to college?
FACT:
Average number of applications students submit:
CURRENTLY APPLYING HAVE APPLIED TO
(AVERAGE) (AVERAGE)
6.45 6.74
Which application have students used?
COMMON COALITION NOT HAVE NOT
APPLICATION APPLICATION SURE USED
55% 14% 14% 29%
KEY TAKEAWAYS
OFFER CLEAR AND EASY-TO-FIND DIRECTIONS FOR YOUR APPLICATION OPTIONS
AND PROCESS
Students want to understand the process of applying before they begin.
Regardless of your application options, be sure they have access to instructions
and opportunities to engage with your team.
PROVIDE MULTIPLE PATHWAYS FOR APPLYING
As students become more aware and more schools join, the Coalition Application may
increase in popularity. If you are not yet signed up to offer the Coalition Application,
you may want to consider it, as one in 10 applicants are currently using it.
KEEP RECRUITING AFTER APPLICATIONS
It’s important to qualify applicants by offering them multiple paths to engage. Since
many apply to a half-dozen schools or more, you want to give them lots of ways to
further explore their interests and engage with potential mentors and peers so they
continue toward enrolling.
© 2019 Ruffalo Noel Levitz | 2019 E-Expectations® Trend Report 9PARENT INVOLVEMENT
Parents are involved at some level with the majority of students
FACT:
6 out of 10 students
say their parents are engaged during the college search process,
similar to our 2018 E-Expectations study.
Have parents done anything to help students review college options?
SENIORS JUNIORS SOPHOMORES
YES 62% 66% 62% 58%
KEY TAKEAWAYS
GIVE PARENTS A PATH FOR EXPLORATION AND INTERACTION
Make sure to have communication streams and engagement opportunities for parents
so they can become advocates for enrollment at your institution. Give them an
opportunity to identify themselves as parents on your request for information or visit
registration forms.
© 2019 Ruffalo Noel Levitz | 2019 E-Expectations® Trend Report 10ENROLLMENT
EMAIL
Email continues to be the preferred way to communicate with colleges
Students remain comfortable using email as a communication tool, especially as they get closer
to the application process. It shows they’re serious and want to start a conversation.
But, students also show that they prefer emails with visual elements to them.
FACT:
of students are willing to share
98% their email address with you.
Design matters
Emails that include compelling graphics win out over the text-only option.
WHICH EMAIL DESIGN APPEALED MOST TO STUDENTS?
47% 46% 7%
Each of these emails used the same amount
of students use email
of text, but students clearly preferred the
two that incorporated images and graphics 96% at least one per week.
to accentuate the message.
WHAT MOTIVATES STUDENTS TO OPEN YOUR EMAILS?
Overall Seniors Juniors Sophomores
76% 70% 73% 79% 46% 41% 33% 36% 28% 16% 8% 6% 3% 3%
73% 86% 78% 62% 50% 47% 31% 33% 33% 35% 8% 11% 3% 2%
I’m curious I’m The subject I’ve opened They used My parents I don’t open
to learn interested in line caught messages my name are emails from
more about enrolling at my attention. from this in the encouraging college or
this school. this school. school before subject line. me to open universities.
and they email from
were useful. the school.
© 2019 Ruffalo Noel Levitz | 2019 E-Expectations® Trend Report 115 key email insights from the 2019 results
Half of students will contact an institution via email.
1 46% overall: 63% seniors | 29% juniors | 43% sophomores
Email is a preferred response after requesting information.
2 After prospects fill out an RFI, they prefer:
Email with next steps and links Email from admissions counselor
61% overall: 56% overall:
52% seniors | 72% juniors | 61% sophomores 50% seniors | 61% juniors | 57% sophomores
Email is an influential resource.
3 Power of email to provoke interest in school (1-5 scale, 5=most influential)
3.71 overall: 3.51 seniors | 3.76 juniors | 3.81 sophomores
Email is one of the primary paths to a college website.
4 “I link to the website from an email message.”
51% overall: 48% seniors | 52% juniors | 53% sophomores
Email makes it personal.
5 “I like seeing my name and interests included in emails and brochures.”
66% overall: 55% seniors | 71% juniors | 53% sophomores
KEY TAKEAWAYS
KEEP EMAIL MARKETING A PRIORITY
Follow best practices with email: test subject lines, use personalization, and version
your messages by student segments. Almost anything you can do with this channel
to increase its effectiveness will pay off in measurable ways.
FOLLOW SUBMISSIONS OF REQUESTS FOR INFORMATION WITH EMAILS
Six out of 10 students said that is how they want to hear back from institutions after
submitting an RFI form. Make sure your email provides clear calls to action to keep
students engaged.
GET VISUAL
Students clearly prefer emails with a visual component. Use images and video to add
more visual appeal so they will read, react, and respond.
© 2019 Ruffalo Noel Levitz | 2019 E-Expectations® Trend Report 12ENROLLMENT
TEXTING
Texting surges in popularity
The ubiquity of smartphones makes texting one of the easiest ways to get messages in front of
students. It is especially effective for getting news to prospects about their applications, and it is a
great tool for getting the conversation started and keeping it going.
BEST USES FOR TEXT MESSAGING:
POST-APPLICATION STATUS TEXTING, A GREAT TOOL
FOR PROSPECTING
DEADLINE REMINDERS
Among students, 67 percent
SCHOLARSHIP AVAILABILITY of juniors and 51 percent
of sophomores are open to
ACCEPTANCE NOTIFICATIONS receiving general information
about academic programs and
CAMPUS EVENTS
majors through texts.
CHECK-INS WITH ADMISSIONS COUNSELORS
TEXT FORMAT PREFERENCES
FORMAT OVERALL SENIORS JUNIORS SOPHOMORES
Only text (SMS) messages 37% 49% 32% 29%
Only messaging apps 8% 1% 5% 17%
Both text and messaging apps are OK 41% 38% 43% 42%
No text or messaging app contact at all 14% 12% 19% 12%
WHEN DO STUDENTS SAY THEY WANT TO BE TEXTED?
TIMING OVERALL SENIORS JUNIORS SOPHOMORES
Before submitting application 50% 35% 63% 51%
After submitting application 67% 75% 60% 65%
After being admitted 59% 74% 45% 58%
After registering for first semester 40% 38% 42% 40%
After deciding to attend elsewhere 7% 9% 5% 7%
© 2019 Ruffalo Noel Levitz | 2019 E-Expectations® Trend Report 13KEY TAKEAWAYS
MAKE TEXTING PART OF YOUR MULTICHANNEL OUTREACH
Adding text messaging to your communication flows gives you another way to keep
students engaged and drive them to next steps in the enrollment process.
ADJUST TEXT STRATEGY FOR YOUR AUDIENCE
Seniors want a text after they apply or are admitted. Juniors and sophomores are more
open to texting before applying.
TEXT OFTEN, BUT DON’T BE INTRUSIVE
Only text if you have a significant piece of information to communicate: milestones like
application follow-up, admission notice, financial aid announcements, and important events.
SOCIAL MEDIA
Share your story in pictures—students increasingly conduct
college search via visual social media
A Pew Research Center study found that teen social media use is moving away from Facebook and
toward visually dominant platforms such as Instagram, Snapchat, and YouTube.5 E-Expectations research
has shown this as well, as Facebook has also fallen to the fourth most-used social media platform on a
daily basis. However, it remains the second highest-rated social media tool for college search.
This shift in popularity toward more visual forms of social media channels shows that, regardless of the
digital format, the power of images and videos is undeniable—especially when illustrating campus life for
prospective students. Colleges and universities need to increase their expertise at visual storytelling.
FACT: The percentage of 2019 seniors watching a live streaming event
(32 percent) was almost double the percentage in 2018 (17 percent).
TYPES OF SOCIAL MEDIA POSTS STUDENTS FIND MOST INTERESTING
PHOTOS VIDEOS NEW! STUDENT SOCIAL
MEDIA TAKEOVERS
67% 76% 59% 49%
overall juniors seniors overall 45%
(11% DROP COMPARED overall
TO 2018)
5
Pew Research Center (2018). Teens, social media, & technology 2018
© 2019 Ruffalo Noel Levitz | 2019 E-Expectations® Trend Report 14ENROLLMENT
HOW/WHEN ARE SOCIAL MEDIA SITES MOST HELPFUL?
63% 48% 25% 15% 21%
to learn after seeing after visiting after after being
more about the website, campus applying accepted
the school print, or inquiry
MORE USEFUL FOR JUNIORS MORE USEFUL FOR SENIORS
SOCIAL MEDIA: BEST FOR COLLEGE RESEARCH VS. DAILY USE
Seniors Daily Use: 74% Seniors Daily Use: 30%
Seniors Best for Research: 39% Seniors Best for Research: 20%
Juniors Daily Use: 85% Juniors Daily Use: 31%
Juniors Best for Research: 50% Juniors Best for Research: 16%
Instagram Twitter
Sophomores Daily Use: 77% Sophomores Daily Use: 37%
Sophomores Best for Research: 50% Sophomores Best for Research: 17%
Seniors Daily Use: 51% Seniors Daily Use: 75%
Seniors Best for Research: 42% Seniors Best for Research: 15%
Juniors Daily Use: 53% Juniors Daily Use: 83%
Juniors Best for Research: 49% Juniors Best for Research: 15%
Facebook Snapchat
Sophomores Daily Use: 49% Sophomores Daily Use: 66%
Sophomores Best for Research: 36% Sophomores Best for Research: 8%
Seniors Daily Use: 69%
Seniors Best for Research: 44%
Juniors Daily Use: 72%
Juniors Best for Research: 37%
YouTube
Sophomores Daily Use: 71%
Sophomores Best for Research: 43%
© 2019 Ruffalo Noel Levitz | 2019 E-Expectations® Trend Report 15TOP 10 MOST INTERESTING TOPICS ON SOCIAL MEDIA 2018-19
(note: ordered by responses from 2019 juniors)
2019 2018 2019 2018
TOPIC SENIORS SENIORS JUNIORS JUNIORS
1 What it's like to live on campus in the dorms 84% 60% 73% 64%
2 What social life is like on campus 71% 63% 68% 66%
3 What qualifications I need to have to be accepted 36% 45% 65% 62%
4 What it will be like to be in classes 67% 57% 58% 64%
5 How I'll pay for college 42% 55% 58% 58%
6 What my path to finding a career will be 42% 44% 50% 56%
7 What I need to do to apply 32% 45% 49% 57%
8 What internships might be a part of my academic program 45% 49% 47% 59%
9 What the other students are like as people 39% 47% 42% 40%
10 What events I can attend 42% 51% 42% 51%
KEY TAKEAWAYS
DRIVE SOCIAL MEDIA CONTENT VISUALLY
Social media has increasingly become a visual medium for students, so it is critical
for campuses to post content that uses images, videos, and other visuals to engage
students and convey key information.
INCREASE INTERACTION VIA STUDENT SOCIAL MEDIA TAKEOVERS
More and more schools are embracing this tactic and its potential for authenticity.
Choose your ambassadors carefully, however, and be sure they are ready to respond
in a way that aligns with your brand.
SHOW ALL SIDES OF CAMPUS LIFE
Compared to the 2018 E-Expectations study, 25 percent more seniors are previewing
dorms and campus life. Give them pros and cons for choosing living learning
communities, one dorm style over another, and even the benefits of living on campus
as compared to living off campus.
© 2019 Ruffalo Noel Levitz | 2019 E-Expectations® Trend Report 16ENROLLMENT
PAID INTERACTIVE MEDIA
Long live the banner ad
FACT: Prospects are clicking on more paid ads than ever.
SENIORS JUNIORS
63% in 2019 compared 64% in 2019 compared
to 41% in 2018 to 45% in 2018
Banner ads show a marked increase in response in this year’s study, and the site where they get
clicked on most is Facebook.
SITES WHERE STUDENTS CLICKED ON SOCIAL MEDIA ADS IN 2019
SITE SENIORS JUNIORS TRENDS SINCE 2018
Seniors: up from 50%
Facebook 62% 62%
Juniors: up from 26%
Instagram 27% 43% No 2018 data
Seniors: down from 56%
Google Search 44% 41%
Juniors: down from 68%
Seniors: up from 28%
YouTube 31% 33%
Juniors: up from 30%
Seniors: down from 37%
Other social media or blog posts 22% 24%
Juniors: down from 34%
Seniors: down from 25%
Display ad on website 20% 21%
Juniors: down from 26%
TOP 5 REASONS FOR CLICKING ON AN AD
1 “Wanted to know more about the school.” 4 “Reminded me about needed enrollment actions.”
Seniors: 52% Up from 50% in 2018 Seniors: 40% Up from 27% in 2018
Juniors: 64% Up from 50% in 2018 Juniors: 27% Down from 29% in 2018
“Offer in ad interested me.” “Looking to see if the website had improved
2 5
Seniors: 38% Down from 47% in 2018 since last visit.”
Juniors: 52% Up from 44% in 2018 Seniors: 10% Up from 8% in 2018
Juniors: 10% Down from 12% in 2018
“Looking for new information about the school.”
3
Seniors: 39% Same as 2018
Juniors: 43% Down from 52% in 2018
© 2019 Ruffalo Noel Levitz | 2019 E-Expectations® Trend Report 17Actions taken after clicking on an ad
ACTION OVERALL SENIORS JUNIORS SOPHOMORES
Looked at information on a website 89% 84% 93% 91%
Watched a video 18% 18% 29% 9%
Filled out a form to have information sent by postal mail 18% 13% 10% 29%
Filled out a form to receive a PDF brochure 8% 7% 5% 11%
Registered to attend an event 5% 9% 5% 0%
Called a phone number offered in the ad 4% 7% 0% 4%
Nothing 5% 9% 2% 2%
KEY TAKEAWAYS
PAID ADS PAY OFF
With two out of three students saying they clicked on ads, it’s critical to have a paid
digital advertising strategy so you can reach more students on the sites they use daily.
MAKE SURE ADS ARE MOBILE FRIENDLY
Design for mobile and PCs so that ads look good across platforms. The same applies to
your landing pages.
USE VIDEO ON YOUR LANDING PAGES
After clicking a paid ad, video viewership doubled for juniors compared to 2018.
ARTIFICIAL INTELLIGENCE (AI) CHAT AND LIVE CHAT
As AI chat improves, it is becoming more common on college websites
AI chats and live chats have become very
FACT: common on commercial as well as college
Although websites. Colleges and universities are using
AI chat and them to engage students in the application
live chat are appearing process, and among the students who have
more frequently on sites, used these tools, three out of four found
them very helpful.
1 in 3 students
still say they have never Live chat and AI chat bots can be used to
encountered these tools answer general questions about financial
or that they don’t know aid, help students navigate the
about them. application process, and provide the
next steps for applying.
© 2019 Ruffalo Noel Levitz | 2019 E-Expectations® Trend Report 18ENROLLMENT
Top 6 opinions about AI and live chat experiences
1 “They’re OK, but I’d probably search on my own.”
40% seniors | 30% juniors | 29% sophomores
LIVE CHAT
2 “They can be helpful in getting quick answers.” OPPORTUNITY
28% seniors | 30% juniors | 18% sophomores
17%
of students
3 “I’ve never experienced this.”
14% seniors | 22% juniors | 24% sophomores
said they have
used live chat
when looking
“They are annoying; I don’t use them.”
4 23% seniors | 12% juniors | 18% sophomores
at a college or
university
“I don’t understand what you mean.”
5 13% seniors | 12% juniors | 10% sophomores 73%
of those students
“I love it when a school has it on their site.” said it was helpful
6 10% seniors | 5% juniors | 5% sophomores
KEY TAKEAWAYS
IMPLEMENT LIVE CHAT AND MAKE IT STUDENT FRIENDLY
Seven out of 10 who use it find live chat helpful. Look for ways to make it easier for
students to start a chat.
CREATE A COMMUNICATION PROCESS THAT MOVES STUDENTS FROM AI
TO A CONVERSATION WITH A LIVE ADMISSIONS COUNSELOR
As AI chat capabilities improve, have a communication process in place that ultimately
ends with the student chatting with a live admissions counselor.
ONLINE SEARCH
New in 2019! Search terms straight from the students themselves
THREE KEY DISCOVERIES ABOUT SEARCH INTENT
TOP SEARCH STUDENTS USE NON-BRANDED
1 CRITERIA 2 SUPERLATIVES: 3 SEARCH
44% “Best colleges for math” 84%
in the study enter “Top college of students conduct
a specific major basketball programs” an internet search
“Best campus life” without reference to
a specific institution
© 2019 Ruffalo Noel Levitz | 2019 E-Expectations® Trend Report 19Free-form response—top search terms students use when
researching colleges
What better way to attract students than to know what they’re searching for? The 2019 survey
gathered top search terms from students.
Top 5 response categories revealed by free-form response
We gathered the terms students told us they use and organized them into 5 buckets ranked
by importance:
44% 21% 15% 11% 10%
ACADEMIC QUALITY/ LOCATION STUDENT LIFE/ NAME OF
PROGRAMS RANKINGS RELATED FIT/ATHLETICS SPECIFIC
INSTITUTION
“SIRI/ALEXA/
GOOGLE, FIND ME
36%
of students have used voice-
A COLLEGE!” activated search on their devices
© 2019 Ruffalo Noel Levitz | 2019 E-Expectations® Trend Report 20ENROLLMENT
KEY TAKEAWAYS
INVEST IN SEARCH ENGINE OPTIMIZATION (SEO) TOOLS FOR YOUR WEBSITE
Implementing good SEO on your website is the difference between your school’s page
appearing on the first page of search, where most clicks are made, or being buried on
page two and beyond. As Google moves from clicks to providing snippets and other
information within search, your marketing strategy must include data analytics.
LOCATION, LOCATION, LOCATION
Though not a top search category, location helps narrow school choice and can help your
college or university appear much higher in localized search rankings.
GOOD! BETTER! BEST!
Students used terms like “best” and “top” when searching for institutions and specific
programs. Expand your keyword sets to include a few superlatives.
WEBSITE CONTENT
Build logical steps for navigating from your top content pages to
secondary pages
Tuition, financial aid, and scholarships continue to be the top pages that students read on your website.
However, if you provide them with logical steps for navigating to other pages, you can boost the visits
and credibility of these secondary pages. The 2019 E-Expectations survey found that these pages drive
more than 50 percent of the traffic to your website.
FACT: Students like to get personal. More than half (54 percent) report they
prefer websites that allow them to personalize content to meet their interests.
MOST VALUABLE WEBSITE CONTENT FOR STUDENTS (ORDERED BY JUNIORS)
INFORMATION SENIORS JUNIORS SOPHOMORES
Cost/tuition 90% 90% 88%
Scholarships 75% 90% 84%
Academic programs 79% 82% 77%
Financial aid 72% 73% 70%
Location appeal 45% 72% 70%
Student life 49% 48% 68%
How to apply 50% 62% 53%
Program rankings 49% 49% 58%
© 2019 Ruffalo Noel Levitz | 2019 E-Expectations® Trend Report 21Likes and dislikes
TOP 3 THINGS TOP 3 THINGS THAT DRIVE
STUDENTS PREFER: STUDENTS AWAY:
Easy to see which programs/ Lack of visual appeal
1 degrees are offered 1 of the site
35% seniors 31% seniors
41% juniors 28% juniors
45% sophomores 27% sophomores
A feel for the school and how Hard to see which programs
2 the student will fit in 2 and degrees are offered
30% seniors 30% seniors
36% juniors 43% juniors
20% sophomores 33% sophomores
Details about academic programs Hard to read pages
3 28% seniors
3 28% seniors
32% juniors 26% juniors
29% sophomores 34% sophomores
Make sure your website forms are mobile responsive
As students increasingly browse college sites on their mobile devices, pages not only have to look
good, but any forms need to be mobile responsive as well.
TOP 5 FORMS COMPLETED ON MOBILE DEVICES
OVERALL SENIORS JUNIORS SOPHOMORES
Request for information 51% 53% 57% 46%
Cost calculators 28% 35% 23% 24%
Scholarship calculators 25% 34% 20% 22%
Campus visit scheduler 20% 30% 20% 10%
Admissions application 19% 35% 13% 10%
KEY TAKEAWAYS
PROVIDE INTERACTIVE FINANCIAL TOOLS TO CALCULATE THE BOTTOM LINE
Money matters, so provide students with more than the cost of attendance. Help them
estimate financial aid not just for one year, but for four. Provide links to external and
internal scholarships and keep these up to date. The cost of tuition continues to increase,
so knowing the bottom line up front will become even more important to future students.
PERSONALIZE YOUR WEB PAGES AS MUCH AS POSSIBLE
Students not only want to find the academic programs most suited to their interests,
but they want to know what classes they’ll be taking, what jobs they will qualify for
with a certain degree, and what salaries they can expect to make.
TRANSFORM DEPARTMENT WEB PAGES INTO LANDING PAGES
Playing into the personalization of your website, consider creating specific landing pages for
specific programs. For example, have an internet ad for engineering students click through to a
specific landing page only about engineering—and include the steps to applying here as well.
© 2019 Ruffalo Noel Levitz | 2019 E-Expectations® Trend Report 22ENROLLMENT
PHOTO PREFERENCES
Keep it real with your photo choices
Students tell their own stories in pictures, whether the images live on Instagram, Snapchat, or
Facebook—and they report that they can spot stock photos.
Your audience appreciates authenticity rather than phony posing—the more believable the better.
In the 2019 E-Expectations survey, we tested photos among seniors, juniors, and sophomores. All report
their affinity for visuals of the campus, lifestyle, and peer interactions.
Conversely, all three groups identified posed images as disingenuous. Other images that were a turn-
off include generic classroom pictures and the isolated-student “thinker.”
What works: Highest-rated images
TOP IMAGE, ALL CLASSES
SECOND
Seniors Juniors Sophomores
THIRD (ALL CLASSES)
Juniors and seniors like images of the quintessential college campus with classic
architecture. And don’t be too concerned about portraying an idealized sunny
landscape. Crisp white snow can add to visual appeal. If your campus is located in a
four-season environment, don’t be afraid to show it.
© 2019 Ruffalo Noel Levitz | 2019 E-Expectations® Trend Report 23What to avoid: Lowest-rated image styles
LEAST-APPEALING FOR SENIORS AND SOPHOMORES
LEAST-APPEALING FOR JUNIORS
These three image styles all received the lowest rating from respondents. Students
rated “least appealing” any images that resembled a stock photo. One-third said
they would not be interested in the campus, particularly if they saw any images that
communicate a generic feel.
KEY TAKEAWAYS
CONVEY A SENSE OF PLACE WITH YOUR PHOTOS
This trend appears to be perennial: Prospective students simply like big views of
campuses. Give students a chance to see what your campus looks like so they can
picture themselves there. Also, don’t be afraid to show your school in winter.
MARKET FOR YOUR TARGET AUDIENCE—NOT THE GREATER POOL OF
PROSPECTIVE STUDENTS
One size does not fit all when it comes to choosing a college, so avoid generalizing your
campus and don’t be afraid to showcase your school’s specific offerings. Ultimately, an
authentic portrayal of your college or university directs your marketing dollars toward
the students you actually want on your campus.
© 2019 Ruffalo Noel Levitz | 2019 E-Expectations® Trend Report 24ENROLLMENT
VIDEO
Video makes the student experience come alive
Video content is an essential tool for portraying campus life, whether in the classroom, on the playing
field, at social activities, or in dorms. Seniors, juniors, and sophomores all rate the medium highly. And they
show increasing tolerance for the time they will give to a video. Anything under three minutes is OK.
Video content around tuition and financial aid rated lower for all groups, but even these generate
significant interest (31 percent overall). Students also like tours and personalized content that matches
their interests.
Video topics that appeal most to students
Experiences/classroom and on campus
69% Overall 70% Seniors 74% Juniors 65% Sophomores
Campus activities
64% Overall 70% Seniors 74% Juniors 65% Sophomores
Campus tours
60% Overall 68% Seniors 63% Juniors 48% Sophomores
Residence hall tours
50% Overall 58% Seniors 46% Juniors 46% Sophomores
Classroom tours
42% Overall 46% Seniors 46% Juniors 35% Sophomores
Customized content/programs, activities
38% Overall 41% Seniors 41% Juniors 33% Sophomores
Faculty talking about classes
36% Overall 51% Seniors 29% Juniors 29% Sophomores
Alumni talking about degrees/careers
33% Overall 38% Seniors 35% Juniors 27% Sophomores
Application tutorials
28% Overall 19% Seniors 44% Juniors 25% Sophomores
Tuition/financial aid tutorials
31% Overall 19% Seniors 39% Juniors 27% Sophomores
© 2019 Ruffalo Noel Levitz | 2019 E-Expectations® Trend Report 25How long is too long to watch a video?
HERE’S WHAT SENIORS, JUNIORS, AND SOPHOMORES HAD TO SAY:
Will stop watching if video is… Overall Seniors Juniors Sophomores
88%
83%
80% 81%
27%
17%
14%
8%
1% 0% 0% 2% 1% 2% 0% 2% 1% 2% 2% 0%
More than More than More than More than More than
15 seconds 30 seconds a minute 2 minutes 3 minutes
KEY TAKEAWAYS
KEEP YOUR VIDEOS TO FEWER THAN THREE MINUTES
Students love video, but they won’t stick around if you make your school’s longer than
three minutes. If you have video content that runs longer than that, consider dividing it
into multiple videos.
ANALYZE VIDEO ANALYTICS AND ADJUST CONTENT ACCORDINGLY
Check metrics on your videos and see when students quit watching. If students keep
clicking away early, consider editing or replacing a video.
CREATE INTERACTIVE VIDEO TOURS OF SPECIFIC DEPARTMENTS, DORMS,
AND OTHER AREAS ON CAMPUS
Tours of all sorts score highly. Make sure yours are engaging and include real students.
© 2019 Ruffalo Noel Levitz | 2019 E-Expectations® Trend Report 26ENROLLMENT
6 BIG TAKEAWAYS FOR 2019
After reviewing all of the data for the 2019 E-Expectations study, here are five
broader takeaways that will help your campus strengthen your digital presence and
engage more students.
Optimize your multichannel mix. Students use a wide variety of methods for researching
1 colleges, from the traditional print and email to the emerging like VR tours. It’s key to analyze
which channels are the best investment for your target audience so you can expand your
reach while also managing those channels well.
Communicate visually as much as possible. Generation Z is a generation of images, videos,
2 memes, and visual communication. The more visual your content can be, the greater levels of
engagement you will achieve.
Invest in search. SEO requires strategies built on sound analytics and data. To dominate
3 the search categories you want, you need to balance both organic SEO strategies as well as
smart paid interactive marketing so that you can capture student interest for all the terms
you want.
Make search a truly mobile experience. Go beyond mobile optimized web pages and think
4 more broadly about how to engage students on their phones. Shorter responsive forms,
more visual content, text messaging flows—do everything you can to make it easier for
students to research your institution from the palms of their hands.
Have a website with multiple “welcome” mats. More and more students are not coming
5 through the front door of your home page. They are finding pages on academics, campus
life, cost, and other key considerations. Make sure that, no matter where they may end up,
they can start engaging with your campus and find their own informational pathways.
Personalize at every opportunity. Finally, an overarching theme of open-ended responses
6 and specific questions in the study this year demonstrate that students appreciate and
expect your communications with them to be personalized. They appreciate tools on your
website that allow them to customize and filter their experiences. They want you to let them
know how your institution and programs will meet their unique needs AND that you want
them to enroll.
Build a digital presence that engages the students you want
CONTACT US FOR A DIGITAL ASSESSMENT
How can you turn the findings from E-Expectations into a winning digital strategy?
Ask us for a free consultation.
VISIT RuffaloNL.com/DigitalConsult | EMAIL ContactUs@RuffaloNL.com | CALL 800.876.1117
© 2019 Ruffalo Noel Levitz | 2019 E-Expectations® Trend Report 27ABOUT THE SURVEY SPONSORS
RNL is the leading provider of higher education enrollment, student success, and
fundraising solutions. The firm serves more than 1,900 colleges and universities
through data-driven solutions focused on the entire lifecycle of enrollment and
fundraising, assuring students find the right program, graduate on time, secure
their first job in their chosen field, and give back to support the next generation.
With a deep knowledge of the industry, RNL provides institutions the ability to
scale their efforts by tapping into a community of support and resources.
Visit RuffaloNL.com
OmniUpdate is the definitive partner of choice among web content management
system (CMS) providers in higher education. Backed by award-winning training
and support, OmniUpdate’s OU Campus™ CMS is the easiest to use with features
and modules designed to meet higher ed’s unique needs. When you partner with
OmniUpdate, you become part of the OmniUpdate community, a nationwide group
of hundreds of likeminded higher ed professionals and industry experts.
Visit OmniUpdate.com
Survey list for this study provided by:
PLEXUSS is a mission-driven digital platform impacting how prospective students
and post-secondary institutions connect. Since 2015, the PLEXUSS Global Student
NetworkTM has grown to over 6.1 million student users and nearly 18,000
post-secondary institutions worldwide. By leveraging proprietary AI technology,
PLEXUSS engages students over longer periods, getting to know each student’s
individual needs and goals.
Visit plexuss.com/solutions
Visit RuffaloNL.com/Enrollment How to cite this report
Email ContactUs@RuffaloNL.com Ruffalo Noel Levitz & OmniUpdate. (2019). 2019 E-expectations trend report.
Cedar Rapids, Iowa: Ruffalo Noel Levitz.
Call 800.876.1117
Available at www.RuffaloNL.com/Expectations
All material in this document is copyright © 2019 by Ruffalo Noel Levitz.
Permission is required to redistribute information from
Ruffalo Noel Levitz either in print or electronically.
19/07
EM-011
© 2019 Ruffalo Noel Levitz | 2019 E-Expectations® Trend Report 28You can also read