Alabama Department of Environmental Management
←
→
Page content transcription
If your browser does not render page correctly, please read the page content below
Chase Creek                                              Low D.O./Organic Loading
AL/06030002-190_01

     Alabama Department of Environmental Management

                       Final TMDL Development for
                Chase Creek / AL06030002-190_01
              Low Dissolved Oxygen/Organic Loading

                                  Water Quality Branch
                                    Water Division
                                    February 2002

Prepared by Water Quality Branch/David Thompson                              1/28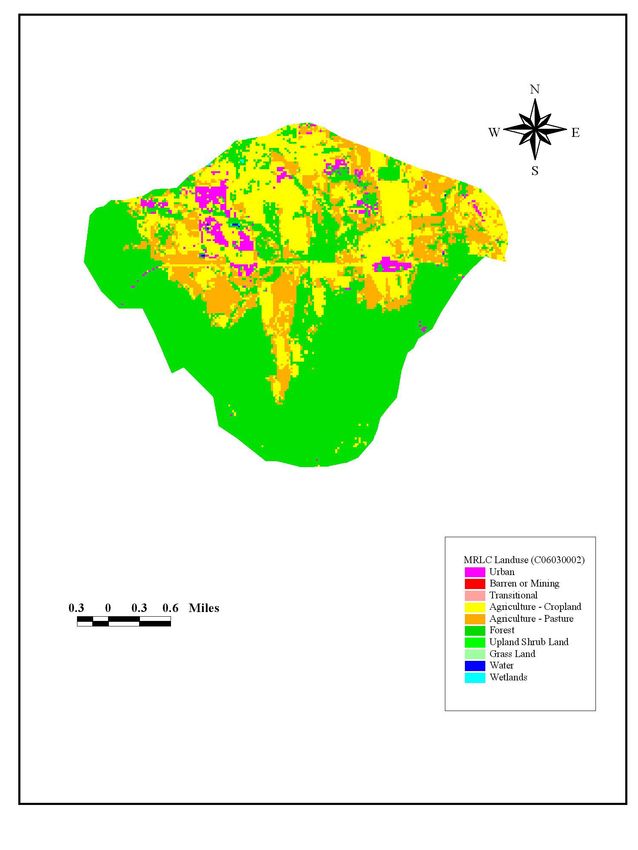
Chase Creek                                                                 Low D.O./Organic Loading
AL/06030002-190_01

       Chase Creek Watershed in the Tennessee River Basin

                                                                                       JACKSON
                                            MADISON
                   LIMESTONE
                      303 (d) segment                      Middle Flint River

      LAWRENCE

                                  MORGAN
                                                                                     DE KALB

                                                           MARSHALL
                          CULLMAN

                                                      10        0               10              20 Miles
                                  MADISON
                                  COUNTY

                                                                    Chase listed.shp
                                                                    Subwatersheds i n 06030002.shp
                 ALABAMA                                            Tennessee River.shp
                                                                    County.shp
                                                                    6030002.shp

Prepared by Water Quality Branch/David Thompson                                                        2/28
Chase Creek Low D.O./Organic Loading
AL/06030002-190_01
Table of Contents Page
1. Executive Summary 4
2. Basis for §303(d) Listing 5
2.1. Introduction 5
2.2. Problem Definition 6
3. Technical Basis for TMDL Development 8
3.1. Water Quality Target Identification 8
3.2. Source Assessment 8
3.3. Loading Capacity - Linking Water Quality Numeric Targets
and Pollutant Sources 12
3.4. Data Availability and Analysis 12
3.5. Critical Conditions 16
3.6. Margin of Safety 16
4. Water Quality Model Development 16
4.1. Water Quality Model Selection and Setup 16
4.2. Water Quality Model Summary 17
4.3. TMDL Critical Model Predictions and Graphics 20
4.4. Loading Reduction Analysis 21
4.5. Seasonal Variation 21
5. Conclusions 21
6. TMDL Implementation 21
6.1 Non-Point Source Approach 21
6.2 Point Source Approach 23
7. Follow Up Monitoring 24
8. Public Participation 24
9. Appendices
9.1 References 9.1
9.2 Water Quality Data 9.2
9.3 Water Quality Model Input and Output Files 9.3
9.4 Spreadsheet Water Quality Model (SWQM) User Guide 9.4
Prepared by Water Quality Branch/David Thompson 3/28Chase Creek Low D.O./Organic Loading AL/06030002-190_01 1.0 Executive Summary This report contains one or more Total Maximum Daily Loads (TMDLs) for waterbody segments found on Alabama’s 1996 and/or 1998 Section 303(d) List(s) of Impaired Waterbodies. Because of the accelerated schedule required by the consent decree, many of these TMDLs have been prepared out of sequence with the State’s rotating basin approach. The implementation of the TMDLs contained herein will be prioritized within Alabama’s rotating basin approach. The amount and quality of data on which this report is based are limited. As additional information becomes available, the TMDLs may be updated. Such additional information may include water quality and quantity data, changes in pollutant loadings, or changes in land use within the watershed. In some cases, additional water quality data may indicate that no impairment exists. Chase Creek, a part of the Tennessee River Basin, is located in Madison County near Huntsville, Al. It has been on the State of Alabama’s §303(d) use impairment list since 1996 for organic enrichment/low dissolved oxygen (O.E./D.O.). Its use classification is Fish and Wildlife. Biological data collected by TVA in 1994 and 1995 indicated impaired macroinvertebrate and fish communities. The impairment was attributed to siltation and organic enrichment/low dissolved oxygen but water column sampling was not conducted at the time to support this assumption. Since D.O. impairments generally occur during the summer months when stream flows are low and water temperatures are high, a steady state modeling approach using the stream’s 7Q10 flow (the minimum 7-day flow that occurs, on average, over a 10-year recurrence interval) was adopted as appropriate for this TMDL analysis. The only additional data obtained, since the TVA data collection in 1994 and 1995, was collected in 1998 by ADEM. In 1998 samples were taken from one station in May, July, and September. None of these samples showed a D.O. violation. Due to the fact that no violations have been recorded for Chase Creek no reductions were calculated for the watershed. In this report only the TMDL for the critical period was calculated. If additional data shows that Chase Creek is impaired for D.O., the TMDL will be revised to include the necessary reductions. As part of TMDL implementation additional monitoring of Chase Creek is planned for 2003. The following report addresses the results of the TMDL analysis for O.E./D.O. In accordance with ADEM water quality standards, the minimum dissolved oxygen concentration in a stream classified as Fish and Wildlife is 5.0 mg/l. For the purpose of this TMDL, a minimum dissolved oxygen level of 5.0 mg/l will be implemented allowing for an implicit margin of safety resulting from conservative assumptions used in the dissolved oxygen model. Prepared by Water Quality Branch/David Thompson 4/28
Chase Creek                                                        Low D.O./Organic Loading
AL/06030002-190_01

A summary of the TMDL for the watershed is provided in the table presented below. The
pollutants shown in the table include ultimate carbonaceous biochemical oxygen demand
(CBODu) and nitrogenous biochemical oxygen demand (NBOD), the principle causes for
observed low dissolved oxygen concentrations. CBODu is a measure of the total amount
of oxygen required to degrade the carbonaceous portion of the organic matter present in
the water. NBOD is the amount of oxygen utilized by bacteria as they convert ammonia
to nitrate. Because organic nitrogen can be converted to ammonia, its potential oxygen
demand is included in the NBOD component of the TMDL. The table lists allowable
pollutant loadings by source (point and non-point sources) for the summer (Critical)
season (May through November).

         Table 1-1. Maximum Allowable Pollutant Loads by Source (Critical)

           Pollutant             Point Source Loads             Non-point Source Loads
                                      (lbs./day)                      (lbs./day)
            CBODu                         0                              121
            NBOD                          0                              64.2
             Total                        0                              185.2

2.0 Basis for §303(d) Listing
        2.1 Introduction
Section 303(d) of the Clean Water Act (CWA) as amended by the Water Quality Act of
1987 and EPA’s Water Quality Planning and Management Regulations [(Title 40 of the
Code of Federal Regulations (CFR), Part 130)] require states to identify waterbodies
which are not meeting water quality standards applicable to their designated use
classification. The identified waters are prioritized based on severity of pollution with
respect to designated use classification. Total maximum daily loads (TMDLs) for all
pollutants causing violation of applicable water quality standards are established for each
identified water. Such loads are established at levels necessary to implement the
applicable water quality standards with seasonal variations and margins of safety. The
TMDL process establishes the allowable loading of pollutants, or other quantifiable
parameters for a waterbody, based on the relationship between pollution sources and in-
stream water quality conditions, so that states can establish water-quality based controls
to reduce pollution from both point and non-point sources and restore and maintain the
quality of their water resources (USEPA, 1991).

The State of Alabama has identified Chase Creek as being impaired by organic loading
(i.e., CBODu and NBOD) for a length of 2.2 miles, as reported on the 1996, 1998 and
Draft 2000 §303(d) list(s) of impaired waters. Chase Creek is prioritized as “low ” on the
list(s). Chase Creek is located in Madison County and lies within the Middle Flint River
subwatershed of the Tennessee River basin.

Prepared by Water Quality Branch/David Thompson                                        5/28
Chase Creek Low D.O./Organic Loading
AL/06030002-190_01
The TMDL developed for Chase Creek illustrates the steps that can be taken to address a
waterbody impaired by low dissolved oxygen levels. The TMDL is consistent with a
phased-approach: estimates are made of needed pollutant reductions, load reduction
controls are implemented, and water quality is monitored for plan effectiveness.
Flexibility is built into the plan so that load reduction targets and control actions can be
reviewed if monitoring indicates continuing water quality problems.
2.2 Problem Definition
Chase Creek is a small headwater stream with a drainage area of 13.7 square miles. Dry
weather flows for the watershed are relatively low, or zero. Water Quality and biological
data for Chase Creek is available for the period of 1995 and 1998. In 1995 TVA collected
macroinvertebrate/EPT and fish/IBI biological data at one station on Chase Creek (2517-
1). Flow and chemical data were not collected during this study. From this report TVA
concluded that the bug health was poor/fair and the fish health was poor and attributed
the impairment to siltation, nutrients, and organic enrichment. Based on these results
Chase Creek was listed on the 1996 303(d) list. In 1998 ADEM sampled one station
“CHSM-190” on Chase Creek, three times. This data had no D. O. violations. If there are
depressed in-stream D.O. concentrations in Chase Creek they may be caused by several
sources including the decay of oxygen demanding waste from non-point sources, algal
respiration, sediment oxygen demand or other sources.
The graph presented below shows the relationship between D.O. and temperature.
DO vs. Water Temp
9 27
W ater T em p (c)
25
D O (m g /l)
7 23 D.O.
21 (mg/l)
Do Standard
5 19 Water
17 temp.
3 15
May-98 Jul-98 Sep-98
date
Prepared by Water Quality Branch/David Thompson 6/28Chase Creek Low D.O./Organic Loading
AL/06030002-190_01
Waterbody Impaired: Chase Creek from Acuff Spring
to Hwy.72
Water Quality Standard Violation: Dissolved Oxygen
Pollutant of Concern: Organic Enrichment (CBODu/NBOD)
Water Use Classification: Fish and Wildlife
The impaired stream segment, Chase Creek, is classified as Fish and Wildlife. Usage of
waters in this Fish and Wildlife is described in ADEM Admin. Code R. 335-6-10-
.09(5)(a), (b), (c), and (d).
(a) Best usage of waters:
Fishing, propagation of fish, aquatic life, and wildlife, and any other usage
except for swimming and water-contact sports or as a source of water supply
for drinking or food processing purposes.
(b) Conditions related to best usage:
The waters will be suitable for fish, aquatic life and wildlife propagation. The
quality of salt and estuarine waters to which this Fish and Wildlife is assigned
will also be suitable for the propagation of shrimp and crabs.
(c) Other usage of waters:
It is recognized that the waters may be used for incidental water contact and
recreation during June through September, except that water contact is
strongly discouraged in the vicinity of discharges or other conditions beyond
the control of the Department or the Alabama Department of Public Health.
(d) Conditions related to other usage:
The waters, under proper sanitary supervision by the controlling health
authorities, will meet accepted standards of water quality for outdoor
swimming places and will be considered satisfactory for swimming and other
whole body water-contact sports.
Low D.O./Organic Loading Criteria:
Alabama’s water quality criteria document (ADEM Admin. Code R. 335-6-10-.09-
(5)(e)(4.)) states that for a diversified warm water biota, including game fish, daily
dissolved oxygen concentrations shall not be less than 5 mg/l at all times; except under
extreme conditions due to natural causes, it may range between 5 mg/l and 4 mg/l,
provided that the water quality is favorable in all other parameters. The normal seasonal
and daily fluctuations shall be maintained above these levels. In no event shall the
dissolved oxygen level be less than 4 mg/l due to discharges from existing hydroelectric
Prepared by Water Quality Branch/David Thompson 7/28Chase Creek Low D.O./Organic Loading
AL/06030002-190_01
generation impoundments. All new hydroelectric generation impoundments, including
addition of new hydroelectric generation units to existing impoundments, shall be
designed so that the discharge will contain at least 5 mg/l dissolved oxygen where
practicable and technologically possible. The Environmental Protection Agency, in
cooperation with the State of Alabama and parties responsible for impoundments, shall
develop a program to improve the design of existing facilities.
3.0 Technical Basis for TMDL Development
3.1 Water Quality Target Identification
The minimum dissolved oxygen concentration in a stream classified as Fish and Wildlife
is 5.0 mg/l. For the purpose of this TMDL, a minimum dissolved oxygen level of 5.0
mg/l will be implemented allowing for an implicit margin of safety resulting from
conservative assumptions used in the dissolved oxygen model. The target CBODu and
NBOD concentrations are concentrations that, in concert with the nitrification of
ammonia, will not deplete the dissolved oxygen concentration below this level as a result
of the decaying process.
3.2 Source Assessment
3.2.1. General Sources of CBODu and NBOD
Both point and non-point sources may contribute CBODu and NBOD (i.e., organic
loading) to a given waterbody. Potential sources of organic loading are numerous and
often occur in combination. In rural areas, storm runoff from row crops, livestock
pastures, animal waste application sites, and feedlots can transport significant loads of
organic loading. Nationwide, poorly treated municipal sewage comprises a major source
of organic compounds that are hydrolyzed to create additional organic loading. Urban
storm water runoff, sanitary sewer overflows, and combined sewer overflows can be
significant sources of organic loading.
All potential sources of organic loading in the watershed were identified based on an
evaluation of current land use/cover information on watershed activities (e.g., agricultural
management activities). The source assessment was used as the basis for development of
the model and ultimate analysis of the TMDL allocations. The organic loading
assessment within the watershed included both point and non-point sources.
3.2.2. Point Sources in the Chase Creek Watershed
ADEM maintains a database of current NPDES permits and GIS files that locate each
permitted outfall. This database includes municipal, semi-public/private, industrial,
mining, industrial storm water, and concentrated animal feeding operations (CAFOs)
permits. Table 3-1, below, shows the permitted point sources in the watershed that
discharge into or upstream of the impaired segment.
Prepared by Water Quality Branch/David Thompson 8/28Chase Creek Low D.O./Organic Loading
AL/06030002-190_01
Table 3-1. Contributing Point Sources in the Chase Creek Watershed.
NPDES or SID Type of Facility (e.g., CAFO, Facility Name Significant
Permit # Industrial, Municipal, Semi- Contributor
Public/Private, Mining, (Yes/No)
Industrial Storm Water)
AL 0029483* Industrial Storm Water National Copper & Smelting* no
ALG120204 Industrial Storm Water PPG Industries Inc no
ALG230040 Industrial Storm Water PPG Industries Inc no
AL 0047244 Industrial Storm Water J&J South Central no
Notes: *National Copper & Smelting has a discharge to an unnamed tributary to Chase
Creek from a ground water treatment system. The treatment system consists of an air
stripper for treating contaminated groundwater. The discharge to the unnamed tributary
has an average flow of 0.24 mgd but was not incorporated into the model due to the
following:
• The permittee’s application Form 2C indicates the BOD5 in the discharge is less than
10 mg/l.
• The permittee is not required to monitor for BOD5 in the permit.
• No sufficient oxygen demanding constituents are expected in the discharge to the
unnamed tributary after being treated by the air stripper, as further evidenced by the
Form 2C.
• The discharge is expected to be intermittent and may not be long term.
• The model is considered more conservative without the discharge as the air stripper
could provide additional D.O.
Storm water discharges listed in the above table were marked as not being a significant
contributor since the discharge would not occur during low flow conditions.
Construction storm water discharges are not listed as these discharges do not occur
during low flow and generally do not contribute directly to the organic loading.
No point sources were determined to be significant sources for the D.O. TMDL;
therefore, none were considered in the model development.
3.2.3. Non-Point Sources in the Chase Creek Watershed
Shown in Table 3-2, below, is a detailed summary of land usage in the Chase Creek
watershed. Shown in Figure 3-1 is a pie chart depicting principal land uses. A land use
map of the watershed is presented in Figure 3-2. The predominant land uses within the
watershed are agricultural and forest. Their respective percentages of the total watershed
are 50% and 47%.
Prepared by Water Quality Branch/David Thompson 9/28Chase Creek Low D.O./Organic Loading
AL/06030002-190_01
Table 3-2. Land Use in the Chase Creek Watershed.
LANDUSE for Mallard Creek % of total acres sq miles
Cropland 31.3% 2739 4.3
Forest 47.0% 4118 6.4
High Commercial 1.8% 155 0.2
/Industrial/Transportation
High Residential 0.2% 15 0.0
Low Residential 1.0% 86 0.1
Pasture 18.7% 1637 2.6
Water 0.0% 3 0.0
Total 100.0% 8753 13.7
19% 3%
31% Cropland
Forest
Pasture
Other
47%
Figure 3-1
The predominant land uses of cropland, forest, and pasture make up 97% of the
watershed. The other 3% of the land uses, except open water, were combined into one
category (other) for modeling purposes. Each land use has the potential to contribute to
the organic loading in the watershed due to organic material on the land surface that
potentially can be washed off into the receiving waters of the watershed. Information on
agricultural and management activities and watershed characteristics were obtained
through coordination with the ADEM Mining and Non-Point Section, the Alabama
Cooperative Extension System, and the USDA-Natural Resources Conservation Service
(NRCS).
The major sources of organic enrichment from non-point sources within the Chase Creek
watershed are the forest, cropland and pasture land uses. Compared to other land uses
organic enrichment from forested land is normally considered to be small. This is
because forested land tends to serve as a filter of pollution originating within its drainage
areas. However, organic loading can originate from forested areas due to the presence of
wild animals such as deer, raccoons, turkeys, waterfowl, etc. Control of these sources is
usually limited to land management best management practices (BMPs) and may be
impracticable in most cases. In contrast to forested land, agricultural land can be a major
source of organic loading. Runoff from pastures, animal operations, improper land
Prepared by Water Quality Branch/David Thompson 10/28Chase Creek Low D.O./Organic Loading AL/06030002-190_01 application of animal wastes, and animals with access to streams are all mechanisms that can introduce organic loading to waterbodies. Figure 3-2. Land Use Map for the Chase Creek Watershed. Prepared by Water Quality Branch/David Thompson 11/28
Chase Creek                                                       Low D.O./Organic Loading
AL/06030002-190_01

        3.3 Loading Capacity – Linking Numeric Water Quality
            Targets and Pollutant Sources
EPA regulations define loading, or assimilative capacity, as the greatest amount of
loading that a waterbody can receive without violating water quality standards (40 CFR
Part 130.2(f)).

Alabama’s water quality criteria document (ADEM Admin. Code R. 335-6-10-.09-
(5)(e)(4.)) states that for a diversified warm water biota, including game fish, daily
dissolved oxygen concentrations shall not be less than 5 mg/l at all times; except under
extreme conditions due to natural causes, it may range between 5 mg/l and 4 mg/l,
provided that the water quality is favorable in all other parameters. The normal seasonal
and daily fluctuations shall be maintained above these levels.

Using the D.O. water quality criterion of 5.0 mg/l as the numerical target, a TMDL model
analysis was performed at critical conditions (i.e., summer) to determine the loading
capacity for the watershed. This was accomplished through a series of simulations aimed
at meeting the dissolved oxygen target limit by varying source contributions. The final
acceptable simulation represented the TMDL (and loading capacity of the waterbody). If
point sources were identified in the watershed, an additional model analysis was
performed for the winter to determine the loading capacity during higher flow conditions.

In the TMDL model analysis, the pollutant concentrations from forestland were assumed
to be at normal background concentrations. Without specific stream data, background
pollutant concentrations are considered to be as follows: 2 mg/l CBODu, 0.5 mg/l
ammonia oxygen demand (NH3-N), and 1 mg/l total organic nitrogen oxygen demand
(TON). For Chase Creek using available field data, background conditions were
considered to be as follows: 2 mg/l CBODu, 0.11 mg/l ammonia oxygen demand (NH3-
N), and 0.22 mg/l total organic nitrogen oxygen demand (TON). Pollutant concentrations
for the other land uses in the watershed were assigned in proportion to measured
concentrations and were set in the TMDL model at levels necessary to maintain dissolved
oxygen concentrations greater than, or equal to, 5 mg/l.

        3.4 Data Availability and Analysis
3.4.1. Watershed Characteristics

A. General Description: Chase Creek, located in Madison County, is a tributary to the
   Flint River. The Flint River is a part of the Tennessee River basin. Chase Creek is a
   part of the USGS (United States Geological Survey) 06030002 cataloging unit and
   the NRCS (Natural Resources Conservation Service) 190 sub-watershed. Cataloging
   unit 06030002 includes Wheeler Lake. NRCS sub-watershed number 190 represents
   the Middle Flint River subwatershed.

    Chase Creek begins on the Northeast side of Chapman Mountain in Section 17,
    Township 3S, and Range 1E. It has a linear distance of 4.9 miles and a total drainage

Prepared by Water Quality Branch/David Thompson                                      12/28
Chase Creek Low D.O./Organic Loading
AL/06030002-190_01
area of 13.7 square miles. Chase Creek has a use classification of Fish & Wildlife
(F&W).
B. Geological Description: The predominately geology of the Chase Creek Watershed
consist primary of Tuscumbia Limestone Formation of the Mississippian system in
the Interior Low Plateaus and Appalachian Plateaus province. Which consist of
limestone and chert that of the karst nature.
C. Eco-region Description: Chase Creek is primary in the following Eco-region:
The Eastern Highland Rim which has more level terrain and weaker dissection than
the Western Highland Rim (71f), with flat to gently rolling landforms.
Mississippian-age limestone, chert, shale, and dolomite predominate, and springs,
sinks, and caves have formed by solution of the limestone. Cave and spring-
associated fish fauna also typify the region. In the southern part of the region,
streams flow down from the Pottsville Escarpment of ecoregion 68, cutting north
across the Moulton Valley and through narrow valleys of Little Mountain (71j) to
the impounded Tennessee River. Natural vegetation for the region is transitional
between the oak-hickory type to the west and the mixed mesophytic forests of the
Appalachian ecoregions to the east. Much of the original bottomland hardwood
forest has been inundated by impoundments. The flatter areas in the east and on both
sides of the Tennessee River have deep, well-drained, reddish, productive soils that
are intensively farmed.
D. Other Notable Characteristics: Chase Creek starts at an elevation of 810 feet and ends
at 638 feet. It’s total length is 4.9 miles. The beginning of the stream has a steep
slope but then it goes to a more gradual slope. Acuff Springs discharges near the end
of Chase Creek.
3.4.2 Available Water Quality and Biological Data
Water Quality and biological data for the Chase Creek is available for the period of 1995
and 1998. This data was collected by TVA in 1995 and by ADEM in 1998. Station
2157-1 has a site description of “Blackwell/McMillan Property, RM 0.9, information
collected here by TVA included macroinvertebrate/EPT and fish/IBI biological data.
There was no flow or chemical data collected during this study. In 1998 ADEM
sampled one station, “CHSM-190”, three times. This data had no D. O. violations.
Due to the fact that no D. O. violations have occurred during a sampling event, no
reductions were calculated for Chase Creek at this time. In this report only the TMDL
for the critical period was calculated. Additional data will be necessary to calculate the
existing load in order to calculate the required reductions, if necessary, to achieve the
TMDL. A complete listing of the available data can be found in the appendix of this
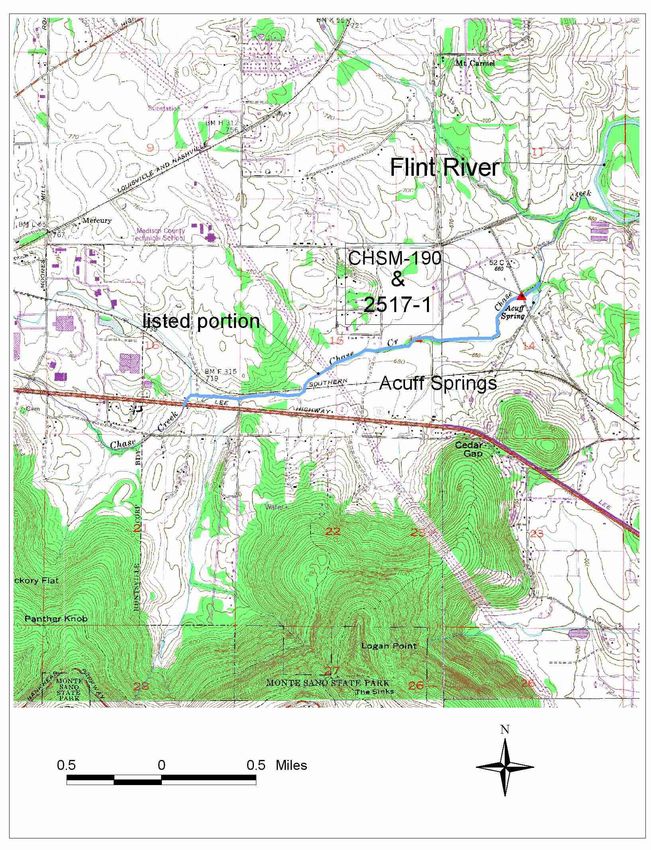
report. A map indicating the location of sampling points is presented in Figure 3-3.
Prepared by Water Quality Branch/David Thompson 13/28Chase Creek Low D.O./Organic Loading
AL/06030002-190_01
Figure 3-3. Map of Sampling Locations for the Chase Creek Watershed.
Prepared by Water Quality Branch/David Thompson 14/28Chase Creek Low D.O./Organic Loading
AL/06030002-190_01
3.4.3. Flow data
For the purpose of this TMDL, an annual 7Q10 stream flow for the Critical (summer)
period was employed. This flow represents a worst-case scenario for the critical period
model evaluation. The use of worst-case conditions, in turn, creates a margin of safety in
the final results.
The 7Q10 flow represents the minimum 7-day flow that occurs, on average, over a 10-
year recurrence interval.
The 7Q10 flow can be calculated for the model using gage data from the United States
Geological Survey (USGS) or by using the Bingham Equation. The Bingham Equation
can be found on page 3 of a publication from the Geological Survey of Alabama entitled,
Low-Flow Characteristics of Alabama Streams, Bulletin 117.
The equation used to calculate the 7Q10 flows based on continuous USGS records for the
stream and any associated tributaries are as follows:
7Q10 (cfs) = (7Q10 @ USGS Station (cfs)) * (Watershed Drainage Area (mi2))
2
(Drainage Area @ USGS Station (mi ))
The 7Q10 flow can also be estimated using the Bingham equation. Low flow estimates
employing this equation are based on the stream’s recession index (G, no units), the
stream’s drainage area (A, mi2), and the mean annual precipitation (P, inches):
7Q10 (cfs) = 0.24x10⁻⁴(G-30)1.07(A)0.94(P-30)1.51
The method used to determine the 7Q10 flow for Chase Creek was the Bingham Equation.
An assumption was also made to add the flow from Acuff Springs as a tributary to the
7Q10 flow calculated from the Bingham Equation. A critical low flow for Acuff Springs
was estimated from data obtained from the document “Springs in Alabama, Geological
Survey of Alabama, Circular 134, 1987”. The resulting 7Q10 flow is 0.21 cfs from the
Bingham Equation plus 0.5 cfs from Acuff Springs which gives a total 7Q10 flow equal to
0.71 cfs. Based on the following:
G= 50 Stream flow Recession Index
A= 13.7 Contributing Drainage Area in (sq. mi.)
P= 52 Mean Annual Precipitation in (in.)
The calculated flow from the Bingham Equation was distributed over Chase Creek in the
form of incremental inflow (identified on the modeled reach schematic as IF). The IF
was distributed in proportion to the length of each segment.
Prepared by Water Quality Branch/David Thompson 15/28Chase Creek Low D.O./Organic Loading
AL/06030002-190_01
3.5 Critical Conditions
Summer months (May–November) are generally considered critical conditions for
dissolved oxygen in streams. This can be explained by the nature of storm events in the
summer versus the winter. Periods of low precipitation allow for slower in-stream
velocity, which increases the organic loading residence time and decreases stream re-
aeration rates. This increased time permits more decay to occur which depletes the
stream’s dissolved oxygen supply. Reaction rates for CBODu and NBOD (i.e., organic
loading) are temperature dependent and high summertime temperatures increase the
decay process, which depletes the dissolved oxygen even further.
In winter, frequent low intensity rain events are more typical and do not allow for the
build-up of organic loading on the land surface, resulting in a more uniform loading rate.
Higher flows and lower temperatures create less residence time and lower decay rates.
3.6 Margin of Safety (MOS)
There are two basic methods of incorporating the MOS (USEPA, 1991): 1) implicitly,
using conservative model assumptions, or 2) explicitly by specifying a portion of the
TMDL as the MOS.
The MOS is implicit in this TMDL process through the use of conservative model input
parameters (temperature, flow and D.O. concentrations). Conservative temperature
values are employed through the use of the highest average maximum temperature that
would normally occur under critical stream flow conditions. The 7Q10 stream flow
employed for this TMDL, respectively, reflect the lowest flows that would normally
occur under critical conditions. The D.O. concentration for incremental flow was set at
70% of the saturation concentration at the given temperature, which is 15% lower than
the 85% normally assumed in a typical waste load allocation. In addition water depths
are shallow, generally less than one foot, which aggravates the effect of sediment oxygen
demand (SOD).
4.0 Water Quality Model Development
4.1 Water Quality Model Selection and Setup
Since the impairment noted by the available data is expected to occur during periods of
low flow, a steady-state modeling approach was adopted as appropriate to represent the
relevant conditions in the impaired waterbody. The steady state TMDL spreadsheet
water quality model (SWQM) developed by the ADEM was selected for the following
reasons:
• It is a simplified approach without unnecessary complexity.
• It conforms to ADEM standard practices for developing wasteload allocations.
• It lends itself to being developed with limited data, which is the present
situation for this waterbody.
Prepared by Water Quality Branch/David Thompson 16/28Chase Creek Low D.O./Organic Loading
AL/06030002-190_01
• It has the ability to handle tributary inputs and both point and non-point
source inputs.
The TMDL spreadsheet model also provides a complete spatial view of a stream,
upstream to downstream, giving differences in stream behavior at various locations along
the model reach. The model computes dissolved oxygen using a modified form of the
Streeter-Phelps equation. The modified Streeter-Phelps equation takes into account the
oxygen demand due to carbonaceous decay plus the oxygen demand generated from the
nitrification process (ammonia decay). Each stream reach is divided into twenty
elements, with each element assumed to be the functional equivalent of a completely
mixed reactor.
The following assumptions were used in the spreadsheet TMDL model:
• D.O. concentrations for incremental flow were assumed @ 70% of the
saturated value at the given temperature. (MOS)
• Incremental and tributary loading were apportioned to correlate with the land
usage of the drainage basin.
• Ratios for CBODU/NH3ODU and CBODU/TONODU were calculated using
water quality data for the waterbody. These ratios were assigned in the
estimation of loading parameters for incremental flow and tributaries for all
land uses, except forest and open water.
• CBOD5/BOD5 ratio used for non point sources was 1.5.
• NH3ODu is equal to 4.57 times the ammonia nitrogen concentration.
• TONODu is equal to 4.57 times the organic nitrogen concentration.
• Background conditions were assumed for forest incremental flow.
Background conditions are typically the following ranges: 2-3 mg/l CBODu,
0.2-1 mg/l NH3ODu, 1-2 mg/l TONODu.
4.1.1. SOD Representation: Sediment oxygen demand (SOD) can be an important part
of the oxygen demand budget in shallow streams. There was no available field SOD
measurements for this waterbody; therefore, SOD data was obtained from the EPA
Region IV’s SOD database. The EPA SOD database represents mixed land uses and
varying degrees of point source activity. An SOD value for a stream with similar
characteristics was chosen from the database and applied to the model for Chase Creek.
An SOD value of 0.05 gm-O2 ft2/day was chosen based on similar bottom characteristics
of sand and gravel.
4.1.2. Calibration Data: From an examination of the available field data (ref: Appendix) it
was determined that there was not an acceptable period or single sample to calibrate the
model. The only D.O. violation occurred during a zero flow sampling event; therefore,
no calibration run was performed.
4.2 Water Quality Model Summary
Prepared by Water Quality Branch/David Thompson 17/28Chase Creek Low D.O./Organic Loading
AL/06030002-190_01
The model reach consisted of 3 segments. The length of the impaired portion is 2.2
miles. A schematic diagram of the model is presented in Figure 4-1. Assumed in-stream
seasonal temperatures are based on historical model development. A guide for use of
ADEM’s TMDL water quality model can be found in the appendix. The guide also
explains the theoretical basis for the physical/chemical mechanisms and principles that
form the foundation of the model.
Figure 4-1. Schematic of the Modeled Reach.
Chase Creek TMDL/DO Sketch
Chase Creek headwaters
EL 810 ft Drainage Area = 0.0 mi2
1 7Q10 = 0cfs
∆h = 90 ft Summer IF = 0.086 cfs
Avg EL = 765 ft
2.0 miles
EL 720 ft
@Hwy. 72 2
∆h = 77 ft 2.2 miles Summer IF = 0.095 cfs
Avg EL = 681 ft
section 2 is the listed segment of Chase Creek
EL 643 ft Acuff Springs 7Q10 = 0.5 cfs
@Acuff Spring 3
∆h = 5 ft 0.7 miles Summer IF = 0.030 cfs
Avg EL = 640 ft
EL 638 ft Flint River
Total Drainage Area = 13.7 mi2
7Q10 = 0.71 cfs
Total length = 4.9 miles
* IF = Incremental Inflow
Prepared by Water Quality Branch/David Thompson 18/28Chase Creek Low D.O./Organic Loading
AL/06030002-190_01
4.2.1. TMDL Critical (Summer) Model
Stream Flow Parameters
Flow D. O. CBODU NH--N TON Temp
Description
(cfs) (mg/l) (mg/l) (mg/l) (mg/l) (oC)
Headwaters 0 6.65 101.60 1.39 10.17 28
Conditions @ Lowest D.O. 0.11 5.00 90.15 1.13 9.57 28
Flow @ End of Model 0.71 5.56 26.04 0.41 2.88 28
Incremental Flow Parameters
CBODU NH3-N TON D. O. Total Flow Temp.
Sections (mg/l) (mg/l) (mg/l) (mg/l) (cfs) (oC)
1 101.60 1.39 10.17 5.45 0.09 28
2 101.60 1.39 10.17 5.45 0.10 28
3 101.60 1.39 10.17 5.45 0.03 28
Prepared by Water Quality Branch/David Thompson 19/28Chase Creek Low D.O./Organic Loading
AL/06030002-190_01
4.3 TMDL Critical Model (Summer) Predictions and
Graphics
Figure 4-2. TMDL Model Predictions.
CBODu vs. Distance TON vs. Distance
120 11
100
CBODu, mg/l
TON, mg/l
8
80
60
5
40
20 2
0 1 2 3 4 5 0 1 2 3 4 5
Distance, miles Distance, miles
NH3-N vs. Distance Dissolved Oxygen vs. Distance
1.6 7
NH3-N, mg/l
1.1 6
DO, mg/l
0.6 5
0.1 4
0 1 2 3 4 5 0 1 2 3 4 5
Distance, miles Distance, miles
Temperature vs. Distance Flow vs. Distance
30 0.8
Temperature, °C
28
0.6
Flow, cfs
26
0.4
24
22 0.2
20 0.0
0 1 2 3 4 5 0 1 2 3 4 5
Distance, miles Distance, miles
Prepared by Water Quality Branch/David Thompson 20/28Chase Creek Low D.O./Organic Loading
AL/06030002-190_01
4.4 Loading Reduction Analysis
• Currently there is no data, which shows any D.O. violation to calculate a needed
reduction.
• Until additional data is collected that shows a D.O violation no reductions will be
required.
4.5 Seasonal Variation
The regulations require that a TMDL be established with consideration of seasonal
variations. Since most D.O. impairments occur during the summer months and not
during other times of the year and no point sources are considered to be significant in the
watershed, a seasonal variation in this TMDL was not necessary. It was assumed that the
summer months would be the critical period.
5.0 Conclusions
A summary of the TMDL for the critical period (summer) is presented in Table 5-1.
Table 5-1. TMDL Summary
CRITICAL TMDL
CBODu Loading
121
(lbs./day)
NBOD Loading
64.2
(lbs./day)
Total Loading
185.2
(lbs./day)
The total loading consists only of load allocations. There are no significant point sources
in this watershed.
6.0 TMDL Implementation
6.1 Non-Point Source Approach
Chase Creek is impaired solely by nonpoint sources. Due to the fact that there was no
D.O. violations during a sampling event, an existing load of pollutants to Chase Creek
was not calculated at this time. In this report only the TMDL for the critical period was
calculated. Until additional data is collected that shows a D.O violation no reductions
Prepared by Water Quality Branch/David Thompson 21/28Chase Creek Low D.O./Organic Loading AL/06030002-190_01 will be required. Collecting additional data will be a major part of the Implementation plan. ADEM will be sampling in the Tennessee River Basin in 2003. Chase Creek will be part of this sampling effort. Once adequate data is obtained the TMDL will be revised to calculate the required reductions, if applicable. For 303(d) listed waters impaired solely or primarily by nonpoint source (NPS) pollutants, necessary reductions will be sought during TMDL implementation using a phased approach. Voluntary, incentive-based mechanisms will be used to implement NPS management measures in order to assure that measurable reductions in pollutant loadings can be achieved for the targeted impaired water. Cooperation and active participation by the general public and various industry, business, and environmental groups is critical to successful implementation of TMDLs. Local citizen-led and implemented management measures offer the most efficient and comprehensive avenue for reduction of loading rates from nonpoint sources. Therefore, TMDL implementation activities will be coordinated through interaction with local entities in conjunction with Clean Water Partnership efforts. The primary TMDL implementation mechanism used will employ concurrent education and outreach, training, technology transfer, and technical assistance with incentive-based pollutant management measures. The ADEM Office of Education and Outreach (OEO) will assist in the implementation of TMDLs in cooperation with public and private stakeholders. Planning and oversight will be provided by or coordinated with the Alabama Department of Environmental Management’s (ADEM) Section 319 nonpoint source grant program in conjunction with other local, state, and federal resource management and protection programs and authorities. The CWA Section 319 grant program may provide limited funding to specifically ascertain NPS pollution sources and causes, identify and coordinate management programs and resources, present education and outreach opportunities, promote pollution prevention, and implement needed management measures to restore impaired waters. Depending on the pollutant of concern, resources for corrective actions may be provided, as applicable, by the Alabama Cooperative Extension System (education and outreach); the USDA-Natural Resources Conservation Service (NRCS) (technical assistance) and Farm Services Agency (FSA) (federal cost-share funding); and the Alabama Soil and Water Conservation Committee (state agricultural cost share funding and management measure implementation assistance) through local Soil and Water Conservation Districts, or Resource Conservation and Development Councils (funding, project implementation, and coordination). Additional assistance from such agencies as the Alabama Department of Public Health (septic systems), Alabama Department of Agriculture and Industries (pesticides), and the Alabama Department of Industrial Relations and Dept of Interior - Office of Surface Mining (abandoned minelands), Natural Heritage Program and US Fish and Wildlife Service (threatened and endangered species), may also provide practical TMDL implementation delivery systems, programs, and information. Land use and urban sprawl issues will be addressed through the Nonpoint Source for Municipal Officials (NEMO) education and outreach program. Memorandums of Agreements (MOAs) may be used as a tool to formally define roles and responsibilities. Prepared by Water Quality Branch/David Thompson 22/28
Chase Creek                                                           Low D.O./Organic Loading
AL/06030002-190_01

Additional public/private assistance is available through the Alabama Clean Water
Partnership (CWP) Program. The CWP program uses a local citizen-based
environmental protection approach to coordinate efforts to restore and protect the state’s
resources in accordance with the goals of the Clean Water Act. Interaction with the state
or river basin specific CWP will facilitate TMDL implementation by providing improved
and timely communication and information exchange between community-based groups,
units of government, industry, special interest groups, and individuals. The CWP can
assist local entities to plan, develop, and coordinate restoration strategies that holistically
meet multiple needs, eliminate duplication of efforts, and allow for effective and efficient
use of available resources to restore the impaired waterbody or watershed.

Other mechanisms that are available and may be used during implementation of this
TMDL include local regulations or ordinances related to zoning, land use, or storm water
runoff controls. Local governments can provide funding assistance through general
revenues, bond issuance, special taxes, utility fees, and impact fees. If applicable,
reductions from point sources will be addressed by the NPDES permit program. The
Alabama Water Pollution Control Act empowers ADEM to monitor water quality, issue
permits, conduct inspections, and pursue enforcement of discharge activities and
conditions that threaten water quality. In addition to traditional “end-of-pipe” discharges,
the ADEM NPDES permit program addresses animal feeding operations and land
application of animal wastes. For certain water quality improvement projects, the State
Clean Water Revolving Fund (SRF) can provide low interest loans to local governments.

Long-term physical, chemical, and biological improvements in water quality will be used
to measure TMDL implementation success. As may be indicated by further evaluation of
stream water quality, the effectiveness of implemented management measures may
necessitate revisions of this TMDL. The ADEM will continue to monitor water quality
according to the rotational river basin monitoring schedule as allowed by resources. In
addition, assessments may include local citizen-volunteer monitoring through the
Alabama Water Watch Program and/or data collected by agencies, universities, or other
entities using standardized monitoring and assessment methodologies. Core management
measures will include, but not be limited to water quality improvements and designated
use support, preserving and enhancing public health, enhancing ecosystems, pollution
prevention and load reductions, implementation of NPS controls, and public awareness
and attitude/behavior changes.

                6.2     Point Source Approach
At the present time there are no significant point sources in this watershed; therefore, no
permit limits will need to be revised.

Prepared by Water Quality Branch/David Thompson                                           23/28
Chase Creek Low D.O./Organic Loading
AL/06030002-190_01
7.0 Follow Up Monitoring
ADEM has adopted a basin approach to water quality management; an approach that
divides Alabama’s fourteen major river basins into five groups. Each year, the ADEM
water quality monitoring resources are concentrated in one of the basin groups. One goal
is to continue to monitor §303(d) listed waters. This monitoring will occur in each basin
according to the following schedule:
River Basin Group Schedule
Cahaba / Black Warrior 2002
Tennessee 2003
Choctawhatchee / Chipola 2004
/ Perdido-Escambia /
Chattahoochee
Tallapoosa / Alabama / 2005
Coosa
Escatawpa / Upper 2006
Tombigbee / Lower
Tombigbee / Mobile
Chase Creek will be a part of the Tennessee River Basin sampling effort in 2003. Once
sufficient data is obtained the TMDL will be revised to calculate the required reductions,
if applicable.
8.0 Public Participation
A thirty-day public notice will be provided for this TMDL. During this time, the
availability of the TMDL will be public noticed, a copy of the TMDL will be provided as
requested, and the public will be invited to provide comments on the TMDL.
Prepared by Water Quality Branch/David Thompson 24/28Chase Creek Low D.O./Organic Loading
AL/06030002-190_01
Appendix 9.1
References
Adkins, J.B., Pearman, J.L.. 1994. Low-Flow and Flow-Duration Characteristics of
Alabama Streams. Water-Resources Investigations Report 93-4186.
Bingham, R.H.. 1982. Low-Flow Characteristics of Alabama Streams. Geological
Survey Water-Supply Paper 2083
United States Environmental Protection Agency. 1991. Guidance for Water Quality-
Based Decisions: The TMDL Process, Office of Water, EPA 440/4-91-00
United States Environmental Protection Agency Region IV Sediment Oxygen Demand
(SOD) Database
Springs in Alabama, Geological Survey of Alabama, Circular 134, 1987
Prepared by Water Quality Branch/David Thompson 25/28Chase Creek Low D.O./Organic Loading
AL/06030002-190_01
Appendix 9.2
Water Quality Data
TVA Macroinvertebrate/EPT and Fish/IBI Biological Data for 1994-95
CU Waterbody Bug EPT Fish IBI Causes Sources
Health Health
706 Chase Cr Poor/Fair 5 Poor 30 siltation, Ag &
nutrients, Urban
org enrich NPS
Prepared by Water Quality Branch/David Thompson 26/28Chase Creek Low D.O./Organic Loading
AL/06030002-190_01
Appendix 9.3
Water Quality Model
Input and Output Files
Prepared by Water Quality Branch/David Thompson 27/28Chase Creek Low D.O./Organic Loading
AL/06030002-190_01
Appendix 9.4
Spreadsheet Water Quality Model (SWQM)
User Guide
Prepared by Water Quality Branch/David Thompson 28/28You can also read