Integrated Water Quality Assessment 2013 - SOUTH EASTERN REGION
←
→
Page content transcription
If your browser does not render page correctly, please read the page content below
Integrated Water Quality Assessment
2013

SOUTH EASTERN REGION
ENVIRONMENTAL PROTECTION AGENCY                                               Monitoring, Analysing and Reporting
The Environmental Protection Agency (EPA) is responsible for                  on the Environment
protecting and improving the environment as a valuable asset                  • Monitoring air quality and implementing the EU Clean Air
for the people of Ireland. We are committed to protecting                       for Europe (CAFÉ) Directive.
people and the environment from the harmful effects of                        • Independent reporting to inform decision making by
radiation and pollution.                                                        national and local government (e.g. periodic reporting on the
                                                                                State of Ireland’s Environment and Indicator Reports).
The work of the EPA can be
divided into three main areas:                                                Regulating Ireland’s Greenhouse Gas Emissions
                                                                              • Preparing Ireland’s greenhouse gas inventories and projections.
Regulation: We implement effective regulation and
environmental compliance systems to deliver good                              • Implementing the Emissions Trading Directive, for over 100
environmental outcomes and target those who don’t comply.                       of the largest producers of carbon dioxide in Ireland.

Knowledge: We provide high quality, targeted                                  Environmental Research and Development
and timely environmental data, information and                                • Funding environmental research to identify pressures,
assessment to inform decision making at all levels.                             inform policy and provide solutions in the areas of climate,
                                                                                water and sustainability.
Advocacy: We work with others to advocate for a
clean, productive and well protected environment                              Strategic Environmental Assessment
and for sustainable environmental behaviour.                                  • Assessing the impact of proposed plans and programmes on
                                                                                the Irish environment (e.g. major development plans).
Our Responsibilities
                                                                              Radiological Protection
Licensing
                                                                              • Monitoring radiation levels, assessing exposure of people in
We regulate the following activities so that they do not                        Ireland to ionising radiation.
endanger human health or harm the environment:
                                                                              • Assisting in developing national plans for emergencies arising
• waste facilities (e.g. landfills, incinerators, waste transfer stations);     from nuclear accidents.
• large scale industrial activities (e.g. pharmaceutical, cement              • Monitoring developments abroad relating to nuclear installations
  manufacturing, power plants);                                                 and radiological safety.
• intensive agriculture (e.g. pigs, poultry);                                 • Providing, or overseeing the provision of, specialist radiation
• the contained use and controlled release of Genetically                       protection services.
  Modified Organisms (GMOs);
• sources of ionising radiation (e.g. x-ray and radiotherapy                  Guidance, Accessible Information and Education
  equipment, industrial sources);                                             • Providing advice and guidance to industry and the public on
• large petrol storage facilities;                                              environmental and radiological protection topics.
• waste water discharges;                                                     • Providing timely and easily accessible environmental
                                                                                information to encourage public participation in environmental
• dumping at sea activities.                                                    decision-making (e.g. My Local Environment, Radon Maps).
National Environmental Enforcement                                            • Advising Government on matters relating to radiological
                                                                                safety and emergency response.
• Conducting an annual programme of audits and inspections
  of EPA licensed facilities.                                                 • Developing a National Hazardous Waste Management Plan to
                                                                                prevent and manage hazardous waste.
• Overseeing local authorities’ environmental
  protection responsibilities.                                                Awareness Raising and Behavioural Change
• Supervising the supply of drinking water by public water                    • Generating greater environmental awareness and influencing
  suppliers.                                                                    positive behavioural change by supporting businesses,
• Working with local authorities and other agencies                             communities and householders to become more resource
  to tackle environmental crime by co-ordinating a                              efficient.
  national enforcement network, targeting offenders and                       • Promoting radon testing in homes and workplaces and
  overseeing remediation.                                                       encouraging remediation where necessary.
• Enforcing Regulations such as Waste Electrical and
  Electronic Equipment (WEEE), Restriction of Hazardous                       Management and structure of the EPA
  Substances (RoHS) and substances that deplete the                           The EPA is managed by a full time Board, consisting of a Director
  ozone layer.                                                                General and five Directors. The work is carried out across five
• Prosecuting those who flout environmental law and damage                    Offices:
  the environment.                                                            • Office of Climate, Licensing and Resource Use
Water Management                                                              • Office of Environmental Enforcement
• Monitoring and reporting on the quality of rivers, lakes,                   • Office of Environmental Assessment
  transitional and coastal waters of Ireland and groundwaters;                • Office of Radiological Protection
  measuring water levels and river flows.                                     • Office of Communications and Corporate Services
• National coordination and oversight of the Water                            The EPA is assisted by an Advisory Committee of twelve
  Framework Directive.                                                        members who meet regularly to discuss issues of concern and
• Monitoring and reporting on Bathing Water Quality.                          provide advice to the Board.
Integrated Water Quality Assessment
for the South Eastern River Basin
District 2013

Published by the Environmental Protection Agency, Ireland

November 2014

Edited by Jean Smith

The collation and summation of data for this report was carried out under the direction of Micheál
Lehane (Programme Manager, Environmental Monitoring and Assessment) within the Office of
Environmental Assessment. The author gratefully acknowledges all EPA colleagues for their input
and contributions to this report.

Disclaimer: Every effort has been made to ensure the accuracy of the material contained in this
publication, however, neither the Environmental Protection Agency (EPA) nor the author(s), accept
any responsibility whatsoever for loss or damage occasioned, or claimed to have been occasioned, in
part or in full as a consequence of any person acting or refraining from acting, as a result of a matter
contained in this publication.

ENVIRONMENTAL PROTECTION AGENCY

An Ghíomhaireacht um Chaomhnú Comhshaoil

PO Box 3000, Johnstown Castle Estate, Co. Wexford, Ireland

Telephone: +353 53 9160600 Fax: +353 53 9160699

Email: info@epa.ie Website: www.epa.ie

LoCall 1890 33 55 99

Regional Inspectorate, Seville Lodge, Callan Road, Kilkenny

ISBN: 978-1-84095-574-3

Cover Photo: River Nore at Kilkenny City

Environmental Protection Agency
Integrated Water Quality Assessment 2013 - SERBD

Contents
1.      Introduction ......................................................................................................................... 2
2.      Physico-Chemical Quality ...................................................................................................... 3
     2.1 Rivers ............................................................................................................................................. 3
        2.1.1 Key Issue: Nutrient Enrichment – Phosphorus (as Ortho-Phosphate) ................................... 3
        2.1.2 Case Study: Banoge River....................................................................................................... 7
        2.1.3 Case Study: River Tay ............................................................................................................. 8
        2.1.4 Key Issue: Nutrient Enrichment – Nitrate (as N) ................................................................... 9
        2.1.5 Case Study: Aghalona River.................................................................................................. 13
        2.1.6 Case Study: Mountrath River ............................................................................................... 14
        2.1.7 Overall Physico-Chemical Assessment of Rivers in SERBD .................................................. 15
     2.2 Lakes............................................................................................................................................ 17
        2.2.1 Key Issue: Nutrient Enrichment – Phosphorus (as Total P) .................................................. 17
        2.2.2 Key Issue: Nutrient Enrichment – Nitrate (as N) .................................................................. 19
        2.2.3 Case Study – Knockaderry Reservoir.................................................................................... 21
        2.2.4 Overall General Physico-Chemical Status of Lake in SERBD ................................................ 22
2.3 Transitional and Coastal Waters ........................................................................................... 23
     2.3.1 Key Issue: Nutrient Enrichment –Trophic Status ..................................................................... 23
     2.4.1 Key Issue: Nutrient Enrichment – Phosphorus and Nitrates .................................................. 26
3.      Biological Assessment ......................................................................................................... 32
     3.1        Rivers..................................................................................................................................... 32
        3.1.1           Key Issue: Macroinvertebrates...................................................................................... 32
        3.2.1           Biological Quality Element ............................................................................................ 36
4       Pressures............................................................................................................................ 38
     4.1 Agriculture................................................................................................................................... 41
     4.2 Urban Waste Water Discharges .................................................................................................. 41
     4.3 Domestic Wastewater Treatment Systems (DWWTS) ................................................................ 43
5        Overall Integrated Quality .................................................................................................. 44
6        References ........................................................................................................................ 46

Environmental Protection Agency                                                                                                              1|Page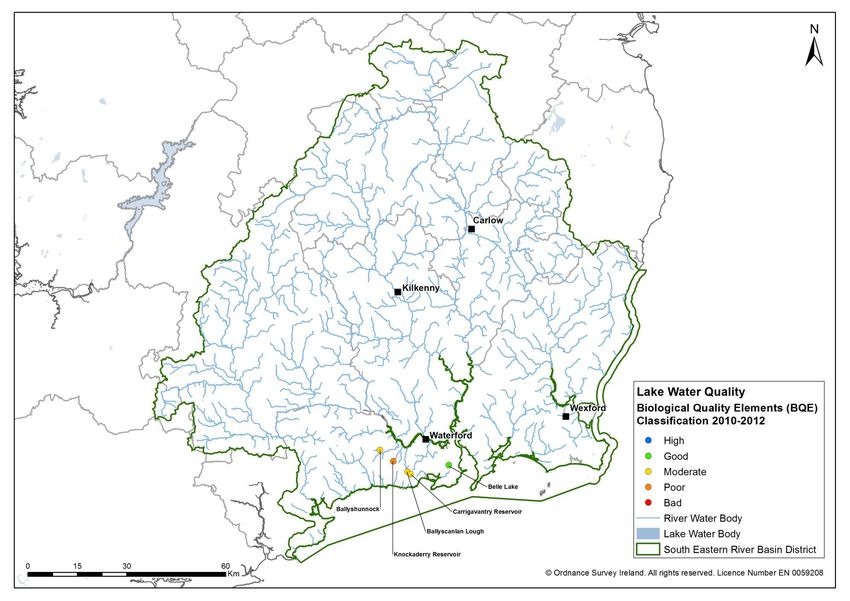
Integrated Water Quality Assessment 2013 - SERBD

1.        Introduction

The South Eastern River Basin (SERBD) is one of Ireland’s largest river basin districts covering
13,000 km2 of land area and a further 1,000 km2 of marine waters. The SERBD covers all of
counties Carlow, Wexford and Kilkenny, most of Waterford, Tipperary and Laois, parts of
Kildare, Offaly and Wicklow and a small part of Limerick and Cork. The main catchments
are the Barrow, Nore and Suir catchments but there are also many smaller catchments.
There are 151 groundwater bodies in the SERBD. These range in size from < 1km2 to 1,400
km2. The SERBD has only five lakes. The largest of these, Knockaderry Reservoir in Co.
Waterford being < 30 hectares. The SERBD is bounded by both the Celtic Sea and the Irish
Sea and shares borders with the Eastern RBD, the South Western RBD and the Shannon
International RBD.

Many of the water bodies in the SERBD are designated protected areas under European and
national legislation (European Union (Natural Habitats) Regulations 1997, Wildlife
(Amendment Act 2000)). The key pressures in the SERBD include agriculture, aquaculture,
discharges from municipal waste water agglomerations, industrial discharges, emissions
from domestic waste water treatment systems and invasive alien species.

This assessment presents the latest monitoring data, an assessment of the data and a focus
on key issues that affect water quality in the SERBD.

The assessment of water quality in the SERBD will be presented using four Key Indicators:

     1.   Physico-Chemical Quality
     2.   Biological Quality
     3.   Pressures
     4.   Overall (Integrated) Quality

Under these headings the key issue is examined and there is a focus on sites of special
interest, where water quality issues need to be addressed.

In addition, the 2013 monitoring data will be made available for download and links will be
available to GIS maps.

Environmental Protection Agency                                                      2|Page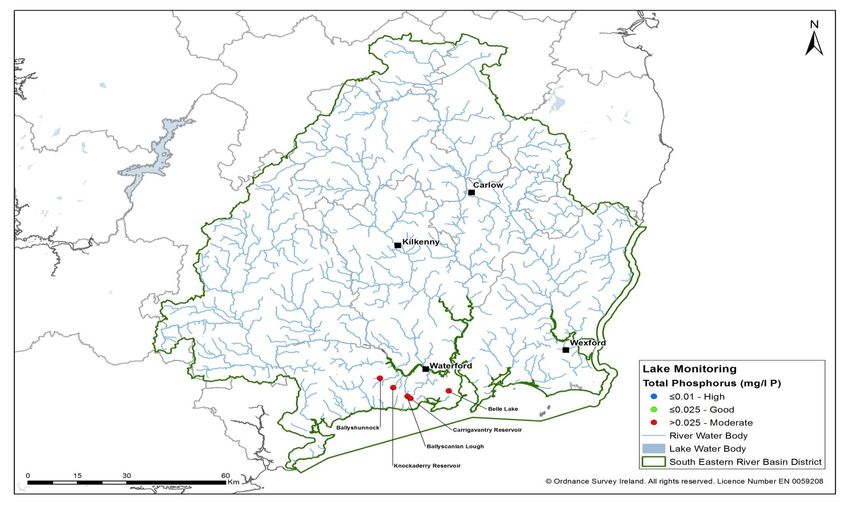
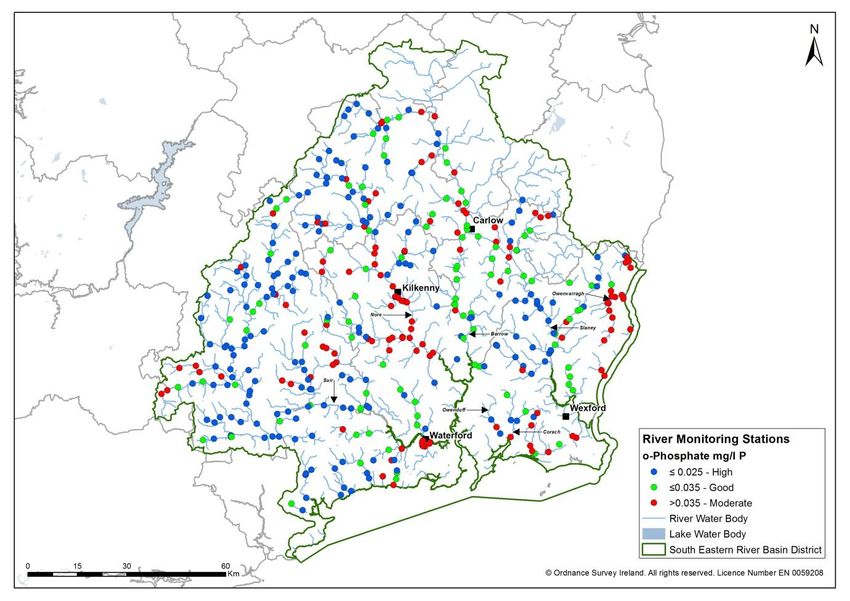
Integrated Water Quality Assessment 2013 - SERBD

2.     Physico-Chemical Quality

2.1 Rivers

2.1.1 Key Issue: Nutrient Enrichment – Phosphorus (as Ortho-Phosphate)

Map 1 below shows the annual average ortho-phosphate concentration in SERBD river
monitoring stations in 2013. This map is based on a comparison of the annual ortho-
phosphate mean against the relevant annual ortho-phosphate EQS (SI 272 of 2009). The
ortho-phosphate EQS standards are: Good ≤0.035 mg/L P and High ≤0.025 mg/L P (SI 272 of
2009).

There are a number of rivers in the SERBD whose annual average exceeds the EQS for
‘Good’ status, however, the majority of rivers in the SERBD meet the EQS standard for ‘High’
Status (
Integrated Water Quality Assessment 2013 - SERBD

  Map 1. Compliance of SERBD river monitoring stations with ortho-phosphate EQS for 2013.

Environmental Protection Agency                                              4|Page
Integrated Water Quality Assessment 2013 - SERBD

Figure 1 shows the relative compliance (High, Good or Moderate) of ortho-phosphate
concentrations at SERBD river stations with respect to the EQS in 2013. Fifty percent (50%)
of river stations in the SERBD are High with 21% Good and 29% Moderate.

          Compliance with Ortho-Phosphate EQS for SERBD River Stations 2013

                        29%
                                                                     High (0.035mg/L)
                          21%

Fig. 1. Compliance with ortho-phosphate EQS for SERBD river stations for 2013.

The overall national picture shows that 27% of river stations are Moderate, 14% Good and
59% High (see Figure 2.2 below). The SERBD falls below the national level for compliance at
high status by 9%, however the good status sites exceed the national compliance level by
7%. The moderate status sites are comparable with the national compliance level.

          Compliance with Ortho-Phosphate EQS for all National River Stations
                                       2013

                                  27%
                                                                                    High
                                                                                    Good
                                              59%
                                  14%                                               Moderate

Fig. 2. Compliance with ortho-phosphate EQS for all national river stations 2013.

Environmental Protection Agency                                                     5|Page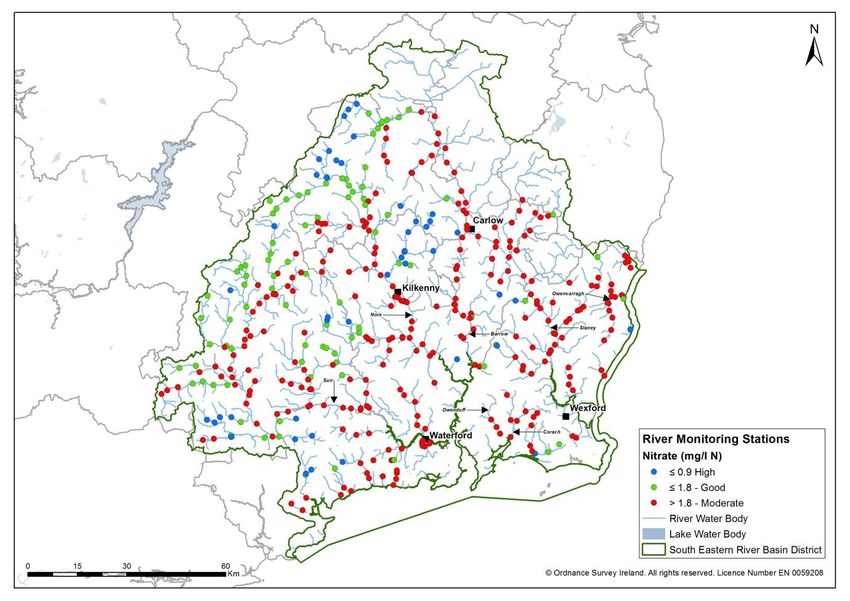
Integrated Water Quality Assessment 2013 - SERBD

The long-term trend for ortho-phosphate for all rivers monitoring stations in the SERBD is
presented in Figure 3. There has been a reduction in ortho-phosphate levels from a high in
2010 with current 2013 levels falling to the lowest values recorded since 2001. The average
ortho-phosphate concentration for all the rivers in the SERBD fall into the ‘Moderate’
category with respect to the EQS for o-phosphate.

                                        Annual Average Ortho-Phosphate Concentrations in SERBD
                                                           Rivers 2001 - 2013
                                0.070
  Mean Ortho-Phosphate (mg/L)

                                0.060
                                0.050
                                0.040
                                0.030                                                    o-Phosphate conc
                                                                                         High/Good
                                0.020
                                                                                         Good/Moderate
                                0.010
                                0.000

                                                            Year

Fig. 3. Long-term trend of ortho-phosphate concentrations at all river monitoring stations in
SERBD.

Environmental Protection Agency                                                                  6|Page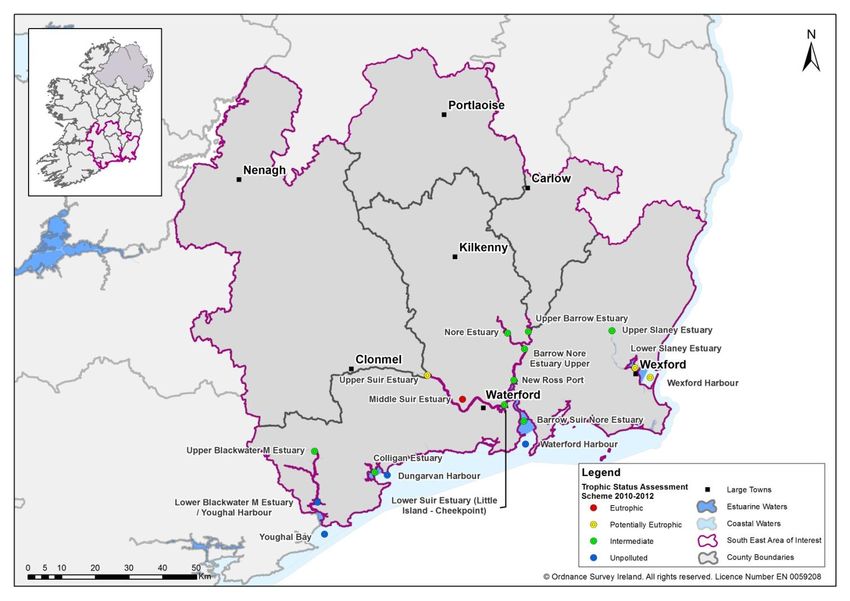
Integrated Water Quality Assessment 2013 - SERBD

2.1.2 Case Study: Banoge River

Figure 4 shows long-term 3-year rolling mean values for ortho-phosphate in the River
Banoge, Co.Wexford at three different stations (0100, 0200, 0300) from 2001 to 2013. This
river was chosen for further long-term assessment as it currently has elevated ortho-
phosphate concentrations at all stations. It displays only Moderate compliance with the
ortho-phosphate EQS at stations 11B02-0200 and 11B02-0300.

                                                                   River Banoge
                                 0.16
   Mean ortho-Phosphate (mg/L)

                                 0.14
                                 0.12
                                  0.1                                                                 11B02-0100
                                 0.08                                                                 11B02-0200
                                 0.06                                                                 11B02-0300
                                 0.04                                                                 High/Good
                                 0.02                                                                 Good/Moderate
                                   0
                                        2006-2008 2007-2009 2008-2010 2009-2011 2010-2012 2011-2013
                                                                   Year

Fig. 4. Long-term 3-year rolling mean values for ortho-phosphate in the Banoge river for
monitoring stations 0100, 0200 and 0300.

Station 0100 was added to the monitoring programme since 2008. It displays ‘Good’
compliance with the ortho-phosphate EQS.             Station 0200 (2 km south of Gorey) and
station 0300 (Br u/s Owenavorragh R confluence) show elevated ortho-phosphate
concentrations throughout the period being assessed. Both of these sites were identified as
sites for further investigation in the EPA’s Integrated Water Quality report for the South East
Region, 2012. The ortho-phosphate concentrations have fallen over the past three cycles
however they are still significantly above the EQS for ‘Good’ status at 0.035 mg/L P. A
noticeable trend is that the level of o-phosphate at station 0300 has been rising relative to
station 0200 in each three year cycle. It was at 50% of the station 0200 ortho-phosphate
level in 2006 - 2008 but in 2011 - 2013 it is 109%.

The key pressure identified for this site is municipal waste water, but there is also tillage
and pasture land upstream of station 0300.

Environmental Protection Agency                                                                             7|Page
Integrated Water Quality Assessment 2013 - SERBD
2.1.3 Case Study: River Tay
Figure 5 shows long-term 3 -year rolling mean values for ortho-phosphate in the River Tay at
three different monitoring stations (0500, 0300 and 0400) from 2007 to 2013. The River
Tay flows through Co. Waterford and into the sea at Stradbally. The monitoring stations are
at Aughnacurra Bridge (0050), the bridge south of Kilminnin (0300) and Stradbally Bridge
(0400).
River Tay
0.04
0.035
Mean o-Phosphate (mg/L)
0.03
0.025 17T01-0050
0.02 17T01-0300
0.015 17T01-0400
0.01 High/Good
0.005 Good/Moderate
0
2007-2009 2008-2010 2009-2011 2010-2012 2011-2013
Year
Fig. 5. Long-term 3-year rolling mean values for ortho-phosphate in the River Tay for
monitoring stations 0050, 0300 and 0400.
This river was chosen as an example of a river with low ortho-phosphate concentrations.
The ortho-phosphate concentrations start to rise from 2007 to 2011 but did not exceed the
‘High/Good’ boundary. From the 2009 - 2011 cycle the ortho-phosphate levels have
dropped further. The level of ortho-phosphate at station 0050 has increased relative to
those at stations 0300 and 0400, however, it is still significantly below the ‘High’ status EQS
value.
Environmental Protection Agency 8|PageIntegrated Water Quality Assessment 2013 - SERBD 2.1.4 Key Issue: Nutrient Enrichment – Nitrate (as N) There is no EQS set for nitrate, however, a surrogate standard was included to maximise the match between the status arising from biological quality elements and the physico-chemical quality elements. Map 2 shows the compliance (High, Good or Moderate) at SERBD river monitoring stations with respect to the surrogate nitrate EQS in 2013. The nitrate surrogate EQS standards are: Good ≤1.8 mg/L N and High ≤0.9 mg/L N. There are few rivers which achieve ‘High’ and ‘Good’ status with respect to the nitrate EQS. These rivers are mainly located along the north-western and western border of the river basin district. The majority of rivers in the SERBD, however, are of ‘Moderate’ status. The rivers which showed the highest annual average concentrations of nitrate in 2013 include the Aghalona, Lerr, Douglas, Chapel Stream, Duncormick and the Burren. Compliance with the surrogate EQS for nitrate in the SERBD does not compare favourably with the national picture. This information is presented as a percentage of the total number of rivers stations within the SERBD in Figures 6 and 7 below. Environmental Protection Agency 9|Page
Integrated Water Quality Assessment 2013 - SERBD

  Map 2. Compliance of SERBD river monitoring stations with the surrogate nitrate EQS for 2013.

Environmental Protection Agency                                               10 | P a g e
Integrated Water Quality Assessment 2013 - SERBD

Figure 6 shows the relative compliance (High, Good or Moderate) of nitrate concentrations
at SERBD river stations with respect to the surrogate EQS in 2013. Sixty eight percent (68%)
of river stations in the SERBD are Moderate with 21% Good status and 11% High status.

                       Compliance with the Surrogate Nitrate EQS for
                                SERBD River Stations 2013

                                    11%
                                                                           High (1.8mg/l)
                         68%

Fig. 6. Compliance with the surrogate nitrate EQS for SERBD river stations for 2013.

Figure 7 below shows the overall national picture where 39% of river stations are Moderate,
23% Good and 39% High. The SERBD falls well below the national level for compliance at
high status and is significantly higher than the national figure for moderate status.
However, the percentage of good status sites in the SERBD is comparable with that at
national level (21% vs 23%).

            Compliance with the Surrogate Nitrate EQS for National Rivers 2013

                          39%              38%                             High (1.8mg/l)

                                  23%

Fig. 7. Compliance with the surrogate nitrate EQS for all national river stations 2013.

Environmental Protection Agency                                                     11 | P a g e
Integrated Water Quality Assessment 2013 - SERBD
The long-term trend for nitrate for all river monitoring stations in the SERBD is presented in
Figure 8. There has been a reduction in nitrate levels from a high in 2006 - 2007 with levels
stabilising over the last 3 years. The average nitrate concentrations for the SERBD are all of
‘Moderate’ status when assessed against the surrogate EQS for nitrate.
Annual Average Nitrate Concentrations in SERBD Rivers
2001 - 2013
4.000
3.500
Mean Nitrate (mg/L)
3.000
2.500
2.000
Nitrate conc.
1.500
High/Good
1.000
0.500 Good/Moderate
0.000
Year
Fig. 8. Long-term trend of nitrate concentrations at all river monitoring stations in SERBD.
Environmental Protection Agency 12 | P a g eIntegrated Water Quality Assessment 2013 - SERBD
2.1.5 Case Study: Aghalona River
Figure 9 shows long-term 3-year rolling mean values for nitrate in the Aghalona River, Co.
Carlow at two different stations (0100 and 0200) from 2006 to 2013.
Aghalona River
12
10
Mean Nitrate (mg/L)
8
14A02-0100
6
14A02-0200
4 High/Good
2 Good/Moderate
0
2006-2008 2007-2009 2008-2010 2009-2011 2010-2012 2011-2013
Year
Fig. 9. Long-term 3-year rolling mean values for nitrate in the Aghalona river for monitoring
stations 0100 and 0200.
This river was chosen for further long-term assessment as it currently has elevated nitrate
concentrations and displays only ‘Moderate’ compliance with the nitrate EQS at both
stations. Both of these sites 14A02-0100 (Friarstown Bridge) and 14A02-0200 (Bridge N of
Moatalusha House) were identified as sites for further investigation in the EPA’s Integrated
Water Quality report for the South East Region, 2012. The suspected causes are due to
diffuse pollution from agriculture and domestic wastewater treatment systems. The nitrate
concentrations reduced slightly for each cycle up to the 2010 - 2012 cycle, however, they
increased marginally in the 2011 - 2013 cycle. The Aghalona had the highest average nitrate
concentrations in Co. Carlow in 2013 with station 14A02-0200 at 9.6 mg/L N and station
14A02-0100 at 8.8 mg/L N.
Environmental Protection Agency 13 | P a g eIntegrated Water Quality Assessment 2013 - SERBD
2.1.6 Case Study: Mountrath River
Figure 10 shows long-term 3-year rolling mean values for nitrate in the Mountrath River at
three different monitoring stations (0080, 0100 and 0300) from 2006 to 2013. The
Mountrath Rive rises in the Slieve Bloom mountains and flows through the town of
Mountrath before joining the River Nore. The monitoring stations are at Roundwood Bridge
(0080), Paddock Bridge (0100) and Forest Bridge (0300).
Mountrath River
2
1.8
1.6
Mean Nitrate (mg/L)
1.4
15N01-0080
1.2
1 15M01-0100
0.8 15M01-0300
0.6
0.4 High/Good
0.2 Good/Moderate
0
2006-2008 2007-2009 2008-2010 2009-2011 2010-2012 2011-2013
Year
Fig. 10. Long-term 3-year rolling mean values for nitrate in the Mountrath river for
monitoring stations 0080, 0100 and 0300.
This river was chosen as an example of a river with low nitrate concentrations. The nitrate
concentrations have been falling with each cycle and stations 0100 and 0300 have been
consistently of ‘Good’ status with station 0080 at ‘High’ status. In the most recent cycle of
2001 - 2013 station 0100 also achieved ‘High’ status relative to the surrogate EQS for nitrate
ofIntegrated Water Quality Assessment 2013 - SERBD 2.1.7 Overall Physico-Chemical Assessment of Rivers in SERBD As part of the determination of the ecological status of a water body, a statistical method has been derived for assessing the physico-chemical results (i.e. nutrient and oxygen concentrations, etc.) to compare with the biological quality elements (e.g. macroinvetebrate and fish populations) for the same water body. This physico-chemical assessment is based on compliance with the EQS for Ortho- Phosphate, Biochemical Oxygen Demand (BOD), Ammonia and Nitrate. This assessment is undertaken in 3 year rolling cycles and the results of the assessment of surveillance rivers in the SERBD are given below in Table 1. All surveillance rivers monitored in the SERBD met the compliance criteria for this statistical assessment. RIVER CODE 2007–2009 2008–2010 2009–2011 2010–2012 2011–2013 BANOGE 11B020300 Pass Pass Pass Pass Pass OWENAVORRAGH 11O010500 Pass Pass Pass Pass Pass CLODY 12C030200 Pass Pass Pass Pass Pass DERRY Wicklow 12D020700 n/a n/a n/a n/a n/a DOUGLAS (BALLON) 12D030200 Pass Pass Pass Pass Pass SLANEY Wicklow 12S020400 n/a n/a n/a n/a n/a SLANEY 12S021800 Pass Pass Pass Pass Pass URRIN 12U010200 Pass Pass Pass Pass Pass DUNCORMICK 13D010350 Pass Pass Pass Pass Pass OWENDUFF (WEXFORD) 13O010100 Pass Pass Pass Pass Pass BARROW 14B011000 Pass Pass Pass Pass Pass BARROW 14B013500 Pass Pass Pass Pass Pass BURREN 14B050100 Pass Pass Pass Pass Pass GOWRAN 14G030300 Pass Pass Pass Pass Pass GREESE Kildare 14G040350 n/a n/a n/a n/a n/a TULLY STREAM Kildare 14T020390 n/a n/a n/a n/a n/a BALLYROAN 15B010200 Pass Pass Pass Pass Pass DININ (NORE) 15D020800 Pass Pass Pass Pass Pass GLORY 15G010200 Pass Pass Pass Pass Pass KING’S (KILKENNY) 15K020800 Pass Pass Pass Pass Pass NORE 15N010300 Pass Pass Pass Pass Pass NORE 15N012400 Pass Pass Pass Pass Pass Environmental Protection Agency 15 | P a g e
Integrated Water Quality Assessment 2013 - SERBD

RIVER                     CODE       2007–2009    2008–2010    2009–2011   2010–2012         2011–2013

NUENNA                  15N020100        Pass         Pass        Pass         Pass             Pass

AHERLOW                 16A010900        Pass         Pass        Pass         Pass             Pass

ANNER                   16A020600        Pass         Pass        Pass         Pass             Pass

ARA                     16A030600        Pass         Pass        Pass         Pass             Pass

DUAG                    16D030100        Pass         Pass        Pass         Pass             Pass

MULTEEN                 16M021100        Pass         Pass        Pass         Pass             Pass

NIER                    16N010100        Pass         Pass        Pass         Pass             Pass

SUIR                    16S020200        Pass         Pass        Pass         Pass             Pass

SUIR                    16S022700        Pass         Pass        Pass         Pass             Pass

COLLIGAN                17C010150        Pass         Pass        Pass         Pass             Pass

MAHON                   17M010350        Pass         Pass        Pass         Pass             Pass

   Table 1. Physico-chemical assessment of Surveillance Rivers in the SERBD.

   Environmental Protection Agency                                                    16 | P a g e
Integrated Water Quality Assessment 2013 - SERBD

2.2 Lakes

2.2.1 Key Issue: Nutrient Enrichment – Phosphorus (as Total P)

Physico-chemical monitoring to meet the requirements of the Water Framework Directive
for the SERBD is undertaken at five sites in Co. Waterford (three lakes and two reservoirs).
These are Ballyscanlon, Ballyshunnock, Belle, Carrigavantry Reservoir and Knockaderry
Reservoir.    There is currently no formal EQS for total phosphorus. The phosphorus
regulations (SI 258 of 1998) set the annual mean target value for total phosphorus at 25
µg/L and this value is used as a guide EQS. The surrogate total phosphorus EQS standards
are: Good ≤0.025 mg/L P and High ≤0.010 mg/L P. Map 3 shows the annual average total
phosphorus in the SERBD lakes in 2013. This map is based on a comparison of the annual
mean against the surrogate EQS for total phosphorus.

All of the lakes in the SERBD fall into the ‘Moderate’ category with annual average total
phosphorus levels in excess of the EQS for ‘Good’ status. The lakes in the SERBD do not
compare favourably with the national picture where 59.6% of all lakes are of ‘High’ status
and only 25.9% of lakes below ‘Good’ status. This information is shown in Figures 11 and
12 below.

                                                                      High -
Integrated Water Quality Assessment 2013 - SERBD Map 3. Annual average total phosphorus in SERBD lakes in 2013. Environmental Protection Agency 18 | P a g e
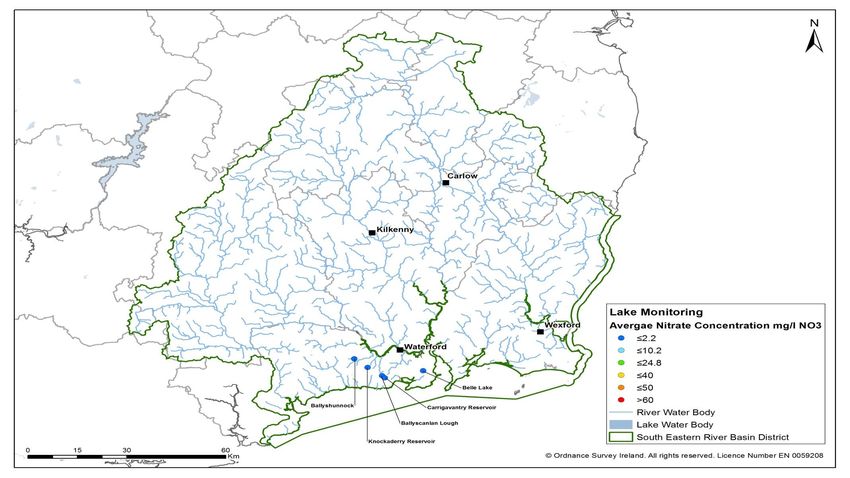
Integrated Water Quality Assessment 2013 - SERBD

2.2.2 Key Issue: Nutrient Enrichment – Nitrate (as N)

Nitrate levels in the SERBD lakes have been monitored over many years and while there is at
present no nitrate EQS, it still important to assess the concentration of nitrate present.
Both Knockaderry Reservoir and Ballyshunnock Lake have higher nitrate levels than the
other three lakes in the SERBD. The level of nitrate in both Knockaderry and Ballyshunnock
had been decreasing in recent years, however, 2012 saw an increase in nitrate levels in both
lakes. The downward trend was again observed in 2013 with levels not only decreasing but
falling below 2012 levels. The nitrate level in both Knockaderry Reservoir and
Ballyshunnock lake in 2013 was < 2.2 mg/L N.

Ballyscanlon, Belle and Carrigavantry lakes have significantly lower levels of nitrate than
both Knockaderry and Ballyshunnock. The levels of nitrate in these lakes showed a slight
increase on 2012 levels, but levels in all three lakes remain < 1mg/L N.

Map 4 shows the annual average nitrate concentration in SERBD lakes in 2013.

Environmental Protection Agency                                                    19 | P a g e
Integrated Water Quality Assessment 2013 - SERBD

  Map 4. Annual average nitrate in SERBD lakes in 2013.

Environmental Protection Agency                           20 | P a g e
Integrated Water Quality Assessment 2013 - SERBD

2.2.3 Case Study – Knockaderry Reservoir
Knockaderry Reservoir is located in Co. Waterford. It is a shallow lake and is very sensitive
to low levels of nutrients. Diffuse pollution is the main pressure and a reduction in the
amount of nutrients entering Knockaderry Reservoir is essential to improving the quality of
the lake. Knockaderry Reservoir is designated as an operational monitoring site for the
Water Framework Directive (WFD).

The 3 year rolling trend for Knockaderry Reservoir over the period of the WFD cycle shows
that total phosphorus levels were at their highest in the most recent 3 year cycle. There
had been a decrease in the levels of total phosphorus in Knockaderry reservoir in 2012,
however, this was reversed in 2013 and the average over the 3 years is more than double
the level of the EQS for ‘Good’ status. The average total phosphorus concentration in
Knockaderry Reservoir has consistently exceeded the surrogate total phosphorus EQS for
‘Good’ status of 0.025 mg/L P.

                                          Knockaderry Reservoir
                                  0.070
      Total Phosphorus (mg/L P)

                                  0.060
                                  0.050                                        Average Total
                                  0.040                                        Phosphorus
                                  0.030                                        High/Good
                                  0.020
                                  0.010                                        Good/Moderate
                                  0.000

                                                 Year

Fig. 13. Long-term 3-year rolling mean values for total phosphorus in Knockaderry Reservoir,
Co. Waterford.

There is no EQS for nitrate in lakes, however, it is promising to see that there is a general
downward trend in the levels of nitrate in Knockaderry Reservoir with levels in 2013
reaching their lowest since the start of the WFD monitoring in 2007.

Environmental Protection Agency                                                  21 | P a g e
Integrated Water Quality Assessment 2013 - SERBD
Knockaderry Reservoir
2.00
Nitrate (mg/L N)
1.50
1.00
0.50 Average Nitrate
0.00
Year
Fig. 14. Long-term 3-year rolling mean values for nitrate (as N) in Knockaderry Reservoir,
Co. Waterford.
2.2.4 Overall General Physico-Chemical Status of Lake in SERBD
As part of the determination of the ecological status of a lake, a statistical method has been
derived for assessing the general physico-chemical results of lake samples. These are then
compared with the biological quality elements of a lake to derive the overall ecological
status of the lake.
This general physico-chemical (GPC) status was assigned to SERBD lakes by assessing
Oxygenation Status, Nutrient Conditions Status, Acidification/Alkalisation Status, Thermal
Status and Specific Pollutants. Compliance is rated as High, Good, Moderate, Poor or Bad.
The GPC status for all five lakes in the SERBD is Moderate. The lakes have been of Moderate
status since the advent of the WFD monitoring. The results of this assessment for all lakes
monitored in the SERBD are presented in Table 2.2 below.
Lake Name Lake Code 2007 - 2009 2008 - 2010 2009 - 2011 2010 - 2012 2011 - 2013
Ballyscanlon SE_16_460 Moderate Moderate Moderate Moderate Moderate
Ballyshunnock SE_16_463 Moderate Moderate Moderate Moderate Moderate
Belle SE_17_5 Moderate Moderate Moderate Moderate Moderate
Carrigavantry Moderate Moderate Moderate Moderate Moderate
Reservoir SE_17_8
Knockaderry Moderate Moderate Moderate Moderate Moderate
Reservoir SE_16_294
Table 2. General physico-chemical status of SERBD lakes.
Environmental Protection Agency 22 | P a g eIntegrated Water Quality Assessment 2013 - SERBD
2.3 Transitional and Coastal Waters
2.3.1 Key Issue: Nutrient Enrichment –Trophic Status
The EPA has been monitoring and assessing the water quality of estuaries and coastal
waters since the early 1990s. Following the introduction of the WFD, the monitoring
programme has intensified and the EPA now monitors over 120 water bodies up to four
times per year, once in winter and three times in summer. In addition to more traditional
trophic-status monitoring (nutrients, chlorophyll and oxygen), the assessment now covers a
wide range of biological elements such as seaweeds, phytoplankton and seagrass. This
holistic ecological assessment is an essential part of the WFD, and in conjunction with
programmes run by the Marine Institute and Inland Fisheries Ireland, a comprehensive
overview of the ecological status of Ireland’s tidal waters environment can now be provided.
The transitional (estuaries) and coastal waters of the SERBD cover an area of just over 1,000
km2 and comprise tidal freshwater rivers (e.g. the upper Suir and Slaney estuaries), partially
mixed estuaries (e.g., the middle Suir), transitional lagoons (e.g. the North and South Slob
channels), tidally mixed and seasonally stratified coastal waters (e.g. Waterford Harbour and
the Eastern Celtic Sea, respectively).
Transitional and coastal water bodies are monitored for the following parameters: salinity,
temperature, pH, turbidity, secchi depth, dissolved oxygen, biochemical oxygen demand
(BOD), total oxidised nitrogen (TON), total ammonia, dissolved inorganic nitrogen (DIN),
ortho-phosphate and chlorophyll ɑ.
The trophic status of these waters is assessed using the EPA’s Trophic Status Assessment
Scheme (TSAS) which captures the cause-effect relationship of the eutrophication process
and considers the following:
Enrichment of waters by nutrients (dissolved inorganic nitrogen and phosphorus)
Accelerated algal growth (phytoplankton and opportunistic macroalgae)
Undesirable disturbance (oxygen content)
Trophic status assessments are based on the analysis of data collected over a period of 3
years, and each water body assessed is categorised as eutrophic, potentially eutrophic,
intermediate or unpolluted with respect to nutrient enrichment.
Priority substances are also monitored and details of this programme, which is undertaken
by the Marine Institute, are available at http://hdl.handle.net/10793/635.
The rivers of the south east deliver some of the highest nutrient loadings nationally. For
example, in 2011 the combined loading of nitrogen, as total nitrogen, and phosphorus, as
Environmental Protection Agency 23 | P a g eIntegrated Water Quality Assessment 2013 - SERBD
total phosphorus, from the Blackwater, Suir, Barrow, Nore and Slaney rivers, was 24,300
and 524 tonnes, respectively, representing just under 25 % of the national total for both
nutrients. A trend assessment of nutrient loadings from these rivers between 1990 and
2010 indicates a statistical downward trend in total phosphorus and total ammonia in all
five rivers.
In terms of point sources, five of the ten largest waste water treatment plants in the SERBD
discharge directly to tidal waters. The largest discharge of over 190,000 p.e. from
Waterford City discharges into the lower Suir estuary.
The latest trophic status assessment indicates that the middle Suir estuary is eutrophic,
while a further three areas, the lower Slaney estuary and Wexford Harbour and upper Suir
estuary are potentially eutrophic. In terms of ecological status, as defined under the WFD, of
the 18 water bodies assessed, ten were found to be ‘moderate or worse’, seven were
‘good’, and one was ‘high’.
Of the 16 estuarine and coastal water bodies in the south east assessed in the latest period,
one was classed as eutrophic, three as potentially eutrophic, eight as intermediate and four
as unpolluted. This compares unfavourably with the national average as can be seen from
Table 3 below:
Trophic Status South east (%) National (%)
Eutrophic 6 7
Potentially Eutrophic 19 8
Intermediate 50 28
Unpolluted 25 57
Table 3. Trophic status of south eastern water bodies.
Environmental Protection Agency 24 | P a g eIntegrated Water Quality Assessment 2013 - SERBD Map 5: Trophic Status of Transitional and Coastal Waters in the South-East in 2012 Environmental Protection Agency 25 | P a g e
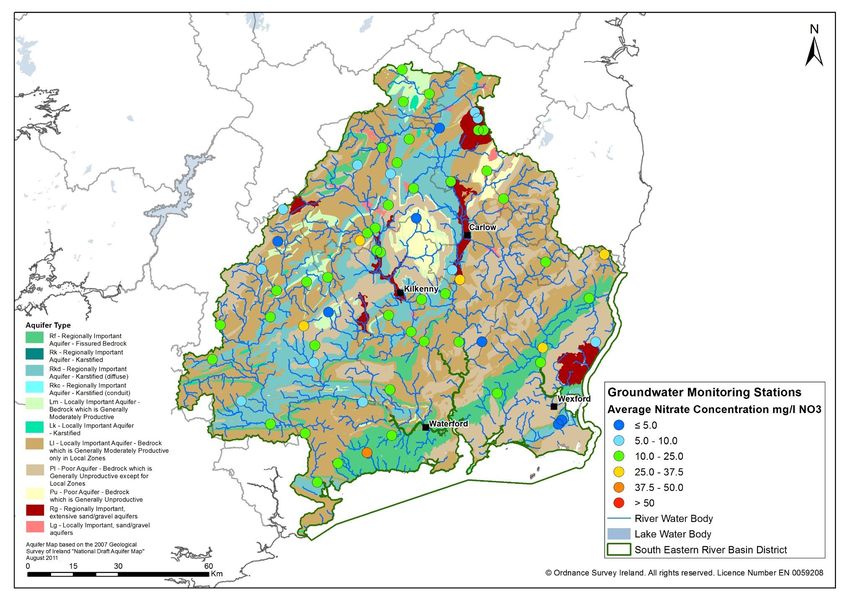
Integrated Water Quality Assessment 2013 - SERBD

2.4 Groundwater

2.4.1 Key Issue: Nutrient Enrichment – Phosphorus and Nitrates

Groundwater, which originates from rain that soaks into the ground, is an important natural
resource in Ireland. It flows through and is stored in the fractures in bedrock and the pore
spaces of sand and gravel deposits. In the past the focus was on its use as drinking water;
however, under the WFD there is an increased emphasis on the environmental quality of
groundwater, as well as its value as a potable water supply. Groundwater plays an essential
role in the hydrological cycle and is critical for maintaining river levels and surface water
ecosystems. In many Irish rivers, more than 30% of the flow is derived from groundwater,
rising to 90% in periods of low flow. Therefore, the quality of groundwater can have a major
impact on the quality of river water.

In Ireland approximately a quarter of all public and private drinking water supply is from
groundwater. Most of the private group schemes and small supplies are reliant on
groundwater and many have inadequate treatment. Therefore, it is critical that
groundwater is protected to maintain the quality of drinking water and ensure the water is
safe to drink without the requirement for excessive levels of treatment.

In 2013 the Environmental Protection Agency’s groundwater monitoring programme
included 64 monitoring locations in the SERBD. These sites were monitored for a variety of
physico-chemical and microbiological parameters. Nitrate and ortho-phosphate, two of the
main indicators of anthropogenic pollution from diffuse and small point sources, were
measured and these are discussed in more detail in Section 2.4.1.1 and 2.4.1.2.

In 2009, during the first river basin management plan (RBMP) cycle, two groundwater
bodies in the SERBD were identified as being at poor status because of industrial/urban
activities that resulted in contaminated land (Waterford City and Mullinavat A). A further
two groundwater bodies in the SERBD were identified as being at poor quantitative status
due to the impact of an abstraction associated with a road cutting that reduced regional
groundwater flows to Pollardstown Fen (Pollardstown Fen and the Curragh).

2.4.1.1 Ortho-Phosphate in Groundwater

Map 6 shows the locations and the associated average ortho-phosphate concentrations in
2013 for the groundwater monitoring points in the SERBD.

Environmental Protection Agency                                                  26 | P a g e
Integrated Water Quality Assessment 2013 - SERBD

Map 6. Average ortho-phosphate concentrations in the SERBD in 2013.

Environmental Protection Agency                                       27 | P a g e
Integrated Water Quality Assessment 2013 - SERBD

Figure 15 summarises the average yearly ortho-phosphate concentrations from 2007 - 2013
for the groundwater monitoring programme in the SERBD.

                                                            Phosphate (mg/L P)
                           100%
                                        90%
                                        80%
                                                                                               >0.05
                                        70%                                                    0.035 - 0.05
                                        60%                                                    0.025 - 0.035
                                        50%                                                    0.015 - 0.025
                                        40%                                                    ?0.015

                                        30%
                                        20%
                                        10%
    Perce ntage of M onitori ng Sites

                                        0%
                                              2007   2008   2009   2010   2011   2012   2013
                                                              Sample Period

Fig. 15. Average ortho-phosphate concentrations in groundwater in the SERBD.

The average ortho-phosphate concentration at groundwater monitoring locations in the
SERBD has declined slightly over the period 2007 - 2013. There was a decrease in 2013 with
average concentrations >0.015 mg/L P at 19% of monitoring locations compared with 30.2%
of monitoring locations in 2012, and the proportion of monitoring locations with average
concentrations >0.015 mg/L P in 2013 is comparable to the period 2009 - 2011 (15.9 -
17.5%). In 2013 6.3% of sites had average concentrations above the Irish WFD Threshold
Value concentration of 0.035 mg/L P (considered when assessing the contribution of ortho-
phosphate in groundwater to rivers).

A number of factors may have influenced the overall reduction in average ortho-phosphate
concentration including reductions in inorganic fertiliser, improvements in storage for
organic fertiliser and the implementation of landspreading restrictions as part of the Good
Agricultural Practice Regulations.

2.4.1.2 Nitrate in Groundwater

Nationally, the south and south east of the country continue to have the greatest
proportion of monitoring locations with elevated nitrate concentrations; with agricultural
practices the probable cause (McGarrigle et al. 2010). Map 7 shows the locations and the
associated average nitrate concentrations in 2013 for the groundwater monitoring points in
the SERBD.
Environmental Protection Agency                                                                 28 | P a g e
Integrated Water Quality Assessment 2013 - SERBD Map 7. Average nitrate concentrations in the SERBD in 2013. Environmental Protection Agency 29 | P a g e
Integrated Water Quality Assessment 2013 - SERBD

Figure 16 summarises the average yearly nitrate concentrations from 2007 to 2013 for the
groundwater monitoring programme in the SERBD.

                                                                  Nitrate (mg/L NO3)
                                     100%
                                              90%
                                              80%
                                              70%
                                                                                                         > 50
                                              60%                                                        37.5 - 50
                                              50%                                                        25 - 37.5
                                              40%                                                        10 - 25

                                              30%                                                        5 - 10
                                                                                                         37.5 mg/L
NO3 at only one monitoring point in 2013. An average nitrate concentration of < 25 mg/L
NO3 was found at 90.6% of monitoring locations in 2013, which is a significant improvement
when compared to 2007.

A number of factors may have influenced the overall reduction in average nitrate
concentration including reductions in inorganic fertiliser applications, improvements in
storage for organic fertiliser and the implementation of landspreading restrictions as part of
the Good Agricultural Practice Regulations. Above average rainfall in 2008 - 2009 and the
resultant increase in dilution (particularly in 2009) also contributed to a noticeable decrease
in the average nitrate concentration in 2009.

Environmental Protection Agency                                                                        30 | P a g e
Integrated Water Quality Assessment 2013 - SERBD 2.4.2 Groundwater Summary It is important that groundwater is protected to maintain the quality of drinking water and so that the groundwater contribution to ecosystems, including rivers, is of good quality. While nitrate concentrations in groundwater in the SERBD have been decreasing overall, they remain high relative to the rest of the country, and a similar reduction in nitrate concentrations is seen in the rivers. There has also been a slight decrease in ortho- phosphate concentrations over the period, however, the relatively static picture highlights the importance of continuing with programmes of measures to ensure that overall nutrient loss to groundwater of nitrates and ortho-phosphates is minimised. Environmental Protection Agency 31 | P a g e
Integrated Water Quality Assessment 2013 - SERBD
3. Biological Assessment
3.1 Rivers
3.1.1 Key Issue: Macroinvertebrates
Biological assessment of rivers is generally carried out on a 3 year cycle. Assessment for the
purposes of this report is based on the macroinvertebrate biological survey. In the overall
assessment for WFD status at surveillance sites, in addition to macroinvertebrates, other
biological elements, i.e. plants (macrophytes), algae (including diatoms) and fish as well as
hydromorphological and chemical criteria, are taken into account.
Relationships between water quality and macroinvertebrate community structure are
usually described by means of a numerical scale of values. The EPA scheme of Biotic Indices
or Quality (Q) Values and its relationship to WFD status is set out in Table 4.
Where a toxic effect is apparent or suspected the suffix '0' is added to the biotic index (e.g.
Q1/0, Q2/0, etc.) and attention is sometimes drawn to siltation or atypical effects by
appending an asterix to the biotic index (e.g. Q1*, Q2*, etc.). The Q rating assessment has
been adapted to meet the requirements of the WFD and to ensure it is comparable with
methods used in other EU countries.
Table 4. Reference table for WFD status and Q value.
Q Value WFD Status
5, 4-5 High
4 Good
3-4 Moderate
3, 2-3 Poor
2, 1-2, 1 Bad
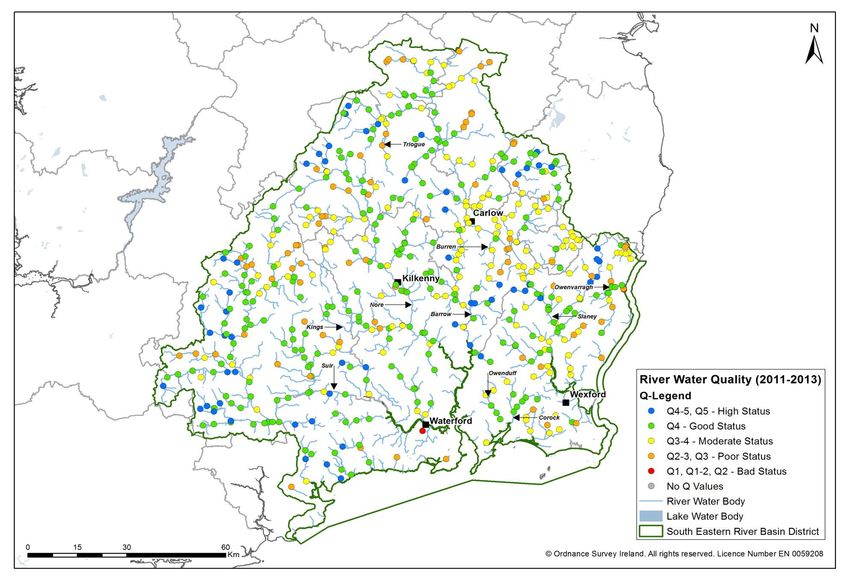
Map 8 below shows the most recent WFD biological classification of rivers in the south east.
These biological assessments were carried out in the period 2011 - 2013.
Environmental Protection Agency 32 | P a g eIntegrated Water Quality Assessment 2013 - SERBD Map 8. Biological classification (High, Good, Moderate, Poor, Bad) of SERBD rivers for the period 2011 – 2013. Environmental Protection Agency 33 | P a g e
Integrated Water Quality Assessment 2013 - SERBD

Table 5 below gives the breakdown of the monitored sites in the SERBD by their biological Q
status following assessment in the period 2011 - 2013.

                                                         Number of River
        Q Value               WFD Status                                         %
                                                         Monitoring Sites
                                                                                11.1
         5, 4-5                     High                       61
                                                                                43.9
           4                        Good                       241
                                                                                29.1
          3-4                  Moderate                        160
                                                                                14.9
         3, 2-3                     Poor                       82
                                                                                 0.9
        2, 1-2, 1                   Bad                         5

Table 5. Breakdown of sites in the SERBD by biological Q Value status.

There are no sites in the SERBD of Q5 status. Sixty-one sites in the SERBD were designated
as High status sites and 241 sites were classified as Good status. Therefore, 55% of the river
monitoring locations (302 sites) in the SERBD are classified as good or better. There were
82 sites (15.0%), which were classified as Poor status and 5 sites (0.9%), which received a
classification of bad status. This is portrayed graphically in Figure 17 below.

                    SERBD % Compliance with Biological Q Values
                                           0.9%

                                              11.1%
                                  15.0%
                                                                                     High
                                                                                     Good
                                                                                     Moderate
                            29.1%                                                    Poor
                                                      43.9%
                                                                                     Bad

Fig. 17. Percentage compliance of SERBD sites with biological Q values.

The SERBD falls below the national average percentage for sites which are of Good status or
better. This also means that the SERBD has more sites at Moderate, Poor and Bad status
than the national average.

Environmental Protection Agency                                                   34 | P a g e
Integrated Water Quality Assessment 2013 - SERBD
In 2010–2012 nationally there were 18.3% of sites at High status with 65% of all sites
classified as Good status or better.
National % Compliance with Biological Q Values
0.4%
14.4% 18.3%
High
Good
20.2% Moderate
Poor
46.7% Bad
Fig. 18. Percentage compliance of national river sites with biological Q values.
Environmental Protection Agency 35 | P a g eIntegrated Water Quality Assessment 2013 - SERBD
3.2 Lakes
3.2.1 Biological Quality Element
The biological monitoring programme for the operational monitoring lakes is undertaken by
the EPA once every 3 years as biological communities typically exhibit longer response times
to gradual changes in their environment.
A number of biological tools have been developed specifically to meet the requirements of
the WFD and enable each lake to be assigned High, Good, Moderate, Poor or Bad status.
Each biological quality element is assigned status separately and the results are combined
using the “one-out-all-out” approach to produce biological status. In the “one-out-all-out”
approach, status is determined by the element with the lowest status. The same approach
is adopted for assigning GPC status. Biological status is combined with GPC status using
“one-out-all-out” to produce ecological status. High ecological status is dependent upon
agreement between the biological and physico-chemical status. Additionally, a lake is not
considered to be at High status if it contains the invasive alien species zebra mussel or
roach; or if it has significant morphological alterations to its shoreline or a regulating
structure on its outflow.
The GPC status, the biological quality elements (BQE) status and the overall ecological status
for the most recent period 2010–2012 for the WFD monitored lakes in Waterford are
presented in Table 3.3. All five lakes monitored in the SERBD were classified as Moderate
or worse for ecological and GPC status. This reflects the relatively high nutrient levels in
lakes in the south east.
2010 - 2012 2010 - 2012 2010 - 2012
LAKE SEG_CD
Status for GPC Status for BQE Ecological Status
Ballyscanlan 16_460 Moderate Moderate Moderate
Ballyshunnock 16_463 Moderate Moderate Moderate
Belle 17_5 Moderate Good Moderate
Carrigavantry Reservoir 17_8 Moderate Moderate Moderate
Knockaderry Reservoir 16_294 Moderate Poor Poor
Table 6. Biological and ecological status of lakes in south east Ireland.
Map 8 shows the biological classification (BQE status) of SERBD lakes for the period 2010–2012.
Knockaderry Reservoir is of Poor status. All the other lakes are of Moderate status.
Environmental Protection Agency 36 | P a g eIntegrated Water Quality Assessment 2013 - SERBD Map 8. Biological classification (BQE status) of lakes in the SERBD for the period 2010–201 Environmental Protection Agency 37 | P a g e
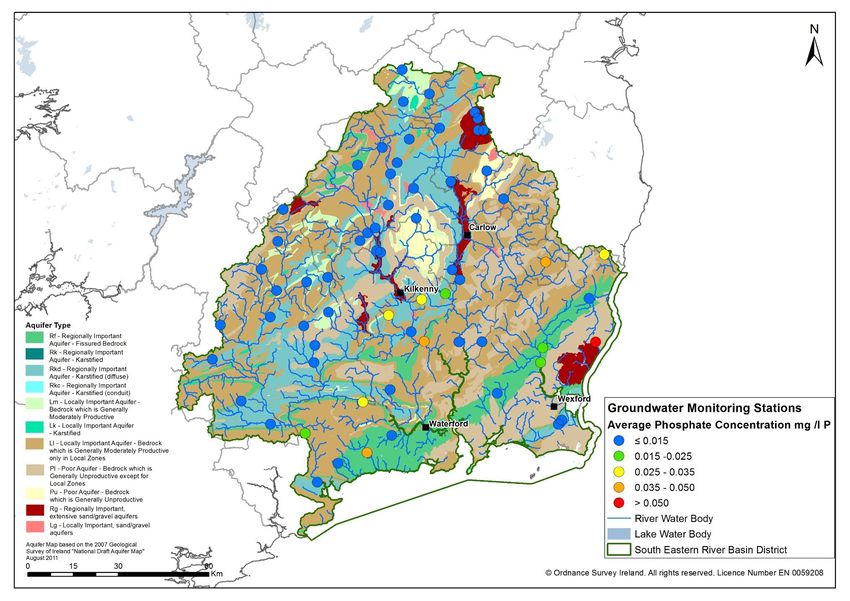
Integrated Water Quality Assessment 2013 - SERBD

4      Pressures

The causes of water pollution, or pressures, fall into two categories, point source pressures
and diffuse pressures. Point source pressures are where the pollution arises from a well-
defined point. Diffuse source pollution arises from diffuse areas in a catchment and can be
more difficult to determine than point source pressures.

The SERBD is predominantly rural and diffuse pollution from agriculture combined with
other small point sources such as domestic wastewater treatment systems (DWWTS) and
farmyards are significant pressures. The main pressures in the urban areas tend to be point
source pressures, such as discharges from wastewater treatment plants, industrial
discharges and storm water overflows. Other point source pressures include landfill
discharges, Section 4 licenced discharges and abstraction points for drinking water. In many
cases, the cause of pollution may not be due to one single pressure but a combination of
several pressures.

One hundred and forty-three river sites in the SERBD have been identified as sites requiring
further investigation. These sites have undergone biological assessment and have Q values
of less than Q4 (less than Good status), or other issues of concern have been identified at
the site. The reasons for pollution at these sites are varied, with agriculture and sewage
being the most common. The sites are individually listed in the relevant county reports
along with the suspected cause of pollution.

Table 7 below indicates the number and percentage of stations impacted by each suspected
cause of pollution.

Map 9 shows the key point pressures in the south east, along with the sites identified for
further investigation in the SERBD region (sites with biological classification of less than
Good status).

Environmental Protection Agency                                                  38 | P a g e
Integrated Water Quality Assessment 2013 - SERBD

  Suspected       County    County      County    County      County       County     Total    %
  Pressure
                  Carlow    Kilkenny    Laois     Tipperary   Waterford    Wexford

    Agriculture      24         19         17          27          3          19        109     42.7%
   Aquaculture                                         1                                 1      0.4%
     DWWTS           2                     1                                   1         4      1.6%
    Hydro-
                                                       3                                 3      1.2%
   morphology
     Industrial      4          2          2           9                                17      6.7%
      Landfill       1                                             1                     2      0.8%
   Mixed Rural
                     10         8          8           10          1           8        45      17.6%
   Influences

     Siltation       4          1                                              1         6      2.4%
   Urbanisation      5          4          3           5           1           2        20      7.8%
      Urban
                     10         7          7           11          3          10        48      18.8%
    wastewater

Table 7. Suspected causes of pollution for SERBD river stations with biological classification of
less than Good status (Q value of
Integrated Water Quality Assessment 2013 - SERBD Map 9. Key point source pressures in the SERBD and river sites identified for further investigation. Environmental Protection Agency 40 | P a g e
Integrated Water Quality Assessment 2013 - SERBD

4.1 Agriculture
The south east of Ireland is predominately rural and agriculture is the most significant
pressure on water quality (See Table 4.1 above). Diffuse pollution from agriculture, such as
nutrient runoff from land combined with other small point sources such as domestic
wastewater treatment systems (DWWTS) and farmyard runoff are significant pressures.
These pressures result in significant levels of phosphorus and nitrogen being discharged to
waters. This leads to eutrophication in the rivers and lakes with artificially increased weed
and algal growth in many rivers having an adverse effect on the aquatic fauna.

Legislation through the Nitrates Directive (SI 610 of 2010) is the main measure for
addressing agricultural pollution. These regulations also provide statutory support for good
agricultural practice to protect waters against pollution. Although there have been
decreases in the phosphorus and nitrogen concentrations in the SERBD water bodies, the
average levels in SERBD rivers and lakes are still above the EQS values. A third national
Nitrate Action Plan (NAP) to achieve compliance with the Nitrates Directive is currently
being implemented. The NAP includes limits on farm stocking rates, limits for nitrogen and
phosphorus application rates, prohibited spreading periods, minimum storage
requirements, requirements regarding maintenance of green cover in tillage lands and set
back distances from waters. An effective inspection and enforcement regime is needed to
ensure full compliance with the Nitrates Directive.

The targets set by Food Harvest 2020, to increase agricultural output, will provide welcome
economic development, but will also pose significant challenges in meeting the
requirements of the WFD. Food Harvest 2020 aims to increase output in the dairy sector in
the region by up to 50%.          Building this capacity while maintaining environmental
sustainability is a significant challenge for the agriculture sector and a cohesive plan
incorporating all stakeholders is essential. Improved awareness and support within local
communities will be key to the implementation of this initiative and ensuring that Ireland
meets its objectives for the Water Framework Directive.

4.2 Urban Waste Water Discharges

Municipal waste water discharge is another of the main sources of pollution in the SERBD. In
accordance with the requirements of the Waste Water Discharge (Authorisation)
Regulations, 2007 (SI 684 of 2007), the EPA is responsible for the licensing or certification of
all discharges to the aquatic environment from sewerage systems owned, managed and
operated by water service authorities. Up to the end of 2013, 63 urban waste water
discharge licences and 168 certs of authorisation had been issued in the SERBD (see Table 8
below). In 2013, 20 UWWD licences were issued to plants located in the SERBD; these are
shown in Table 9.

Environmental Protection Agency                                                     41 | P a g e
Integrated Water Quality Assessment 2013 - SERBD

                 RBD              No. of Licenses Issued       No. of Certs of
                                                             Authorisation Issued

                SERBD                      63                         168

Table 8. Number of UWWD licences and certs of authorisation issues by end of 2013 in the
SERBD.

           County                 Agglomeration                   Licence No.
           Kilkenny               Johnstown                        D0401-01
           Kilkenny               Freshford                        D0526-01
           Kilkenny               Goresbridge                      D0529-01
           Kilkenny               Fiddown                          D0528-01
           Kilkenny               Ballyhale/Knocktopher            D0530-01
           Kilkenny               Bennettsbridge                   D0400-01
           Kilkenny               Kilkenny City                    D0018-01
           Kilkenny               Castlecomer                      D0149-01
           Laois                  Ballinakill                      D0384-01
           Tipperary              Thurles                          D0026-01
           Tipperary              Mullinahone                      D0456-01
           Tipperary              Limerick Junction                D0457-01
           Waterford              Stradbally                       D0353-01
           Waterford              Baile na nGall                   D0358-01
           Wexford                Rosslare Strand                  D0173-01
           Wexford                Kilmore Quay                     D0232-01
           Wexford                Taghmon                          D0389-01
           Wexford                Tagoat                           D0397-01
           Wexford                Ballycanew                       D0402-01
           Wexford                Camolin                          D0405-01

Table 9. UWWD licences issued in 2013 in the SERBD.

Under the Water Services Investment programme (WSIP) a number of the country’s waste
water treatment plants (WWTPs) have been upgraded with improved treatment and
associated reduction in nutrients in the final effluent. However, approximately one-fifth of
the sites identified for further investigation in the SERBD list WWTPs as a contributory
pressure to water quality. Several WWTPs in the south east persistently fail to meet the
quality and/or sampling standards required with WWTPs listed as a suspected source of
pollution in 48 of the sites identified for further investigation. These sites were in counties

Environmental Protection Agency                                                     42 | P a g e
You can also read