SEAWATER DESALINATION COSTS - WHITE PAPER - WATEREUSE
←
→
Page content transcription
If your browser does not render page correctly, please read the page content below
Seawater Desalination Costs
 White Paper
 September 2011; Revised January 2012

The WateReuse Desalination Committee's White Papers are living documents. The intent of the Committee is to enhance the
content of the papers periodically as new and pertinent information on the topics becomes available. Members of the
desalination stakeholder community are encouraged to submit their constructive comments to white‐papers@watereuse.org
and share their experience and/or case studies for consideration for inclusion in the next issuance of the white papers.
WATEREUSE ASSOCIATION
                                       DESALINATION COMMITTEE

                                        Seawater Desalination Costs

                                                 White Paper

I       Introduction

One of the most sensitive and critical aspects of any water project is cost. For membrane desalination,
decreasing costs and producing superior water quality are among a number of significant reasons why this
technology continues to be the water treatment technology of choice in the United States and around the
world. This white paper serves to: provide an overview of cost drivers and components of the desalination
process; present costs associated with desalination compared to other water supply alternatives; discuss
challenges and perceptions; and highlight recent advances in desalination technology that affect the total
delivered cost of water.

Although membrane desalination was first commercialized in the United States in the late 1960’s, reverse
osmosis membrane technology was not widely implemented until the 1980’s, largely due to the relatively
high costs compared to other potable water treatment alternatives. Why have these costs decreased or
appeared more reasonable and competitive over time? Although there are a number of reasons, the
reduction in costs are primarily related to improvements in manufacturing methods, the changing facets of
the regulatory environment in the United States, the increased market demand and competition for
membranes, and the gradual depletion of more conventional groundwater sources.

Since the early 1990’s, one example of the successful implementation of reverse osmosis desalination
technology is its designation as a “best available technology” (BAT) by the United States Environmental
Protection Agency (US EPA) for removal (and/or reduction) of numerous inorganic contaminants (e.g.,
antimony, arsenic, barium, fluoride, nitrate, nitrite, boron, selenium, radionuclides), endocrine disrupting
compounds (e.g., synthetic and natural hormones), and several pharmaceutical compounds.

Together with a reduction in the membrane technology costs beginning in the 1980’s, BAT designation
became one other (albeit significant) technical component to consider in the process of developing and
potentially implementing a desalination facility. Other decision factors are rooted in both technical and non-
technical components of water supply projects such as timing, available space, and other specific locally-
driven concerns. However, the determination of meaningful costs associated with membrane (including
seawater membrane) desalination has proven a bit more elusive when applied without consideration of site
specific issues or how the costs compare with other viable, reliable, and long-term water supply alternatives
in the same locale.

Seawater Desalination Costs                                                                            Page 1
For many years, planners have used tools generally available in the marketplace to determine relative
costs for desalination. Most costing models for desalination plants have been developed by agencies such
as the US EPA and the US Department of the Interior. Engineering consultants have contributed select
project cost experience gained from their clients or from trade journals and publications; and although this
information can be very helpful, the data can at times be either too generalized or too project site-specific to
be particularly helpful to project planners for specific guidance or to those interested in gauging costs
compared to their particular project or environment.

A consolidated list of representative examples includes:

         1. In 1979, the US EPA published Estimating Water Treatment Costs. This document is still used
            by some industry professionals as a reference guide to compute cost estimates for
            pretreatment, post-treatment, and conventional treatment technologies.
         2. Previous to the US EPA document, the Department of the Interior developed in 1967 and 1969
            the Guideline for Uniform Presentation of Desalting Costs Estimates (Research and
            Development Progress Report No. 264), which is sometimes still referenced yet, by today’s
            standards, appears quite dated.
         3. In 1999, the Department of the Interior’s Bureau of Reclamation developed the Water
            Treatment Evaluation Routine program and manual (based on the US EPA Estimating Water
            Treatment Costs).
         4. In 2003 and updated in 2008, a Water Treatment Cost Estimation Program was jointly
            developed by I. Moch & Associates and the Bureau of Reclamation (WT Cost II©)1 to estimate
            costs and is partially based on updated cost curves generated by the US EPA (Estimating
            Water Treatment Costs, EPA-600/2-79-162a, EPA-600/2-79-162b, EPA-600/2-79-162c,
            August 1979) and is an upgraded version of the WaTER (Water Treatment Estimation Routine)
            excel spreadsheet developed by the Bureau of Reclamation in 1999.
         5. In 2009, Global Water Intelligence2 developed a desalination cost estimation program available
            on their website for reference by professionals interested in capital, operations and
            maintenance costs associated with desalination plants.

The water treatment industry continues to work towards standardization; however, there is no single
resource or programming tool to capture all of the particular nuances materially affecting Seawater Reverse
Osmosis (SWRO) facility costs.

Some of the above referenced models look at the cost of the technology in a “stand-alone” fashion, while
others consider the impacts associated with other ancillary factors which can be site-specific. Costing
sources are one tool in the planner/designer’s toolbox, and a typical planning approach could incorporate
use of computer programs, established cost curves, other bid costs for comparison, and similar applications

1 Moch, I., Querns, W, M., and Steward, D.; WT Cost II, Desalination and Water Purification Research and Development Program
Report No. 130, February 2008.
2 GWI/DesalData Cost Estimator: www.desaldata.com.

Seawater Desalination Costs                                                                                         Page 2
for comparison purposes. Therefore, it is important to gain a comprehensive understanding of the costs
associated with desalination when utilizing these models or developing the costs for desalination projects.
Additionally, common sense is necessary when using these tools insofar as a particular project may have
some unique components that cannot be modeled in a computer program alone. In any given situation,
water industry planners, managers, and engineers can best serve the needs of the water stakeholder
community through an awareness of the design and expected operating conditions of the proposed water
treatment plant, as well as the validity and accuracy of the costing sources.
II Cost Trends
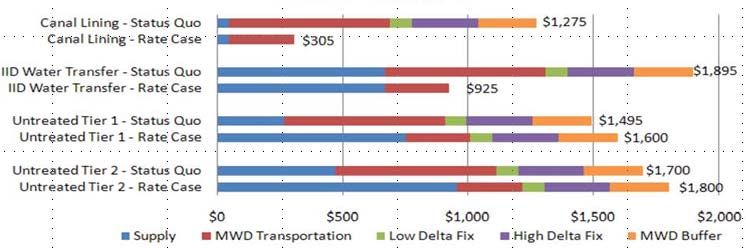
The unit costs for desalination processes have fallen considerably over the last three decades3. Figure 1
further exemplifies the downward trend4.
Figure 1
SWRO Cost Trend5
* Water costs for San Diego, Monterey, Perth, Sydney, and Barcelona
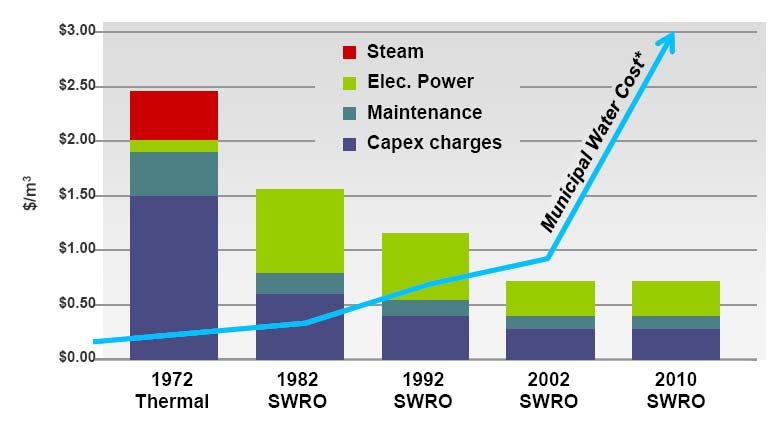
As shown in Figure 2, there is also an economy of scale cost-benefit associated with increasing plant
capacity to effectively lessen membrane desalination plant unit construction costs.
3 Zhou, Y., and R. S. J. Tol (2005), Evaluating the Costs of Desalination and Water Transport, Water Resources Res., 41, W03003,
doi:10.1029/2004WR003749.
4 Tom Willardson, CFO: Energy Recovery Incorporated reference presentation material, February 24, 2011.
5 Ibid.
Seawater Desalination Costs Page 3Figure 2
Unit Construction Cost vs. Capacity6
The historic downward trend of the cost of desalination is generally associated with technology
improvements such as improved SWRO membrane performance and significant advances in the ability to
recover more energy from the desalination process. However, considering other unassociated factors,
Figure 3 shows that the costs have remained flat in recent years (even in consideration of increased
production capacities) and, in a few cases, trended upwards. Identification of the various key project
components that make up costs, as described in Section III, explains this trend and the drivers behind
facility costs and the cost to supply water to end-users.
6 Wilf, M., Awerbuch, L., Bartels, C., Mickley, M., Pearce, G., Voutchkov, N., 2007. The Guidebook to Membrane Desalination
Technology: Reverse Osmosis, Nanofiltration and Hybrid Systems Process Design, Applications and Economics. Balaban
Publishers, Rehovot, Israel.
Seawater Desalination Costs Page 4Figure 3
SWRO Cost Trends, Annualized7
III Project Capital Cost Drivers
What drives the overall cost of a desalination facility? The individual, categorical factors causing and
contributing to the overall cost of a project are largely the same regardless of the project. However, the
magnitude of these factors can vary significantly amongst differing projects and, therefore, result in cost
differences. Figure 4 shows the cost categories associated with a SWRO desalination project.
7 Courtesy of Water Desalination Report; Presented at the Texas Innovative Water Workshop, San Antonio, Texas, October 11,
2010.
Seawater Desalination Costs Page 5Figure 4
Cost Categories Contributing to SWRO Projects8
The level of accuracy desired with cost estimates is dependent on the end purpose of using the estimate
and the degree of effort invested. The AACE categorizes the level of effort in five estimate classes9.
Using an AAC-defined assumption that the conceptual screening process has been completed (Class 5; -
20% to -50% low to +30% to +100 high), the potential impact that each cost category in Figure 4 should be
assessed in order to gain a reasonable understanding of the associated, overall capital and operating
costs.
A. Selection of Intake and Concentrate Discharge
Feed water intake configuration directly affects capital and operational costs of the treatment process. For
example, open intake costs will represent approximately US$ 0.5 – 1.5MM per MGD and up to US$ 3.0MM
per MGD for complex tunnel and offshore intake systems. Without consideration for the cost of land
associated with each option, beach well intakes are usually less costly on an equipment basis. However,
once land acquisition and easements are factored into the process, this intake type is typically 40 to 50%
more costly than an open intake of similar capacity. Horizontal and slant wells are comparable to open
intake (yet more costly than co-located open intakes using existing infrastructure), and infiltration galleries
typically cost more than open intakes. Of all the intake options, only open intakes have the longest-running
8 Dietrich Consulting Group, LLC.
9 AACE International Recommended Practice No. 18R-97. Cost estimate classification system-as applied in engineering,
procurement, and construction for the process industries.
Seawater Desalination Costs Page 6installation history and reliability necessary to support the full-scale development of a large desalination facility at a new site. As a result, there is a significant depth of understanding related to the costs associated with constructing open intakes as well as the associated discharge pipeline. The intake and feed water source selection cost impact is demonstrated in Figure 3. In Australia, for example, costs for newly constructed intake/outfall structures can approach a third of the total project cost (based on distance to the facility and related infrastructure costs) and are much more expensive than the proposed 50 MGD Carlsbad, California seawater desalination project, largely due to this project’s access to the adjacent power plant intake and discharge infrastructure. Alternatively, for the proposed 50 – 150 MGD Camp Pendleton project, which is currently in the development phase with the San Diego County Water Authority (SDCWA), cost estimates approach US$ 1.3B to US$ 1.9B (2009 constant dollars) for Phase 1 that incorporates dedicated intake and outfall structures approximately 2-miles offshore, and 13 miles of conveyance pipeline. This is more than two times the construction cost of the Carlsbad facility10. Few SWRO facilities exist employing an intake type differing from the conventional open-intake. This lack of available installations for use as a qualitative benchmark for costing same-site alternatives is important for planners and engineers focused on process considerations and/or cost comparisons. However, published information is limited and can be site-specific. Generalized guidance is contained in Table 1. Source types range from beach wells to open-ocean intakes. 10 Lopez, Cesar (SDCWA): “Camp Pendleton SWRO Feasibility Study”, AMTA Annual Conference and Exposition, San Diego, CA, July 12, 2010. Seawater Desalination Costs Page 7
Table 1
              Comparative Water Quality, Cost, and Reliability from Various Intake Types

                                                                    Relative
                               Relative Cost   Relative Intake
                                                                  Pretreatment
          Intake Type           (for equal         Space                                 Reliability
                                                                     Space
                                capacity)      Requirements
                                                                  Requirements
                                                                  Theoretically      Variable based on
         Beach Wells               Low              High
                                                                      Less          subsurface lithology
          Horizontal
                                                                   Theoretically
      Directional-Drilled        Medium             High                                 Unknown
                                                                      Less
             Wells
                                                                   Theoretically
         Radial Wells            Medium             High                                 Unknown
                                                                      Less
     Constructed Seabed                                            Theoretically
                                   High           Medium                                 Unknown
      / infiltration Gallery                                          Less
      Submerged Open
                               Medium-Low           Low                More                 High
            Intake
       Surface – Open
                                   Low              Low                More                 High
            Intake
      Co-located Intake            Low              Low                More                 High

By definition, the reverse osmosis desalination process creates two flow streams at a ratio of approximately
50:50. The “concentrate” stream is about twice as salty as the feed water.

Various methods are available to dispose of the concentrate stream, and the availability of alternatives will
vary due to many site-specific variables. With that consideration, conveyance alternatives and a range of
costs associated with each alternative are contained in Table 2. The costs do not include conveyance
attributable to connecting the desalination plant to the disposal location (in the case of discharge to the
ocean, this would be from the desalination plant to the shore line) because the conveyance distance,
terrain, and associated costs are site-specific and highly variable, and this conveyance cost can dominate
disposal costs.

Seawater Desalination Costs                                                                            Page 8
Table 2
Concentrate Disposal Costs11
Construction Cost
Disposal Method
(US$ MM / MGD) (US$ MM /acre-foot/day)
New Outfall w/Diffusers 2.0 – 5.5 0.7 - 1.8
Power Plant Outfall 0.2 – 0.6 0.07 - 0.20
Sanitary Sewer 0.1 – 0.4 0.03 - 0.13
WWTP Outfall 0.3 – 2.0 0.1 - 0.7
Deep Well Injection 2.5 – 6.0 0.8 - 2.0
Evaporation Ponds 3.0 – 9.5 1.0 - 3.1
Zero-Liquid Discharge 5.5 – 15.0 1.8 - 4.9
Regarding cost trends and the upward spikes observed in the most recent Australian SWRO projects in
Figure 3, the plant discharges were located in the vicinity of marine habitats with high sensitivity to elevated
salinity (compared to those encountered by the US projects). These designs resulted in the need to build
complex concentrate discharge diffuser systems, with costs, in most cases, exceeding 30% of the total
desalination project expenditures. By comparison, most of the desalination plants yielding the lowest water
production costs have concentrate discharges either located in coastal areas with very intensive natural
mixing or are combined with power plant outfall structures which use the buoyancy of the warm power plant
cooling water to provide accelerated initial mixing and salinity plume dissipation at lower cost. The intake
and discharge facility costs for these plants are usually less than 10% of the total desalination plant costs,
which is much less significant compared to the US projects’ cost estimates as a total percentage of costs.
B. Feed and Finished Water Quality
The type of pretreatment system and type of pretreatment technology selected are very dependent on the
feed water quality. Because open ocean feed water (compared with well water, for example) will typically
contain a greater level of suspended material and impurities that could possibly foul a reverse osmosis
membrane, the capability of the pretreatment necessary to suitably pre-condition the feed water is crucial to
11 Adapted from Wright and Missimer, 1997.
Seawater Desalination Costs Page 9ensure a long, sustainable membrane service life. For example, some coastal well water supplies and certain open ocean sources are generally expected to contain very low levels of foulants and particulates; therefore, a lesser-degree of pretreatment may be warranted. It is important to keep this point in context, because suspended material content (e.g., iron, sulfur, manganese) of coastal ocean locations is site- specific and could eliminate the potential benefit of a lesser-degree of pretreatment and the associated capital and operational costs. Typical costs associated with pretreatment will range from US$ 0.5MM to US$ 1.5MM per MGD. The lower range of costs is representative of a conventional single-stage media filtration system, which is a technology that has been in service treating public water supplies since the 1700’s. Costs will increase as additional pretreatment process steps are added, such as two-stages of media filters, or media filtration followed by a micro- or ultrafiltration membrane system which approaches the higher end of the cost range. Additionally, as with any seawater desalination project, the feed water temperature, source water “cleanliness” (such as suspended biomass or turbidity), and ambient salinity fluctuations also affect project costs. For example, if a SWRO facility planned along the Northern California coast treats seawater that is on average 10 degrees colder than a SWRO facility located in Southern California, the necessary feed pressure would increase 10 to 15% over the warmer water to achieve the equivalent production value, thereby increasing energy consumption and associated operating costs. Base-line costs for the desalination component of a facility usually range from US$ 1.5MM to US$ 4.0MM/MGD. The lower range of costs represents a single stage, single pass SWRO system which is capable of reliably meeting a TDS of less than 450 mg/L. Individual analyte concentration limitations such as boron or chloride (for horticultural water quality purposes) can also affect costs, because at very low concentration limits an additional membrane treatment step might be necessary. If this is the case, additional costs associated with producing a lower TDS product water will increase from 15 to 30% of the cost of the single stage, single pass system. Table 3 contains relative finished water treatment costs within the fence line of a desalination facility compared to base-line desalination system costs. Seawater Desalination Costs Page 10
Table 3
                          Target Finished Water Quality and Relative Cost; $MM/MGD

                                                                      Operation and
       Target Finished Water              Construction                                           Cost of Water,
                                                                  Maintenance Costs,
              Quality                   Costs, $MM/MGD                                            $MM/MGD12
                                                                       $MM/MGD
     TDS:Cl = 50013:250 mg/L            1.0                       1.0                         1.0
     Boron = 1 mg/L
     TDS:Cl = 250:100 mg/L              1.15 – 1.25               1.05 – 1.10                 1.10 – 1.18
     Boron = 0.75 mg/L
     TDS:Cl = 100:50 mg/L               1.27-1.38                 1.18-1.25                   1.23-1.32
     Boron = 0.5 mg/L
     TDS:Cl = 30:10 mg/L                1.40-1.55                 1.32-1.45                   1.36-1.50
     Boron = 0.3 mg/L

C. Distribution
Throughput (or “production”) capacity of a desalination facility (as with any other type of production facility)
affects the size and number of the equipment needed, as well as the space necessary to locate a treatment
plant. Coastal communities utilizing desalination as a source of drinking water are usually in close proximity
to the treatment facility; therefore, land is usually priced at a premium. The cost of locating a facility closer
to the point of use and a suitable power source should be weighed against the costs associated with
additional intake and discharge pipeline easements, transmission line costs, materials used for
construction, permits, labor, and maintenance associated with moving a plant farther away from an
intake/discharge or distribution service area. By material cost alone, a 20-mile distribution system delivering
50 MGD could increase by 15 to 30% of total project capital costs (or more) when compared to a 2-mile
pipeline based on available easements, rights of-way, and existing subsurface utilities.

The project sites in Australia are between 10 and 50 miles from the points of delivery, and, in the case of
the 66 MGD Sydney SWRO facility, the cost of the product water delivery system was greater than the cost
of the SWRO treatment plant (Plant cost $7.80/kgal14; US$ 586MM15 vs. US$ 490MM). The cost
breakdown is also similar for the Melbourne, Australia plant.

D. Permitting and Regulatory Issues
The regulatory landscape differs vastly in the communities served by desalination facilities. These
differences can have a profound impact on project delivery timelines, legal costs, and in some cases alter
the design of the SWRO facility. Without question, each country has its own set of environmental criteria
which must be met by any single project. And in consideration of laws in the United States, each State and

12 Dietrich Consulting Group, LLC.
13 500 mg/L drinking water quality limitation is a United States EPA Secondary Water Quality Standard.
14 Water Desalination Report, Volume 46, Issue 29, August 2, 2010.
15 Water Desalination Report, Volume 46, Issue 16, April 26, 2010.

Seawater Desalination Costs                                                                                       Page 11
region has its own set of rules, regulations, and standards, all of which conform to federal laws and guidelines while potentially being more restrictive, and usually related to site-specific nuances. For example, permitting costs for the Tampa, Florida 25 MGD SWRO project are estimated to have been US$ 2.5MM – US$ 5MM while permitting costs for 10 – 50 MGD projects in California can exceed US$ 10MM –20MM. Permitting costs can also be bracketed by project complexity. For low-complexity projects, the permitting cost is 0.5 to 3.5% of the total capital cost of SWRO projects. For high-complexity projects, permitting is estimated at 4.5 to 5.0% of the total project capital costs. Finally, actual permitting costs will also depend on degree of membrane piloting or demonstration work (if necessary), extent of local/state permit hearings, and Federal CWA Section 401/404 offshore permitting, as applicable16. Whereas Australia has invested upwards of US$ 13 billion in numerous large-scale desalination projects producing 500 MGD over the last six years, the US has only been successful at bringing online one 25 MGD SWRO desalination facility in Tampa, FL at US$ 150MM. Additionally, major California projects such as Carlsbad and Huntington Beach have taken over 11 years to develop and permit, mainly due to permitting challenges and land use considerations. E. Project Delivery Mechanism A number of project delivery methods and financing tools have proven to be successful in the SWRO desalination industry. The size of the project, expected contract duration, location, competition, risk allocation, and project (owner) preferences all dictate by what means the project is delivered. For example, the combination of large capacity SWRO facilities, enhanced competition, and owner preferences for low- risk have enabled the design- build- own- operate (DBOOT) project delivery community to commission SWRO projects at an exceptionally low all-inclusive cost of US$ 800 – US$ 1,000/ac-ft. in North Africa. Without exception, the lowest cost desalination projects to date have been delivered under turnkey DBOOT contracts where private sector developers or consortia share risks with the public sector based to their ability to control and mitigate the respective project related risks. A contributing cause to the lower costs are that the insurance and contingencies in DBOOT contracts are between 10 and 20% of the total capital cost of the project; whereas similar costs for the more traditional project design/bid/build projects can be higher. One other delivery method, recently applied to large SWRO projects in Australia, is the Owner-Engineer- Contractor “Alliance” approach. The alliance model is an alternative means to further minimize and isolate the owner risks involved in procuring large-scale desalination plants. The alliance model incorporates a two-stage bidding process involving selection of qualified private sector companies and then engages the top-two companies in a competitive project development phase (which is paid for by the owner). Although the risk and reward mechanisms between the owner and engineer/contractor are negotiable, the insurance and contingency premiums are historically more than 30% of the total project costs. 16 Wilf, M., Awerbuch, L., Bartels, C., Mickley, M., Pearce, G., Voutchkov, N., 2007. The Guidebook to Membrane Desalination Technology: Reverse Osmosis, Nanofiltration and Hybrid Systems Process Design, Applications and Economics. Balaban Publishers, Rehovot, Israel. Seawater Desalination Costs Page 12
F. Other Associated Costs
Other associated project costs include proximity to a power supply, the availability of skilled labor, and
environmental mitigation. These cost impacts may be the result of market conditions or issues unknown
during the conceptual design process. For example, the overlapping schedules of the series of large
Australian SWRO projects created a temporary shortage of skilled labor, which in turn resulted in an
increase in unit labor costs. Because skilled labor expenditures can consume up to 50% of the construction
costs, a facilities’ construction cost can increase by 20% or more.

In several instances involving Spanish desalination projects, substantial project delays were caused by the
inability of the local power company to install power substations and transmission lines; or, the receiving
water authority did not adequately plan system integration and distribution pipelines for the product water,
thereby substantially increasing the total project costs. This has also been a challenge in some regions of
South Africa.

IV      Capital Cost Breakdown

Costs associated with a desalination plant can be annualized to provide a frame of reference to the total
cost of water produced, and in some cases, delivered to the actual point of use for each particular project.
These annualized costs can be quite complex and are based on a number of variables including the
amount financed, interest rate, loan period, inflation, depreciation, plant utilization, and more. For a frame of
reference, the typical annualized costs for seawater desalination projects vary widely from US $2.00/1,000
gallons (kgal) to $12.00/kgal. The higher end of the cost range is associated with smaller capacity plants
(less than 1 MGD), because economies of scale cannot be realized, or can be attributed to site-specific
intake, discharge, and conveyance. If the intake, discharge, and conveyance components are removed
from the annualized cost, the range narrows from US $2.00/kgal to approximately $6.00/kgal. By
comparison, the range for brackish water membrane desalinating processes (BWRO) is US $0.40/kgal to
$4.00/kgal.

Because of the potentially wide-ranging cost differences between projects, unit cost contributions
associated with the overall plant cost can be clarified by breaking down plant costs by contribution type. For
example, as seen in Figure 5, the intake and discharge costs associated with construction are
approximately 10 to 12% of the total plant costs. Please note that Figure 5 is an example of typical project
plant costs, and site specific cost contributions associated with key components such as the unit cost of
power, distance for distribution, and labor, for example, will alter the ratio accordingly.

Seawater Desalination Costs                                                                            Page 13
Figure 517
                               Typical SWRO Plant Construction Cost Breakdown

V        Operation and Maintenance Cost Breakdown

All drinking water production facilities require operational attention and regular maintenance to ensure a
long, productive and efficient plant. A typical design lifespan for a water production facility is 20 to 30-years,
based on the size of the facility; financial terms and arrangements; and procurement method (such as
BOOT, DBO, D-B, etc.). However, regardless of procurement type, the typical plant operation and
maintenance costs (O&M) are associated with the parameters described in Table 4.

17 Dietrich Consulting Group, LLC.

Seawater Desalination Costs                                                                             Page 14
Table 4
Operation and Maintenance Parameters for Desalination Plants (Typical Example)18
Cost Association Parameter Percentage of
Total O&M Costs
Maintenance Instruments 6%
Pump upkeep
Facility upkeep including intake pipeline pigging
Minor equipment replacement
Video/CCTV intake/wells and associated cleaning
Legal/Permitting Environmental monitoring 2%
Permit compliance
Operations Labor 6%
Sludge and solids waste disposal 4%
Bar rack and band screen solids waste disposal
Cartridge Filters and RO Membrane 11%
Replacements
Power (Energy) 55%
Chemicals 6%
Other Related 10%
Some examples of the sub-components contributing to the total percentage of O&M costs contained in
Table 4 are affected by locale. Trends such as increasing power; solid waste disposal, or increases in
chemical costs would shift the allocation. Regarding power, typical costs for labor and power associated
with water treatment production are 45% (labor) and 25% (power) higher in California, compared to Florida
or Texas.
VI Cost Comparison with Other Water Supply Alternatives – a California Perspective
The cost of desalinated water has decreased significantly over the last two decades; and, all indicators are
that the costs associated with the technology will continue to decrease as technology and efficiencies
improve. However, similarly sized facilities do not always offer comparative costs for a number of reasons,
including feed water and finished water quality goals, intake type, and distance to service area. All of these
factors can have a marked effect on the overall cost of water. The importance of understanding these
differences cannot be overemphasized when describing costs related to various desalination projects and
treating different source waters.
Although there is only one large-scale seawater desalination facility in the United States, those that are in
the planning and budgetary cost stage appear to be highest in California compared to the majority of the
United States. Due to the large number of plants under consideration in California compared to the rest of
the country, the cost warrants further discussion. The cost of desalination in California is relatively higher
than that of traditional low-cost water sources (groundwater and river water), as well as water reclamation
18 Dietrich Consulting Group, LLC.
Seawater Desalination Costs Page 15and reuse for irrigation and industrial use purposes. In fact, the cost of traditional local groundwater water supplies in some parts of the state is as “low” as US $0.50/1,000 gallons ($160/AF, annualized). However, the quantity of such low-cost sources is very limited (less than 30% of the water resources statewide), and water quality has become an issue in certain areas. In California, many water agencies have embarked on exploring seawater desalination because of the diminishing capacities of fresh surface and ground water. Most of the water utilities in Southern California currently purchase imported water from the Bay Delta and Colorado River at a rate of US $2.30 to $2.45/1,000 gallons ($750 to $800/AF), and the cost of these water supplies is very likely to increase by 15% or more through 2015 due to additional expenditures needed to comply with more stringent drinking water quality regulatory requirements promulgated by the US EPA. Based on the 2006 California Water Charge Survey published in July 2006 by Black & Veatch (http://www.bvaeservices.com/news/articles/jul06/ca_survey_businesswire.htm), the average residential monthly charge for 1500 cubic feet of drinking water was US $36.39 (US $3.24/1,000 gallons or $1,058/AF). The survey also indicates that the cost of residential water supply has increased by 16.7% since 2003. The great majority of projects included in the California desalination initiative were at one time considered “premature.” However, water utilities and stakeholders are once again considering whether desalination product water today at a cost of US $2.91 to $3.7/1,000 gallons ($850 to $1,200/AF)19 is too expensive. If the cost comparison of desalination versus other traditional supplies is made on a “comparable basis” suggesting that all components affecting the cost of water are accounted for, then the costs for production of desalinated seawater would be similar to the future total costs for delivery of new incremental water supplies to many parts of the state (especially to municipalities and utilities in Southern California relying on imported water supplies). For example, the commodity charge for one large California municipal water district is US $935 to $1,060/AF without a desalination component20. Another example is Figure 6, which contains a projection of the comparative costs associated with importing water into San Diego in the southernmost region of California in 202021. 19 In 2005 dollars; based on asset life of 30 years and unit power costs of US$0.08/kWh to US$0.11/kWh. 20 West Basin Municipal Water District FY 2010-2011 Water Rates and Charges; includes MWD RTS and Reliability Service Charge. 21 San Diego County Water Authority, September 2010 Planning Committee. Seawater Desalination Costs Page 16
Figure 6
                        2020 Imported Water Supply Costs, Southern California22

The argument was made at one time that desalinating seawater and brackish water is generally more
expensive than the production of reclaimed water and the implementation of water conservation measures.
However, with the exception of potable reuse, water conservation and recycling do not create new sources
of drinking water. Also, under conditions of prolonged drought when the available water resources cannot
be replenished at the rate of their use, aggressive reuse and conservation can help but may not completely
alleviate the need for new water resources and water rationing. Simply put, if your backyard well is dry, you
cannot solve your household water supply challenges by reusing or conserving more of the well water
which you do not have.

The primary differences stem from the significant reduction of the costs for seawater and brackish water
desalination since the early 2000’s and the incrementally higher costs associated with achieving goals such
as dramatic increases in water reuse and conservation after such measures have already been
implemented.

In the early nineties, comprehensive conservation and reuse were uncommon for the majority of the
municipalities in California, as the prolonged drought during this period forced many utilities to implement
low-cost water reuse and conservation measures that now comprise 5 to 15% of their water portfolios.
Utilities already having comprehensive water reuse and conservation programs simply cannot squeeze an
additional 10 to 15% of water savings via the same low-cost reuse and conservation measures.
Implementing the next tier of more sophisticated equipment and technology-intensive reuse and
conservation measures to reach water-saving goals of 20 to 25% comes at a price which, in some cases,
may approach that of desalination.

Without normalizing data from foreign desalination plants for the site specific conditions in California (labor,
construction, equipment costs, etc.), electrical energy accounts for between 30 and 40% of the total water

22 REGIONAL STRATEGIES: PEAK DEMAND GAP & CRITICAL PEAK PRICING, Shahid Chaudhry, California Energy
Commission, August 2005. Energy Workshops for W&WW Agencies.

Seawater Desalination Costs                                                                           Page 17
production costs of a typical membrane seawater desalination plant. Due to site-specific differences, the power costs for seawater desalination in California contribute closer to 20 to 30% of the total costs of water production. Therefore, fluctuations in international fuel markets will not have a dramatic effect on the viability of desalination as has been assumed previously. It should also be noted that unit energy cost increases affect all water supply alternatives, largely due to the energy intensive nature of transporting water from Northern California to Southern California. VII Challenges and Perceptions During a period of prolonged drought in California in the early nineties, emergency fast-track implementation of a number of water desalination projects began, setting the stage for many potentially biased perceptions at the time concerning the relatively high cost of seawater desalination. Today, some of those perceptions about costs associated with seawater desalination remain, thus posing challenges to professionals, planners, and stakeholders alike. The perception that seawater desalination can be a drought-proof alternative to other water supplies has enabled other utilities and water suppliers around the world to effectively incorporate seawater desalination as one alternative to dwindling (or unavailable) water supplies. In the US, for example, Tampa Bay, Florida has implemented seawater desalination as a drought-proof measure. In particular, and under consent order by the State of Florida and the Southwest Florida Water Management District, this measure was determined to be a necessity in order to alleviate wellfield over-pumping and devastation of wetlands23. By some arguable accounts, thousands of acres of wetlands that had virtually “dried up” over many years began to fill with water. There is also the perception that the site-specific costs associated with intake or concentrate disposal may develop (or trend) upward, and may not outweigh the potential benefit of a drought-proof resource. This trend will be influenced by the regulatory environment (specifically regarding the intake facility) and is not associated with the cost of the desalination processes or concentrate disposal. For example, in Tampa, a comprehensive environmental study beginning in 200224 revealed that, to date, there is no indication that the SWRO desalination facility concentrate has had an adverse impact on Tampa Bay. Therefore, the costs associated with co-locating with a nearby power plant and the associated mixing and dilution can be reliable when applied to other similar co-located projects. VIII Concluding Remarks One of the most sensitive and critical aspects of any water project is cost. Membrane desalination has experienced an overall downward trend in overall costs, and technological advances will continue to bring costs down even further. Additionally, when investigating the costs associated with desalination compared 23 Southwest Florida Water Management District (http://www.swfwmd.state.fl.us/) wetland recovery strategy. 24 Study commissioned by Tampa Bay Water and administered by PBS&J. Seawater Desalination Costs Page 18
to other supplies, comparable cost estimating practices will tend to level the playing field when all of the
costs associated with delivering water are considered.

However, as with any infrastructure project, it is important to recognize that the various components
supporting the overall desalination treatment facility can vary significantly and are based on site location.
For membrane desalination, decreasing technological costs, the drought-proof nature of the process, and
producing superior water quality are among a number of significant reasons why this application is the
water treatment technology of choice in the United States and around the world.

Seawater Desalination Costs                                                                        Page 19
You can also read