Method Development, Validation, Monitoring, Seasonal Effect and Risk Assessment of Multiclass Multi Pesticide Residues in Surface and Ground Water ...
←
→
Page content transcription
If your browser does not render page correctly, please read the page content below
Method Development, Validation, Monitoring, Seasonal Effect and
Risk Assessment of Multiclass Multi Pesticide Residues in Surface
and Ground Water of New Alluvial Zone in Eastern India
Sudip Bhattacharyya
Bidhan Chandra Krishi Viswavidyalaya
Rajlakshmi Poi
Bidhan Chandra Krishi Viswavidyalaya
Swagata Mandal
Bidhan Chandra Krishi Viswavidyalaya
Moni Baskey(Sen)
The University of Burdwan
Dipak Kumar Hazra
Bidhan Chandra Krishi Viswavidyalaya
Supradip Saha
Indian Agricultural Research Institute
Rajib Karmakar ( rajibc183@rediffmail.com )
Bidhan Chandra Krishi Viswavidyalaya https://orcid.org/0000-0002-0345-5647
Research Article
Keywords: LLE, RQ, GC-MS, Seasonal effect, monitoring, Risk assessment, Environmental water
DOI: https://doi.org/10.21203/rs.3.rs-620759/v1
License: This work is licensed under a Creative Commons Attribution 4.0 International License. Read Full License
Page 1/19
Abstract
A liquid-liquid extraction (LLE) method consisting gas chromatography-mass spectrometric (GC-MS) determination of thirty six pesticides
in environmental waters was standardized. The method was validated as per SANTE/11813/2017 guidelines. Effect of three seasons
namely summer, monsoon and winter on monitoring of pesticide residues in environmental waters (river, pond and tube well) of rural area
was studied and subsequently risk assessment was evaluated. Within two districts (Nadia and North 24paraganas) of new alluvial zone in
eastern India, six different places were chosen for sampling of river water. On the contrary, six different ponds and tubewells as well were
considered for sampling. 144 samples of 2 liter each (48 each of river, pond and tubewell water) of each district irrespective of seasons
were analyzed during the study period. Each water sample (750 ml) was extracted with ethylacetate:dichloromethane (8:2). The total
residue was reconstituted in acetone (1 ml) and analysed in GC-MS after proper filtration with 0.22 μm nylon syringe filter. Average percent
recovery ranged from 77.84 to 118.15. Irrespective of seasons, maximum total organochlorine (OC) and organophosphorous (OP)
pesticide residues were dominated respectively in river and pond water. Irrespective of types of environmental waters, monsoon (July to
October) showed presence of total maximum pesticide residues. Risk Quotient (RQ) [acute and chronic] was calculated respectively in
pond and river water. Only Seven water samples of tubewell were contaminated with butachlor and chlorpyriphos, although in non-
significant average amount (< 0.1ngml-1), irrespective of seasons and thus safe for consumption.

Introduction:
West Bengal is the fourth largest populated state in India. The population density is 1100 /km2 in 2020. Barrackpore and Kalyani are two
important sub-division towns of west Bengal having population densities 11,500/km2 and 7,500/km2 respectively. The present study was
aimed to carry out at Barrackpore and Kalyani because these two locations are situated in new alluvial zone of the river Hooghly (Ganga)
and are developed agriculturally as well as industrially. Three important sources of environmental waters (river, pond and tubewell) serve
as domestic, agricultural and industrial consumption. The water of Hooghly River specially is used by the respective municipalities as
drinking water after treatment in various plants. Besides, the same water is used in agriculture through irrigation and consumed by various
industries directly (KMDA 2017).Water is very crucial for sustaining life. About 50% of urban people and 80% of water for rural people in
India are affected by water pollution and therefore scarcity of pure drinking water is being created (Hegde 2012). Environmental waters are
usually contaminated with point and non-point source of contamination. However, a major source of water contamination comes from
nonpoint sources (Calhoun 2005).Enormous researchers (Ongley et al. 1992; Rickert, 1993; Kaushik et al. 2008, 2012; Maurya and Kumar
2013; Toccalino et al. 2014; Székács et al. 2015; Mohamed and Ahmed 2020) reported contamination of environmental waters. But
literature of research in these two areas under present study is scarce. Due to dense population, sources of environmental waters including
river, pond and tubewell are limiting for use and consumption. Therefore, the chances of contamination are more. In India, during 2014-15
to 2019-20 consumption of chemical pesticides in agriculture has been increased by 7% in comparison to bio-pesticides by 34%.
Awareness is therefore growing towards quality assurance and bio-safety in agriculture. At this point, only persistent pesticides may cause
contamination and/or pollution of environmental waters. Considering the fact, thirty six pesticides (12 organochlorines, 7
organophosphates, 7 synthetic pyrethroids and 10 others) were chosen based on the screening of literature and farmers’ use in these
localities.

Movement of pesticides creates three problems when these reach from the application sites to non-target regions. The possible effects are
environmental contamination, economic loss and inefficient pest control (Duttweiler and Malakhov 1977; Waite et al. 2002). The
transportation of pesticides and its degradation products to surface waters from soil depends on several factors, including environmental
weather condition, soil characteristics, topography, agricultural practices and chemical properties of individual pesticides (Leonard et al.
1988; Arias-Estévez, et al. 2008). As there are huge variations in temperature, rainfall and humidity in seasons like summer, monsoon and
winter in these locations (Fig. 1) seasonal effects are also considered for investigation under the present study. Though previous study of
overall environmental effect on surface water is available (Mondal et al., 2018) but the data of rainy season correlated with non-point
source contamination is pending. So, there is a requirement of the correlation between seasonal residue data and non-point source of
contamination. Various methods like solid phase extraction (SPE) (Tsochatzis et al. 2012; Sangchan et al. 2012; Kouzayhaet al. 2012;
Maurya and Kumar 2013) and liquid-liquid extraction (LLE) (Singh and Mishra 2009; Kaushik et al. 2012; Erkmen et al. 2013) are available
to analyse pesticide residues in water. To analyse pesticide residues in water samples Solid Phase Extraction (SPE) is usually applied as it
is an easy and fast process (Hatrík and Tekel 1996). The Liquid Liquid Extraction (LLE) method is more reliable than SPE method (Tan
1992). Commercial SPE cartridges or disks have been shown to give extraneous peaks attributed to phthalate esters contained in the
housing materials of the cartridges, especially when GC-ECD is used for analysis (Awofolu and Fatoki 2003). In this present method
involving LLE three different solvent mixtures namely S 1 (EA:DCM 8:2), S 2 (Hexane:DCM 8:2) and S 3 (100% DCM) were considered to
check efficiency of extraction of pesticide residues from water samples. Monitoring of 36 pesticide residues was done collecting samples

                                                                 Page 2/19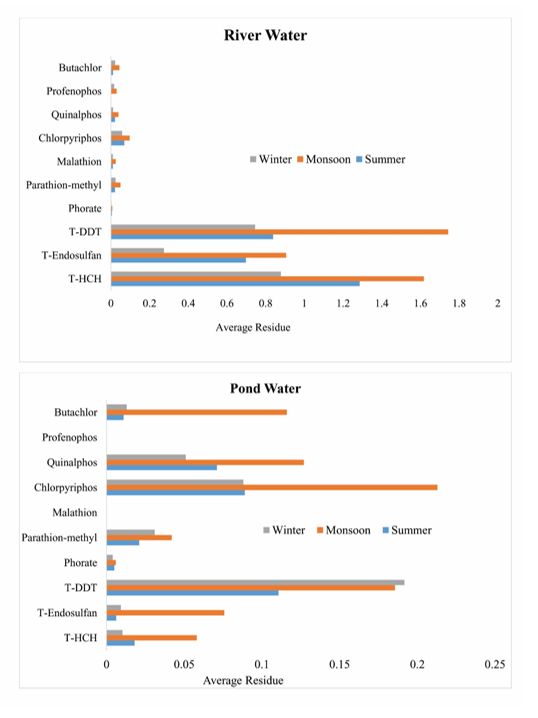
from Hooghly River, ponds and tubewells maintaining the sampling protocol. Focusing on the ecological risk of pesticides of non-point
source, close proximities and huge connectivities with surrounding areas and limited dilution potentials were observed (Karaouzas et al.
2011; Schulz 2004).Therefore, ecological risk assessment is very important evaluating process of toxic effects of pesticide on non-target
organism in aquatic system. Based on the result found in the monitoring study, risk assessment was investigated.

Materials And Methods:
Study area:
Barrackpore (22°76´N and 88°37′E) and Kalyani (22°58′N and 88°26′E), two sub-divisional metropolitan towns of respective districts of
North 24Parganas and Nadia have major industrial and agricultural area. Nadia has 79.48% of agricultural area (Matirkatha 2016)
whereas Barrackpore is one of the dense industrial areas of West Bengal. Both are situated at the bank of Hooghly River (Ganga River), the
water of which is the source of water treatment plants for drinking, agriculture, industrial use and aquaculture (KMDA 2017). Diversified
cropping pattern is found in these two areas throughout the year.

Sampling:
River water (RW), pond water (PW) and tubewell water (TW) samples were collected for consecutive 48 weeks to monitor the pesticide
residues in the aquatic systems of study area. A total of 144 samples (48 each of river, pond and tube-well water) from each district were
collected throughout the year covering winter (November to February), summer (March to June) and monsoon (July to October) seasons.
Six different sampling points in river, six different ponds and six different tube-wells were chosen for sampling purposes (Fig. 2). Ponds
and tube-wells chosen for sample collection are located within 2–3 km radius under domestic, agricultural and industrial activities. Amber
glass bottles (2 liter) with stopper cap were washed with commercial detergent using hot water and rinsed with deionized water and
acetone. Bottles were then dried in an oven at 100°C and stored until use for sampling. Samples were collected from a depth of 1 ft from
the surface of river and pond water using Kemmerer water sampler and kept in ice box at 40C. A 2.0 % solution of Sodium azide (NaN3)
was used for the protection of water samples from microbial growth. Samples were extracted immediately and processed subsequently.

Chemicals and Reagents:
A total of 36 pesticides covering different groups namely insecticides, herbicides, fungicides and acaricides were selected for the present
study (Table 1). All certified reference materials (CRMs) were purchased from Dr. Ehrenstorfer GmbH, Augsburg, Germany with purity
mostly of > 97%. LC-MS grade dichloromethane (DCM), hexane, acetone and ethylacetate (EA) were obtained from J.T. Baker, Avantor, USA.
Analytical grade anhydrous magnesium sulphate, sodium chloride and sodium sulphate were obtained from Rankem, India. Anhydrous
magnesium sulphate was heated at 4500C for 5 hours to remove phthalets and then cooled naturally and stored in a desiccator.

                                                                Page 3/19
Table 1
Parameters recovery experiments of selected pesticides in GC-MS.
Sl. Pesticides RTa m/z for confirmation with ion ratio b R2 LOQc Recovery RPD e
No. (ng/ml)
Target Q1 Q2 LOQ 2x 5xLOQ
Ion (SD d) LOQ
(% Q1/T) (% Q2/T)
1 4-Br 2-Cl- 9.01 208 172 170 0.996 0.044 110.52 91.3 92.9 4.16
phenol (42.09%) (32.58%) (5.23)
2 Trifluralin 13.69 306 43 (44.72%) 264 0.998 0.041 97.44 85.6 101.43 4.92
(40.28%) (6.33)
3 Phorate 14.39 75 121 260 0.997 0.02 99.31 101.56 106.23 6.83
(50.28%) (43.29%) (9.37)
4 α-HCH 14.67 181 183 219 0.999 0.007 113.82 90.69 82.92 12.14
(93.37%) (51.04%) (2.7)
5 Atrazine 15.38 200 215 58(76.68%) 0.998 0.048 107.43 100.64 99.54 15.09
(97.23%) (10.20)
6 β-HCH 15.6 181 183 219 0.998 0.012 83.57 105.11 99.17 18.15
(68.78%) (95.78%) (8.02)
7 Lindane 15.85 181 183 219(54.23%) 0.999 0.011 77.84 106.58 107.27 14.14
(96.48%) (9.33)
8 Chlorothalonil 16.47 266 264 268 0.983 0.099 110.41 100.01 100.38 14.64
(76.28%) (50.23%) (7.02)
9 δ-HCH 16.98 181 183 219(57.85%) 0.995 0.005 105.04 113.65 109.16 16.59
(92.49%) (5.2)
10 Dimethachlor 17.83 134 197 77(52.91%) 0.993 0.056 92.12 102 98.45 1.93
(40.23%) (11.02)
11 Alachlor 18.28 45 160 188 0.999 0.05 92.57 105.35 103.43 8.93
(42.28%) (26.22%) (8.91)
12 Parathion- 18.38 263 109 125 0.995 0.021 85.92 106.09 97.77 4.25
methyl (42.21%) (35.23%) (7.19)
13 Heptachlor 18.79 100 272 274 0.998 0.015 111.7 113.44 101.39 8.73
(42.28%) (30.56%) (8.26)
14 Malathion 19.91 125 127 93(47.54%) 0.996 0.036 86.17 109.4 104.87 15.47
(65.59%) (6.6)
15 Chlorpyriphos 20.23 97 197 199 0.997 0.022 96.35 109.84 105.52 13.55
(63.28%) (41.56%) (1.02)
16 Aldrin 20.46 66 263 91(22.73%) 0.999 0.017 93.45 117.22 111.11 3.52
(57.63%) (5.81)
17 Pendimethylene 21.87 252 162 181 0.998 0.056 107.57 102.92 99.3 13.06
(18.93%) (20.43%) (7.19)
18 Quinalphos 22.77 146 118(65%) 156(61%) 0.999 0.031 87.66 109.33 101.39 10.75
(9.63)
19 Butachlor 23.72 57 176 160 0.999 0.014 112.24 107.75 99.62 10.98
(68.89%) (76.31%) (10.25)
20 α- Endosulfan 23.96 241 195 159 0.999 0.01 113.99 111.03 106.27 14.09
(80.25%) (22.91%) (7.29)
21 Profenophos 24.28 337 97(68.11%) 139 0.998 0.016 92.47 98.43 94.16 4.04
(66.97%) (9.28)
22 p,p-DDE 25.85 246 318 248 0.962 0.023 98.28 102.56 96.05 14.58
(75.76%) (54.81%) (5.27)
Page 4/19Sl. Pesticides RTa m/z for confirmation with ion ratio b R2 LOQc Recovery RPD e
No. (ng/ml)
Target Q1 Q2 LOQ 2x 5xLOQ
Ion (SD d) LOQ
(% Q1/T) (% Q2/T)
23 o,p-DDD 25.85 235 165(76.43%) 237(53.85%) 0.993 0.018 86.67 102.47 98.51 4.33
(7.21)
24 Ethion 27.52 231 97(60.28%) 153 0.997 0.017 90.2 102.7 98.72 12.62
(50.78%) (9.16)
25 p,p-DDD 27.74 235 165 237 0.999 0.021 91.94 92.59 93.63 14.54
(56.28%) (32.50%) (12.09)
26 Β-Endosulfan 27.86 241 195 159 0.997 0.014 89.809 99.04 95.21 9.65
(65.23%) (40.21%) (14.20)
27 p,p-DDT 27.87 235 165(52.28%) 237(61.12%) 0.996 0.015 118.15 110.78 101.28 1.85
(6.37)
28 Endosulfan 29.7 272 274(53.37%) 239(50.21%) 0.998 0.017 84.92 100.26 96.56 14.94
sulphate (4.28)
29 Spiromesifen 31.85 272 99(52.23%) 273(36.16%) 0.972 0.053 80.38 103.32 98.26 17.04
(2.98)
30 Bifenthrin 32.97 181 166(53.27%) 165(62.74%) 0.986 0.039 97.25 95.94 98.42 3.15
(7.23)
31 Fenpropathrin 33.53 97 181 265 0.994 0.05 83.49 102.94 103.04 13.55
(96.97%) (35.12%) (8.29)
32 Lamda- 36.22 181 197(95.70%) 208(58.77%) 0.996 0.087 82.47 98.43 70.67 4.53
cyhalothrin (7.08)
33 β-Cyfluthrin 41.27 163 206 226 0.999 0.025 82.4 102.56 112.24 18.65
(65.23%) (54.15%) (4.09)
34 Cypermethrin 42.22 181 163 127 0.968 0.035 111.44 102.47 113.99 7.53
(75.86%) (47.59%) (4.45)
35 Fenvalerate 44.76 125 167 225 0.994 0.044 97.75 102.7 92.48 1.46
(57.88%) (44.54%) (5.23)
36 Deltamethrin 47.82 181 253 77(69.84%) 0.996 0.041 111.37 85.36 98.29 13.43
(72.62%) (6.37)
a RT- Retention
Time (min.); bR2: Coefficient of regression equation; c LOQ: Limit Of Quantification; dSD: Standard Deviation; eRPD:
Relative Percentage Difference.
Glassware and Equipments:
Separating Funnel shaker (Yamato Scientific, Japan), vortex mixer (Spinix, Tarson, India), Rotary vacuum evaporator with temperature
controlled water bath (HS 2001 NS, Germany), Turbo Vap evaporator (Caliper Life Sciences, Hopkinton, Massachusetts, USA) and 100–
1000µL and 1-10mL micropipettes (Eppendorf Research, Germany) were also used for sample preparation. The electronic analytical
balance Sartorius GD603 (Sartorius, Germany) with readability = 0.001ct/0.2 mg was used for weighing. All the equipments were
calibrated externally with certified agencies. All the glassware viz. conical flask (1000 mL), separating funnel (1000 mL), measuring
cylinder (500 ml and 1000 ml) and volumetric flasks (100 mL), graduated tubes (25 mL) were calibrated and purchased from Borosil Glass
Works Ltd., Gujarat, India. Membrane filter paper, Ultipor N66, Nylon 6,6 membrane, 13 mm (Pall Life Sciences, USA) and syringe filter (SGE
Analytical Science, Australia) were used for filtration process.
Preparation of stock and working standards:
Stock solutions of each CRM were prepared into a 100 ml volumetric flask with hexane:toluene (1:1) solvent mixture. Working standards of
different concentration (1,00,000 ngml− 1, 10,000 ngml− 1, 5,000 ngml− 1, 2,500 ngml− 1, 1,000 ngml− 1, 500 ngml− 1, 250 ngml− 1, 100 ngml−
1
, 50 ngml− 1, 20 ngml− 1 and 10 ngml− 1) were prepared from the stock solution using dilution technique. All the stock and working
solutions of 36 pesticide standards were stored under refrigerated condition (-4oC), protected from sun light.
Page 5/19Sample preparation:
The conventional liquid-liquid extraction (LLE) method was used for water samples using three different solvent mixtures namely S 1
(EA:DCM 8:2), S 2 (Hexane:DCM 8:2) and S 3 (100% DCM) to check and compare the % recovery (Fig. 3). Collected water samples were
filtered through whatman glass fibre filter (GF/F, 0.45 mm) to remove suspended particles before extraction. Sample (750 ml) was taken in
separatory funnel (1 litre), NaCl (150 g) was added to separatory funnel and mixed properly, extracted thrice with 70, 40 and 40 mL of each
solvent mixture (S 1, S 2 and S 3) using separating funnel shaker @ 210 rpm and allowed 15 min to settle down for clear solvent phase
separation. Altogether 150 ml (= 70 + 40 + 40) of organic solvent layer was collected in a conical flask after passing over anhydrous
Na2SO4. The collected solvent was evaporated to dryness in a rotary vacuum evaporator at 400C and the volume was made up with 5 mL
hexane. It was taken in tarbo-vap tube for evaporation to dryness using Turbo Vap LV. The volume was reconstituted in 1 mL acetone. After
vortexing for 30s and sonication for 5 min., the acetone was transferred to 2ml vial for Gas Chromatography-Mass Spectrometric (GC-MS)
analysis with proper filtration using syringe filter.
Instrumental analysis:
The final extracts were analyzed using GC-MS, QP 2010 Plus (Shimadzu Corp., Kyoto, Japan), with a mass selective detector (MSD).The
oven conditions were: initial temperature of 40°C (hold for 1 min), raised @ 25°C/min to 130°C, then @ 12°C/min to180°C, and finally @
3°C/min to 280°C, with a hold time of 7 min. The injector temperature was 250°C. Helium was used as a carrier gas with purity-99.999%.
The ion source temperature was 250°C. The interface temperature was 280°C. The instrument was operated in the spit mode with split
ratio of 1:10. The injection volume was 2 µL. The MS conditions include solvent delay of 6 min; scan rate of 0.50/s and scanned mass
range of 50–500 m/z. All samples were analyzed in the Selected Ion Monitoring (SIM) mode (Fig. 4).Data were acquired and processed by
GC-MS Lab Solution Software (version 4.45). The compound specific retention times, m/z ions and molecular mass for the identification,
confirmation and quantification are represented in (Table 1). Pesticides were identified based on their retention times, quantification and
identification transitions.
Method validation:
The method was validated following SANTE/11813/2017 guidelines with linearity, limit of detection (LOD), limit of quantification (LOQ),
specificity, accuracy (% recovery) and precision (% RSD) (SANTE 2017). LOD was determined based on signal to noise ratio (S/N) 3:1
whereas S/N ratio of 10:1 was used to determine the LOQ. The five-point (10, 20, 50, 100 and 250 ng ml− 1) calibration curve of mix-
standard solution was prepared for checking linearity with the regression coefficient (R2). A comparative recovery experiment in three
replicates was carried out spiking blank water sample with the working mix-standard solution at fortification levels of LOQ, 2×LOQ, and
5×LOQ. The precision and trueness of the results, expressed as %RPD was also calculated using RPD=(M/N)*100 where M = A + B and N=
(A-B)/2, A = Inter assay recovery and B = Intra assay recovery (Tripathy et al. 2019).
Risk assessment:
Risk Quotient (RQ) was assessed and curtained following EPA's Level of Concern (LOC) for aquatic animals (e.g., fish and invertebrates),
for presuming the potential risk associated with the presence of pesticide residues in the aquatic environment (USEPA 2017a). RQ was
calculated as follows: RQ = EEC/LC50 or EEC/EC50 or EEC/NOAEC where, EEC = Estimated Environmental Concentration (i.e. detected
pesticide level in environmental water); LC50 and EC50 = Median Lethal and Effective Concentration, respectively (for estimation of acute
toxicity) and NOAEC = No Observed Adverse Effect Concentration (for estimation of chronic toxicity). Pesticide Properties Data Base (PPDB
2020) was used for the collection of all eco-toxicological (LC50 or, EC50 or NOAEC) data (Table 2).
Page 6/19Table 2
Risk presumption in water ecosystem of river and pond.
Aquatic animals
Pesticides River Water Pond Water
EECa LC50 NOAEC RQ EEC LC50 NOAEC RQ
Acute Chronic Acute Chronic
T-HCH 1.26 2.9 2900 0.43448 0.0004344 0.11 2.9 2900 0.0379 0.000037
T-DDT 1.11 2510 130 0.0005 0.0085384 0.18 2510 130 0.000071 0.000062
T-Endosulfan 0.59 2 0.0001 0.295 5900 0.03 2 0.0001 0.015 0.000017
Phorate 0.005 13 - 0.000384 - 0.005 13 - 0.000385 -
Parathion-methyl 0.031 2700 - 0.000011 - 0.031 2700 - 0.000011 -
Malathion 0.015 18 91 0.00083 0.00016483 - - - - -
Chlorpyriphos 0.075 25 0.14 0.00301 0.53571428 0.13 25 0.14 0.0052 0.928571
Quinalphos 0.023 5 - 0.0046 - 0.083 0.005 - 16.6 -
Profenophos 0.015 0.08 0.002 0.1875 7.5 - - - - -
Butachlor 0.025 441 - 0.000056 - 0.047 441 - 0.000107 -
Semi-aquatic plants
EEC EC50 NOAEC RQ EEC EC50 NOAEC RQ
Acute Chronic Acute Chronic
T-HCH 1.26 2500 1900 0.000504 0.0006631 0.11 2500 1900 0.000044 0.000057
T-DDT 1.11 - - - - 0.18 - - - -
T-Endosulfan 0.59 2150 - 0.0002744 - 0.03 2150 - 0.0000139 -
Phorate 0.005 1300 - 0.0000038 - 0.005 1300 - 0.0000038 -
Parathion-methyl 0.031 1300 - 0.0000238 - 0.031 1300 - 0.0000238 -
Malathion 0.015 13000 - 0.0000011 - - 13000 - - -
Chlorpyriphos 0.075 480 43 0.0001562 0.0017441 0.13 480 43 0.000271 0.003023
Quinalphos 0.023 - - - - 0.083 - - - -
Profenophos 0.015 - - - - - - - - -
Butachlor 0.025 210 - 0.00011904 - 0.047 210 - 0.000224 -
a EEC:Estimated Environmental Concentration; LC50 or EC50 or NOAEC represent ecotoxicological data; - (dash) represents that the data
have not been found in PPDB, 2021
Meteorological Parameters:
Meteorological data (temperature, relative humidity and rain fall) were also collected from Department of Agricultural Meteorology and
Physics, BCKV, Kalyani, for entire study period (Fig. 1). These data was used to correlate and discuss on the seasonal variation of
occurrence of pesticide residues in environmental water samples.
Results And Discussion:
Method standardization:
Page 7/19Different binary solvent mixtures and single solvent system were used for extraction of water samples. Extraction of pesticide residues
having different polarities depends on the polarity of extraction solvent (Allen et al. 2015).To standardize the extraction solvent, three
solvent mixture were considered for extraction namely S 1(EA:DCM 8:2), S 2(Hexane:DCM 8:2) and S 3(100% DCM). Among these three
solvent mixtures, highest % recovery (77.85 to 110.5) was achieved in case of S 1 solvent mixture at fortification level of 0.10 ng mL− 1. At
the same fortification level other two solvent mixtures (S 2 and S 3) could not extract all pesticides. Even these solvent mixtures showed
average percent recovery from 11.52 to 258.03 (Fig. 3). Sibali et al. (2008) used hexane (100%), DCM:Methanol (1:1), DCM:Hexane (1:1)
and DCM (100%) as extraction solvent mixtures. The researcher and his team found 100% DCM as the best extraction solvent giving
recoveries above 70%. Using the standardized extraction solvent mixture S 1 (EA:DCM 8:2), the method was validated following
SANCO/11813/2017guidelines.The LOQ of individual pesticide was determined and found within the range 0.011–0.087 ngmL− 1. A
common LOQ of 0.1 ngmL− 1 was fixed for all 36 pesticides to study average percent recovery. The same is prescribed as standard value
by EC (2016) and accordance with Govt. of India (Sankararamakrishnan et al. 2005; Raghuvanshi et al. 2014). Average percent recovery
found at fortification levels of LOQ (0.1 ngmL− 1), 2xLOQ (0.2 ngmL− 1) and 5xLOQ (0.5 ngmL− 1) were in the range 70.67-118.15. This data
matched the criteria (70–120) of SANTE guideline. %RPD were calculated for individual pesticide and found satisfactory (≤ 20%). The
highest % RPD was found in case of β-cyfluthrin (18.65) and the least was for fenvalerate (1.46) (Table 1).
Monitoring of pesticide residues and effect of Seasonal variation:
A total eighteen out of 36 pesticides were detected irrespective of seasons during the study. These 18 pesticides are organochlorine
insecticides [α-HCH, β-HCH, γ-HCH and δ-HCH (total HCH), endosulfan, α-endosulfan and β-endosulfan (total endosulfan), p´p´-DDE, p´p´-
DDT, o´p´-DDD and p´p´-DDD (total DDT)], organophosphate (OP) insecticides (phorate, parathion-methyl, malathion, chlorpyriphos,
quinalphos and profenophos) and chloroacetanilide herbicide Butachlor. River water samples were found contaminated with all 18
pesticides except profenophos in summer. The water samples of pond were reported with residues of 16 pesticides except p´p´-DDD
(winter), α-endosulfan (in summer) and β-endosulfan (in summer and winter seasons). Chlorpyriphos and butachlor residues were detected
in tubewell water samples irrespective of seasons. No residues of other pesticides under study were detected in any of the environmental
water samples irrespective of seasons.
Seven out of ninety six tube-well water samples were contaminated only with 2 pesticides (chlorpyriphos and butachlor) and others
samples detected pesticide residues below limit of quantification (LOQ) of 0.1 ngmL− 1 for every season. The river water was contaminated
with 18 pesticides including 11 organochlorines inspite of the restricted use (UNEP 2003) and low water affinity (Singh et al. 2012) of
organochlorines (OCs).
The mean concentration of Total organochlorines (TOC) = Total HCH + Total DDT + Total endosulfan) detected in river water (2.96 ng mL− 1)
(Table. 2) despite the low water affinity (Singh et al. 2012) of OCs in water. These values were higher compared to those reported in other
Indian rivers viz. Yamuna (Kaushik et al. 2008), Kuano (Singh and Mishra 2009) but lower than reported TOC level in Sembrong lake basin
in Malaysia (Sharip et al. 2017). In this study, DDT isomers were detected more frequently in river water in contrary to other water sources.
Although DDT is banned for use in agriculture, presence of its residues in river water may be indicated the use of DDT in National Malaria
Eradication Programme (NMEP, Govt. of India) in India (NVBDCP 2016).Values of Total HCH (sum of HCH isomers) in the river system
indicates non-point source of contamination. It is assumed as an old source of contamination due to isomer's least reactivity and the most
persistent nature among HCH isomers (Wang et al. 2007).
Remarkably, OP pesticides were predominant in pond and tubewell water located in neighboring places within 1 km radius in contrary to
the abundant presence of OC insecticide residues in river water system. A mean concentration of chlorpyriphos (0.13ngL− 1) was found
and the insecticide was frequently detected in pond water irrespective of season. In tube-well water, it was the second most found pesticide
next to butachlor irrespective of season. The residues of OPs in pond water probably due to contamination from agricultural pesticides
used nearby cultivated land (Reddy and Reddy 2010; Lari et al. 2014). The mean concentration of TOC was much lower in pond water (0.32
ng mL− 1) compared to river water throughout all seasons. Interestingly, residues of no synthetic pyrethroid (SP) insecticide were detected
in any water throughout the study period. This is probably due to the photo instability of synthetic pyrethroids (Kocourek et al. 1987).
Seasonal residual data showed huge influence of environmental parameters (rain fall, temperature and relative humidity). Variation of
environmental parameter in study period showed in Fig. 1. In monsoon season, mean rain fall (50.9 mm) was three times higher of
summer and average residue found in different aquatic system also showed the highest. In tube-well water sample, insecticide chlorpyrifos
(0.157ngmL− 1) and the herbicide butachlor (0.065 ng mL− 1) were detected in monsoon period predominantly. In river and pond water
samples, pesticides was found in winter comparatively lower than summer, because average temperature of summer was expectedly
higher than winter. Although winter season is major agricultural period of Bengal, this scenario also designates some non-point source of
Page 8/19contaminations. Contamination by agricultural pesticides in neighboring pond water system may be endorsed to run-off during monsoon
water from subsequent agricultural land (Reddy and Reddy 2010; Lari et al. 2014). Intensive agricultural practices performing in the
neighborhood of water system was also the probable causes of recommended OP pesticides contamination in pond water (Agrawal et al.
2010) but banned OCs (PPQS 2020) residues leads to unknown sources of contamination. Seasonal variation of detected average
residues of OP and OC pesticides in aquatic system (Fig. 5) showed different behavior (Fig. 6). Abundances of OC pesticides in river water
higher than pond water while OPs were predominate in pond water. But both were getting rise in monsoon season. Nguyen and his
coworkers, 2019 also reported maximum OC pesticide concentration in Dong Nai River at rainy season in their study. Rising of OCs’
contamination in river water was related to run-off rain water to river but sources were not specific. Moreover, OCs has an affinity to gather
in the river sediments due to their hydrophobic nature and high octanol-water partition coefficient (Yang et al. 2005; Masiá et al. 2013)
Most of the study areas consist of a well-drained sandy-loam soil and the ground water levels are 35–50 ft deep from surface. This ground
water (Tube-well sample) showed seasonal contamination due to rapid transport of soil holding pesticides in monsoon (butachlor and
chlorpyrifos) with low water solubility and high Log Kow (octanal-water partition coefficient) (Yang et al. 2005; Masiá et al. 2013). Table 3
lists the physicochemical properties of the pesticides inspected.
Page 9/19Table 3
Physicochemical properties of the target pesticides.
Compound Molecular Solubility in water Log D Vapor pressure (mPa) Log Koc
formula (mg L− 1) (pH 7.4)
4-Br-2-Cl- phenol C6H4BrClO - - 0.000308 -
Trifluralin C13H16F3N3O4 0.221 4.6 9.5 3.940
Phorate C7H17O2PS 3 50 3.6 112 3.370
α-HCH C6H6Cl6 2 3.82 5.99 3.456
Atrazine C8H14ClN5 35 2.2 0.039 2.000
β-HCH C6H6Cl6 0.2 3.82 4.06 3.456
Lindane C6H6Cl6 8.52 3.82 4.4 3.456
Chlorothalonil C8Cl4N2 0.81 3.12 0.076 3.075
δ-HCH C6H6Cl6 31.4 3.82 - 3.456
Dimethachlor C13H18ClNO2 2300 2.63 0.64 2.806
Alachlor C14H20ClNO2 240 2.99 2.9 3.002
Parathion-methyl C8H10NO5PS 55 2.94 0.2 2.977
Heptachlor C10H5Cl7 0.056 5.54 53 4.389
Malathion C10H19O6PS 2 148 2.76 3.1 2.878
Chlorpyriphos C9H11Cl3NO3PS 1.05 4.78 1.43 3.979
Aldrin C12H8Cl6 0.027 5.91 8.6 4.589
Pendimethylene C13H19N3O4 0.33 4.83 3.34 4.005
Quinalphos C12H15N2O3PS 17.8 3.3 0.346 3.160
Butachlor C17H26ClNO2 20 4.09 0.24 3.605
α- Endosulfan C9H6Cl6O3S 0.32 2.6 8.3 4.060
Profenophos C11H15BrClO3PS 28 4.4 2.53 3.770
p,p-DDE C14H8Cl4 0.0265 6.46 - 4.890
o,p-DDD C14H10Cl4 0.06764 5.84 0.18 4.553
Ethion C9H22O4P2S 4 2 4.94 0.2 4.063
p,p-DDD C14H10Cl4 0.09 5.84 0.18 4.553
β-Endosulfan C9H6Cl6O3S 0.32 2.6 8.3 4.030
p,p-DDT C14H9Cl5 0.025 6.22 - 4.760
Endosulfan sulphate C9H6Cl6O3S 0.32 3.87 0.83 3.481
Spiromesifen C23H30O4 0.13 5.25 0.007 4.233
Bifenthrin C23H22ClF3O2 0.001 6.93 0.0178 5.146
Page 10/19Compound Molecular Solubility in water Log D Vapor pressure (mPa) Log Koc
formula (mg L− 1) (pH 7.4)
Fenpropathrin C22H23NO3 0.33 5.82 0.76 4.544
Lamda-cyhalothrin C23H19ClF3NO3 0.005 6.32 0.0002 4.815
β-cyfluthrin C22H18Cl2FNO3 0.0019 6.13 0.000028 4.712
Cypermethrin C22H19Cl2NO3 0.01 6.05 0.00023 4.670
Fenvalerate C25H22ClNO3 0.001 6.28 0.0192 4.791
Deltamethrin C22H19Br2NO3 0.0002 6.12 0.0000124 4.705
Data predicted with www.chemspider.com and PPDB (https://sitem.herts.ac.uk/aeru/ppdb/en/), -(dash) represents that the data have
not been found in PPDB, 2021
Although, in summer there is some reduction of water volume in river and pond for rising of temperature, (Sharip et al. 2017; Kaushik et al.
2012) total-pesticide concentration was much higher in monsoon than summer and winter period (Fig. 5). Tanabe et al. (2001) reported
maximum residue in Shinano River in the month of May when most applications were conducted.
Risk assessment:
Aquatic as well as humans ecosystem is very much scarring due to the biotransformation (Le Du-Lacoste et al. 2013) and
bioaccumulation (Luna-Acosta et al. 2015) of pesticide residues in aqueous system.
In India, due to persistence nature in the environment of DDT (since 1993) and HCH (since 1997) restriction was imposed in their
agricultural (UNEP 2003; PPQS 2020) as well as human health use (UNEP 2003; NVBDCP 2016). Remarkable presence of these non-
agricultural pesticides in water moiety is very alarming in spite of their restrictions. These pesticides were also key suppliers of global
persistent organic pesticide (POP) circulation (Yadav et al. 2015). Mankind directly depends on these water and aquatic life, so the risk
connected with the contaminated water system was evaluated in terms of humans (EC 2016) and aquatic health (USEPA 2017a).
EC limit for single pesticide in drinking water is 0.10 ngmL− 1 (EU 1998). Interestingly more than 50% monsoon samples has exceeded the
threshold for both pond and river water. Conversely tube-well water was safe for drinking as it was below the total pesticides limits
irrespective of season.
To evaluate the possible ecological risk (acute and chronic) associated with the pesticides contaminated river and pond water risk quotient
(RQ) was used (Table.2). The RQ level of concern (LOC) of semi-aquatic (e.g., marimo and algae) plants was 1, so the RQ values (< 1)
showed no possible risk on the aquatic ecosystems. But in case of T-HCH (RQ = 0.434) in river aquatic animals (e.g., fish;
Oncorhynchusmykiss), estimated RQ value was very closer to the limiting marks of EPA’s LOC for acute toxicity in terms of Acute High Risk
(0.500). Chen et al. 2020 also indicated OC pesticides as a moderate risk group in their study at Shanghai river, China. Significantly RQ of
total endosulfan (0.295) crossed acute toxicity in river fish in terms of Acute Endangered Species (LOC = 0.050) and showed very high risk
in chronic toxicity RQ = 5900 compared to LOC = 1. Kapsi et al. (2018) and his team also reported α-endosulfan as medium risk in their
study at Louros river, Greece. Profenofos also indicated chronic toxicity threat in river water unlike others OPs. However, in pond water
system there was no ecological hazard (RQ < 1) for total-HCHs, total-DDTs and total-Endosulfan. In this study showed, the borderline RQ
value of chlorpyrifos (0.928) comparing the LOC for Chronic Risk (1.0) in pond water fish, indicating future risk. Ccanccapa et. al. (2016)
also reported that chlorpyrifos is the most frequent occurring pesticide in Ebro river water. Subsequently, the outcomes of this study are
originated very serious for aquatic habitat around the study area.
Conclusion
In this study, an effective and profound method involving liquid-liquid extraction (LLE) and GCMS detection was standardized for
determination of selected 36 pesticides in surface and ground water. EA and DCM (8:2, v/v) solvent system for LLE showed to be the best
compared to other solvent systems. Method was validated according to EC guidelines and applied for observing of 36 pesticide residues
(OCs, OPs and others) in different aquatic systems with seasonal variations. Different residues distribution of OPs and OCs was evaluated
in river and pond water system with changes of environmental conditions. Comparatively higher concentration of pesticide residues
Page 11/19occurred during monsoon period compared to summer and winter. Despite the restricted use of persistent OCs, river water samples were
found to be contaminated with high OC residues which reflect non-point sources of contaminations.
In most of the samples, the pesticide residue levels spotted were higher than EC recommended drinking water quality standards. Risk
assessment in the aquatic system was assessed where the potential risk on aquatic bionetwork in terms of acute and chronic toxicity was
also observed for OC pesticides in river aquatic ecosystem. Therefore, this study initiates reference line data for possible execution of
pollution control and governing decision-making policies in Barrackpore and Kalynai, West Bengal.
Declarations
Acknowledgements
The instrumental and infrastructural facilities extended by the AINP on Pesticides Residue Laboratory, Directorate of research, Bidhan
Chandra Krishi Viswavidyalaya (BCKV), West Bengal, India, are duly acknowledged.
Funding: The authors are thankful to Indian Council of Agricultural Research (ICAR), New Delhi, India, for financial assistance.
Author contribution: SB: critical review, methodology, software and drafting of the manuscript; RP: ideation and drafting; SM: critical
review; MBS: critical review and expert view; DKH: critical review and expert view; SS: literature review and expert view; RK:
conceptualization, ideation, critical review, supervision and expert view and. All authors contributed to the research article and approved the
final version.
Data availability: Provided in manuscript
Compliance with ethical standards
Ethical approval: Not applicable.
Consent to participate: The authors have consent to participate.
Consent to publish: The authors have consent to publish.
Competing interests: The authors declare that they have no conflict of interest.
References
1. Allen G, Halsall CJ, Ukpebor J, Paul ND, Ridall G, Wargent JJ (2015) Increased occurrence of pesticide residues on crops grown in
protected environments compared to crops grown in open field conditions. Chemosphere 119:1428–1435.
2. Agrawal A, Pandey RS, Sharma B (2010) Water pollution with special reference to pesticide contamination in India. Journal of Water
Resource and Protection 2:432-448.
3. Arias-Estévez M, López-Periago E, Martínez-Carballo E, Simal-Gándara J, Mejuto JC, García-Río L (2008) The mobility and degradation
of pesticides in soils and the pollution of groundwater resources. AgricEcosyst Environ 123(4): 247-260.
4. Awofolu RO, Fatoki OS (2003) Persistent organochlorines pesticides residues in freshwater systems and sediments from the Eastern
Cape, South Africa. Water SA 29(3):323-330.
5. Calhoun Y (2005) Water pollution. New York: Chelsea House Publisher, USA, pp 1-7.
6. Ccanccapa A, Masiá A, Navarro-Ortega A, Picó Y, Barceló D (2016) Pesticides in the Ebro River basin: Occurrence and risk assessment,
Environmental Pollution 211:414-424. https://doi.org/10.1016/j.envpol.2015.12.059.
7. Chen C, Zou W, Chen S, Zhang K, Ma L (2020) Ecological and health risk assessment of organochlorine pesticides in an urbanized
river network of Shanghai, China. Environ SciEur 32:42. https://doi.org/10.1186/s12302-020-00322-9.
8. Duttweiler DW, Malakhov SG (1977) U.S.A. - U.S.S.R. on environmental transport and transformation of pesticides. J Agric Food Chem
25(5): 975–978.
9. EC (European Commission) (2016) A Report from the Commission on synthesis Report on the Quality of Drinking Water in the Union
Examining Member States' Reports for the 2011-2013 Period, Foreseen under Article 13(5) of Directive 98/83/ec. Brussels, 20.10.2016
COM (2016) 666 final. http://ec.europa.eu/environment/water/water-drink/pdf/reports/EN.pdf. Accessed 28 February 2020.
Page 12/1910. Erkmen B, Yerli S, Erkakan F, Kolankaya D (2013) Persistent organchlorine pesticide residues in water and sediment sample from Lake
Manyas, Turkey. J Environ Biol 34:171-176.
11. EU (1998) European union drinking water standards. https://www.lenntech.com/applications/drinking/standards/eu-s-drinking-water-
standards.htm. Accessed 01 July 2020.
12. Hassaan MA, El Nemr A (2020) Pesticides pollution: Classifications, human health impact, extraction and treatment techniques. The
Egyptian Journal of Aquatic Research 46(3):207-220
13. Hatrík Š, Tekel’ J (1996) Extraction methodology and chromatography for the determination of residual pesticides in water. J
Chromatogr A 733(1-2):217–233. https://doi:10.1016/0021-9673(95)00725-3.
14. Hegde NG (2012) Water scarcity and security in India. BAIF at the Indian Science Congress 2012.
https://www.indiawaterportal.org/articles/water-scarcity-and-security-india. Accessed 25 October 2020.
15. Kapsi M, Tsoutsi C, Paschalidou A, Albanis T (2018) Environmental monitoring and risk assessment of pesticide residues in surface
waters of the Louros River (N.W. Greece). Sci. Total Environ. Sci Total Environ 650:2188-
2190. https://doi:10.1016/j.scitotenv.2018.09.185.
16. Karaouzas I, Theodoropoulos C, Vardakas L, Kalogianni E, Skoulikidis NT (2018) A review of the effects of pollution and water scarcity
on the stream biota of an intermittent Mediterranean basin. River Research and Applications 34(4):291–299.
https://doi:10.1002/rra.3254.
17. Kaushik CP, Sharma HR, Jain S, Dawra J, Kaushik A (2008) Pesticide residues in river Yamuna and its canals in Haryana and Delhi,
India. Environ Monit Assess 144:329-340. https://doi.org/10.1007/s10661-007-9996-4.
18. Kaushik CP, Sharma HR, Kaushik A (2012) Organochlorine pesticide residues in drinking water in the rural areas of Haryana, India.
Environ Monit Assess 184:103-112. https://doi.org/10.1007/s10661-011-1950-9.
19. KMDA (2020) Water & Sanitation Sector. Kolkata Metropolitan Development Authority. Available at:
www.kmdaonline.org/home/ws_sector_info. Accessed 20 February 2020.
20. Kocourek V, Havlíková L,Zemanová I (1987) Photostability of synthetic pyrethroids on treated grain. Z LebensmUntersForch 185:14–
16. https://doi.org/10.1007/BF01083333.
21. Kouzayha A, Rabaa AR, Iskandarani MA, Beh D, Budzinski H, Jaber F (2012) Multiresidue method for determination of 67 pesticides in
water samples using solid-phase extraction with centrifugation and gas chromatography-mass spectrometry. American Journal of
Analytical Chemistry 3:257-265. https://doi.org/10.4236/ajac.2012.33034.
22. Lari SZ, KhanNA, Gandhi KN, Meshram TS, Thacker NP (2014) Comparison of pesticide residues in surface water and ground water of
agriculture intensive areas. J Environ Health Sci Eng 12:11.
23. Le Du-Lacoste M, Akcha F, Devier MH, Morin B, Burgeot T, Budzinski H (2013) Comparative study of different exposure routes on the
biotransformation and genotoxicity of PAHs in the flatfish species, Scophthalmusmaximus.Environ SciPollut Res 20(2):690-707.
https://doi.org/10.1007/s11356-012-1388-9.
24. Luna-Acosta A, Budzinski H, Le Menach K, Thomas-Guyon H, Bustamante P (2015) Persistent organic pollutants in a marine bivalve
on the Marennes-Oleron Bay and the Gironde Estuary (French Atlantic coast)-Part 1: Bioaccumulation. Sci Total Environ 514:500-510.
https://doi.org/10.1016/j.scitotenv.2014.08.071.
25. Leonard RA, Knisel WG (1988) Evaluating groundwater contamination potential from herbicide use. Weed Technology 2:201-216.
26. Mondal R, Mukherjee A, Biswas S, Kole RK (2018) GC-MS/MS determination and ecological risk assessment of pesticides in aquatic
system: A case study in Hooghly River basin in West Bengal, India. Chemosphere 206:217-230.
27. Masiá A, Campo J, Vázquez-Roig P, Blasco C, Picó Y (2013) Screening of currently used pesticides in water, sediments and biota of the
Guadalquivir River Basin (Spain). J Hazard Mater 263(1):95-104. https://doi:10.1016/j.jhazmat.2013.09.035.
28. Matirkatha (2021) Comprehensive district agriculture plan for nadia district. C-DAP report http://matirkatha.net/wp-
content/uploads/2016/01/Nadia-District-Profile. Accessed 24 January 2021.
29. Maurya AK, Kumar A (2013) Organochlorine pesticides in the surface waters from Sharda River Region, Uttar Pradesh-India. The SIJ
Transactions on Advances in Space Research & Earth Exploration (ASREE) 1:1-7.
30. Nguyen TX, Nguyen BT, Tran HT T, Mai H, Duong TT, Bach QV (2019) Seasonal, Spatial Variation, and Potential Sources of
Organochlorine Pesticides in Water and Sediment in the Lower Reaches of the Dong Nai River System in Vietnam. Arch Environ
ContamToxicol 77(4):514-526. https://doi:10.1007/s00244-019-00653-6.
31. NVBDCP (2016) Operational Manual for Malaria Elimination in India 2016. (National Vector Borne Disease Control Programme)
Directorate General of Health Services, Ministry of Health & Family Welfare, Government of India. Version 1.
Page 13/19https://nvbdcp.gov.in/WriteReadData/l892s/5232542721532941542.pdf. Accessed 24 January 2021.
32. Ongley ED (1996) Control of Water Pollution from Agriculture. Food and Agriculture Organization of the United Nations, USA.
33. PPDB (Pesticide Properties Data Base) (2021) Agriculture & Environment Research Unit (AERU). University of Hertfordshire.
https://sitem.herts.ac.uk/aeru/ppdb/en/index.htm. Accessed 20 January 2021.
34. PPQS (2021) Banned pesticides list. Ministry of agriculture & farmers welfare. Department of agriculture, cooperation & farmers
welfare. Government of India. https://ppqs.gov.in/industrycorner/banned-pesticides. Accessed 20 January 2021.
35. Raghuvanshi D, Pandey R, Pandey V, Sharma PK, Shukla DN (2014) Physicochemical and pesticide analysis of river Ganga in
Allahabad city, Uttar Pradesh, India. Asian Journal of Biochemical and Pharmaceutical Research 3:239-244.
36. Reddy KN, Reddy H (2010) Pesticide residues in surface water of lakes around hyderabad, India. Pesticide Research Journal
22(2):111-115.
37. Rickert D, Schlüter M, Wallmann K (2002) Dissolution kinetics of biogenic silica from the water column to the sediments. Geochimica
et Cosmochimica Acta 66:439-455. https://doi.org/10.1016/S0016-7037(01)00757-8.
38. Sangchan W, Hugenschmidt C, Ingwersen J, Schwadorf K, Thavornyutikarn P,Pansombat K, Streck T (2012) Short-term dynamics of
pesticide concentrations and loads in a river of an agricultural watershed in the outer tropics. AgricEcosyst Environ 158:1-14.
https://doi.org/10.1016/j.agee.2012.05.018.
39. Sankararamakrishnan N, Sharma AK, Sanghi R (2005) Organochlorine and organophosphorous pesticide residues in ground water
and surface waters of Kanpur, Uttar Pradesh, India. Environ Int 31:113-120.
40. SANTE (Directorate-General for Health and Food Safety) (2017) Guidance document on analytical quality control and validation
procedures for pesticide residues analysis in food and feed. European Commission. Document no. SANCO/11813/2017.
http://www.eurl-pesticides.eu/userfiles/file/SANTE_11813_2017_MainChanges.pdf. Accessed 25 November 2017.
41. Schulz R (2004) Field studies on exposure, effects, and risk mitigation of aquatic nonpoint source insecticide pollution: a review. J
Environ Qual 33:419-448.
42. Sharip Z, Hashim N, Suratman S (2017) Occurrence of organochlorine pesticides in a tropical lake basin. Environ Monit Assess 189:1-
13.
43. Sibali LL, Okwonkwo JO, McCrindle RI (2008) Determination of selected organochlorine pesticide (OCP) compounds from the Jukskei
River catchment area in Gauteng, South Africa. Water Sa 34:611-621.
44. Singh S, Mishra RN (2009) Occurrence of organochlorine pesticides residue in Kuano river of eastern Uttar Pradesh. J Environ Biol 30:
467-468.
45. Singh L, Choudhary SK, Singh PK (2012) Pesticide concentration in water and sediment of River Ganga at selected sites in middle
Ganga plain. Int J Environ Sci 3(1):260-274
46. Skoulikidis TK, Vardakas L, Karaouzas I, Economou AN, Dimitriou E, Zogaris.S (2011) Assessing water stress in Mediterranean lotic
systems: insights from an artificially intermittent river in Greece. Aquatic Sciences 73:581.
47. Székács A, Mörtl M, Darvas B (2015) Monitoring pesticide residues in surface and ground water in Hungary: surveys in 1990–2015.
Journal of Chemistry. https://doi:10.1155/2015/717948.
48. Tan GH (1992) Comparison of solvent extraction and solid-phase extraction for the determination of organochlorine pesticide residues
in water. Analyst 117(7):1129-1132.
49. Tanabe A, Mitobe H, Kawata K, Yasuhara A, Shibamoto T (2001) Seasonal and Spatial Studies on Pesticide Residues in Surface
Waters of the Shinano River in Japan. J Agric Food Chem 49(8):3847–3852. https://doi:10.1021/jf010025x.
50. Toccalino PL, Gilliom RJ, Lindsey BD, Rupert MG (2014) Pesticides in Groundwater of the United States: Decadal-Scale Changes,
1993-2011. Groundwater 52(S1):112–125. https://doi:10.1111/gwat.12176.
51. Tripathy V, Sharma KK, Yadav R, Devi S, Tayade A, Sharma K, Pandey P, Singh G, Patel AN, Gautam R, Gupta R, Kalra S, Shukla P, Walia
S, Shakil NA (2019) Development, validation of QuEChERS-based method for simultaneous determination of multiclass pesticide
residue in milk, and evaluation of the matrix effect. J Environ Sci Health B 1:13. https://doi:10.1080/03601234.2019.1574169.
52. Tsochatzis ED, Tzimou-Tsitouridou R, Menkissoglu-Spiroudi U, Karpouzas DG, Papageorgiou M (2012) Development and validation of
an HPLC-DAD method for the simultaneous determination of most common rice pesticides in paddy water systems. Int J Environ Anal
Chem 92:548-560. https://doi.org/10.1080/03067310903229943.
53. UNEP (United Nations Environment Programme) (2003) Global Reports on Regionally Based Assessment of Persistent Toxic
Substances. United Nations Environment Programme. UNEP Chemicals, Geneva, Switzerland.
https://wedocs.unep.org/handle/20.500.11822/675?show=full.
Page 14/1954. USEPA (2020) Ecological Risk Assessment for Pesticides: Technical overview. United States Environmental Protection Agency
https://www.epa.gov/pesticide-science-and-assessing-pesticide-risks/ecological-risk-assessment-pesticides-technical. Accessed 21
December 2020.
55. Wang YL, Yajuan S, John PG, Wei L (2007) Organochlorine pesticides in soils around guanting reservoir, China tieyu. Environ Geochem
Health 29:491-501. https://doi.org/10.1007/s10653-007-9118-9.
56. Waite DT, Cessna AJ, Grover R, Kerr LA, Snihura AD (2002) Environmental concentrations of agricultural herbicides 2, 4‐D and Triallate
. J Environ Qual 31:129-144.
57. Yadav IC, Devi NL, Syed JH, Cheng Z, Li J, Zhang G, Jones KC (2015) Current status of persistent organic pesticides residues in air,
water, and soil, and their possible effect on neighboring countries: a comprehensive review of India. Sci Total Environ 511:123-137.
58. Yang R, Jiang G, Zhou Q, Yuan C, Shi J (2005) Occurrence and distribution of organochlorine pesticides (HCH and DDT) in sediments
collected from East China Sea. Environment International 31(6):799–804.
Figures
Figure 1
Agro-meteorological data [Temperature, Relative humidity (RH) and rainfall] during the entire study period (48 weeks)
Page 15/19Figure 2
Study area (Sampling sites of the experiment)
Figure 3
Page 16/19Comparison of average percent recovery using different extraction solvent system S1 (EA:DCM 8:2), S2 (Hexane:DCM 8:2) and S3 (100%
DCM)
Figure 4
GC-MS Chromatogram of thirty six selected pesticide standards
Page 17/19Figure 5
Seasonal average concentration of pesticide residues in pond and river water (ng ml-1)
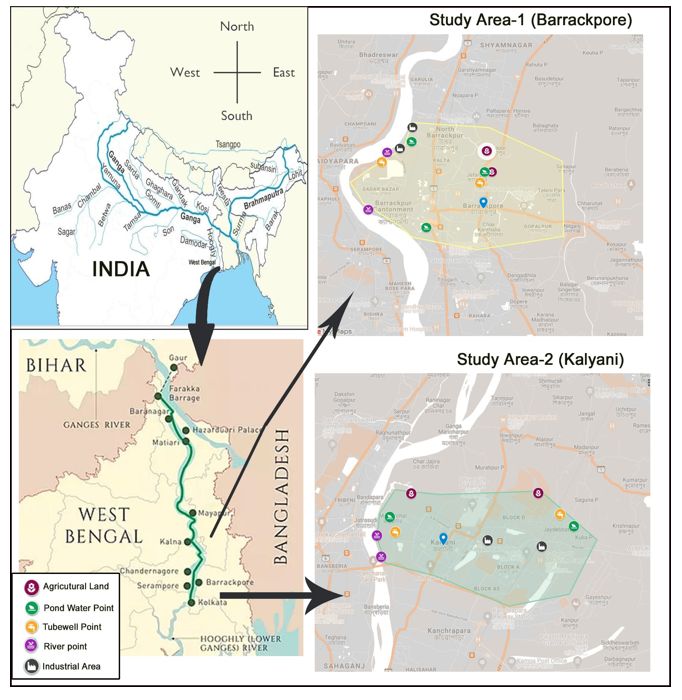
Page 18/19Figure 6
Frequency of occurrence of pesticides in River and Pond water with three seasons
Page 19/19You can also read