Plastic transport in a complex confluence of the Mekong River in Cambodia
←
→
Page content transcription
If your browser does not render page correctly, please read the page content below
LETTER • OPEN ACCESS

Plastic transport in a complex confluence of the Mekong River in
Cambodia
To cite this article: Charlotte J Haberstroh et al 2021 Environ. Res. Lett. 16 095009

View the article online for updates and enhancements.

                                This content was downloaded from IP address 46.4.80.155 on 10/09/2021 at 16:06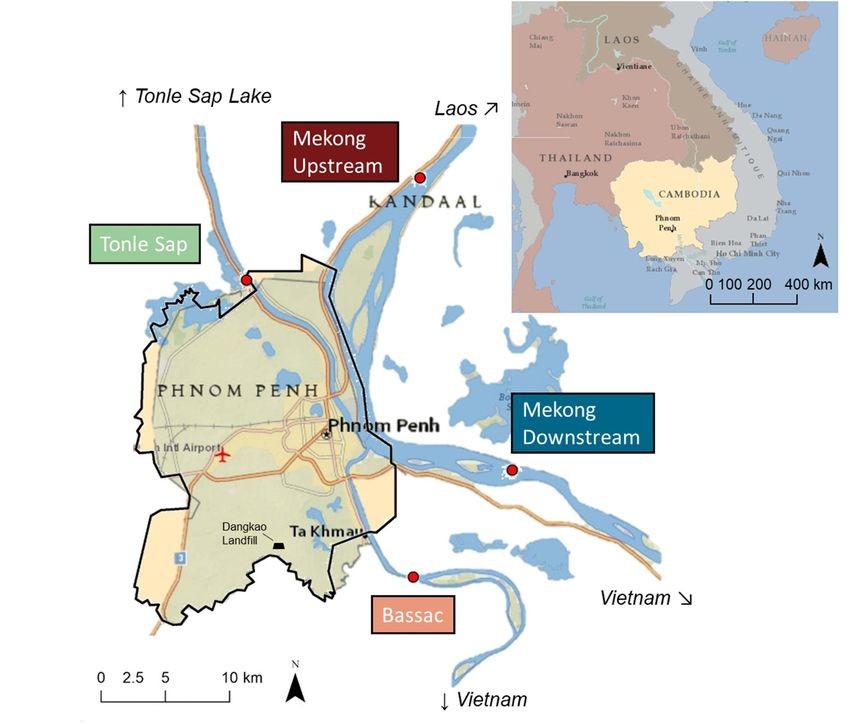
Environ. Res. Lett. 16 (2021) 095009 https://doi.org/10.1088/1748-9326/ac2198
LETTER
Plastic transport in a complex confluence of the Mekong River in
OPEN ACCESS
Cambodia
RECEIVED
31 May 2021 Charlotte J Haberstroh1, Mauricio E Arias1,∗, Zhewen Yin2, Ty Sok3 and Michael C Wang2,4
REVISED 1
19 August 2021 Department of Civil and Environmental Engineering, University of South Florida, Tampa, FL, United States of America
2
Department of Mechanical Engineering, University of South Florida, Tampa, FL, United States of America
ACCEPTED FOR PUBLICATION 3
26 August 2021
Research and Innovative Center, Institute of Technology of Cambodia, Phnom Penh, Cambodia
4
Department of Medical Engineering, University of South Florida, Tampa, FL, United States of America
PUBLISHED ∗
Author to whom any correspondence should be addressed.
7 September 2021
E-mail: mearias@usf.edu
Original content from Keywords: Mekong, Tonle Sap, acoustic Doppler current profiler, Raman spectroscopy, South East Asia, plastic pollution
this work may be used
under the terms of the Supplementary material for this article is available online
Creative Commons
Attribution 4.0 licence.
Any further distribution
of this work must Abstract
maintain attribution to
the author(s) and the title Field data on plastic pollution is extremely limited in Southeast Asian rivers. Here we present the
of the work, journal
citation and DOI.
first field measurements of plastic transport in the Mekong, based on a comprehensive monitoring
campaign during the monsoon season in the confluence of the Mekong, Tonle Sap, and Bassac
rivers around Cambodia’s capital (Phnom Penh). For improved accuracy in the estimation of
plastic loads and distribution, we combined Neuston net multipoint cross-sectional water
sampling with acoustic Doppler current profiler high resolution measurements. During the wet
season, around 2.03 × 10⁵ kg d−1 of plastic were released from Phnom Penh into the Mekong,
equivalent to 89 g d−1 capita−1 , or 42% of all plastic waste generated in the city. Most plastic mass
moved downstream at the surface. A smaller portion of plastics is mixed deep into the water
column, potentially retained in the rivers, breaking down and resuspending over time. Overall,
plastic waste from Phnom Penh and transported by the Mekong is a significant contribution to
Southeast Asia’s plastic release into the ocean. This pollution represents a crucial risk to people in
the region, as their livelihoods depend on fisheries from these water bodies.
1. Introduction (rather than 10) rivers are responsible for most of the
plastic emissions to the ocean (Meijer et al 2021).
Southeast Asia is considered a major contributor of The Mekong River has the 10th largest water dis-
global plastic pollution, as Asian rivers may release charge in the world (Adamson et al 2009), and poten-
up to 86% of the global annual plastic input into tially the 8th or 11th highest plastic mass load input
the oceans, especially during the East Asian monsoon to the ocean (Lebreton et al 2017, Mai et al 2020). At
(Jambeck et al 2015, Lebreton et al 2017, Schmidt et al Cambodia’s capital, Phnom Penh, the Mekong forms
2017). These modeling results are widely acknow- the Chaktomuk confluence with the Tonle Sap and
ledged; yet, supporting field data in the region are Bassac rivers. The Tonle Sap river experiences a sea-
limited to macroplastics (Lahens et al 2018, van sonal flow reversal of more than 10000 m3 s−1 driven
Emmerik et al 2019a, 2019b). Further, most of the by the hydraulic head difference between the Tonle
largest rivers in the world, many of which are key pol- Sap lake and the Mekong River, making it one of
luters as well, have not yet been monitored. In fact, the most complex large-scale flow reversal systems on
the results of the few existing studies on the contri- Earth (Arias et al 2012). This hydrological system is
bution of those rivers to global pollution are highly the primary driver of one of the world’s largest fresh-
contrasting (Zhao et al 2014, Xiong et al 2019, Nap- water fisheries and provides millions of people with
per et al 2021, Singh et al 2021) and a recent model food and income (Sabo et al 2017). Plastic occur-
contradicts its predecessors suggesting that over 1000 rence in Cambodia and the Mekong Delta have not
© 2021 The Author(s). Published by IOP Publishing Ltd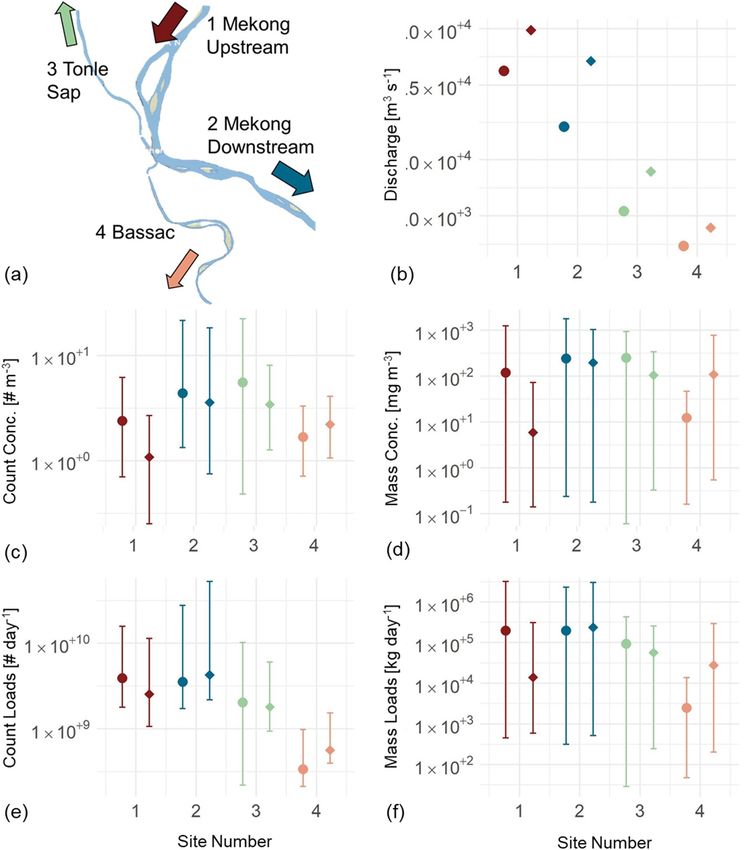
Environ. Res. Lett. 16 (2021) 095009                                                              C J Haberstroh et al

been monitored, but plastics are likely abundant in        sampling method was developed for lowland rivers
the region; a recent modeling study estimated that         and captures cross-sectional variability (Haberstroh
221 700 tons of plastic entered the Tonle Sap basin        et al 2021a). We used a custom-built 500 µm Neuston
from 2000 to 2020 (Finnegan and Gouramanis 2021).          net with a 0.5 × 1 m net frame, equipped with remov-
This is concerning, as plastics present risks to human     able floats and weights to sample at the river sur-
health and livelihoods (Horton et al 2017, Liu et al       face and subsurface. An essential part of the sampling
2020a), and aquatic biota are known to ingest plastics     strategy was the use of a Sontek River Surveyor acous-
(Silva-Cavalcanti et al 2017, Bellasi et al 2020).         tic Doppler current profiler (ADCP), a multibeam
    Plastic release into rivers and transport dynam-       sensor mounted on a floating board that measures
ics of plastic are exacerbated by human activities         current velocities at two different frequencies, geo-
and watershed hydrology (Dris et al 2018, Horton           referenced with an integrated GPS. With the ADCP
and Dixon 2018, Windsor et al 2019). Retention and         we created detailed cross-sectional flow profiles, cap-
resuspension mechanisms as well as cross-sectional         tured local discharge and determined local flow velo-
movement highly impact the spatial and temporal            cities to calculate sampling volume. Surface samples
scale of plastic transport to the ocean (Liedermann        were collected across the river width (0.2 m net depth)
et al 2018, Xiong et al 2019, Haberstroh et al 2021a,      and four depth samples through the water column
2021b). Our study—the first field-based quantific-         in the river center at each site. Sampling depths were
ation of plastic pollution in the Mekong River and         3 m, 6 m, 9 m, 12 m, and 0.5 m/9 m in the Mekong
tributaries—focused on plastic pollution originating       and Tonle Sap sites, and 1.5–2 m, 3–4 m, 5–6 m,
in Phnom Penh, in view of its impact on the Mekong’s       and 8 m in the Bassac (see table S2 (available online
socio-environmental system. This study was guided          at stacks.iop.org/ERL/16/095009/mmedia) and figure
by two questions: (a) How much plastic is released         S3 in supplementary materials for details). Alto-
within the city of Phnom Penh and where is it trans-       gether, 80 samples were collected, 9–11 samples per
ported to? (b) How are spatial plastic distribution and    sampling event. Sampling was conducted from semi-
transport affected by wet season hydrology and the         stationary local fishing boats, deploying the Neuston
river confluence?                                          net perpendicular to the flow at each point in the river
                                                           cross-section for 10–15 min (with few exceptions due
2. Methods                                                 to high material loads, see table S3 in supplementary
                                                           materials for sampling details).
2.1. Study area
The study was carried out around the Chaktomuk             2.3. Laboratory analysis
confluence of the Mekong, Tonle Sap and Bassac             The laboratory methods have been developed and
rivers at Phnom Penh, Cambodia (figure 1). This rap-       applied in studies in lowland rivers and are well suited
idly growing city has a population of over 2 mil-          for samples with high organic contents (Haberstroh
lion and a population density of 3363 people km−2 .        et al 2021a). Each sample was rinsed over a 500 µm
Where managed, the majority of solid waste is dis-         sieve, large organics were discarded and larger mac-
posed into Dangkor landfill in the Dangkao district        roplastics (>1 cm) separated. The remaining sample
in the south of Phnom Penh, closely located to the         was dried and sorted visually for plastic particles by
Prek Tnot River, a tributary of the Bassac (Hoorn-         two experienced team members. All plastics were cat-
weg and Bhada-Tata 2012, Seng 2015). About 83%             egorized by size into macroplastics (>5 mm), large
of Phnom Penh had access to solid waste collection         microplastics (1 mm), and small micro-
in 2015 (Cambodian Ministry of Environment 2019),          plastics (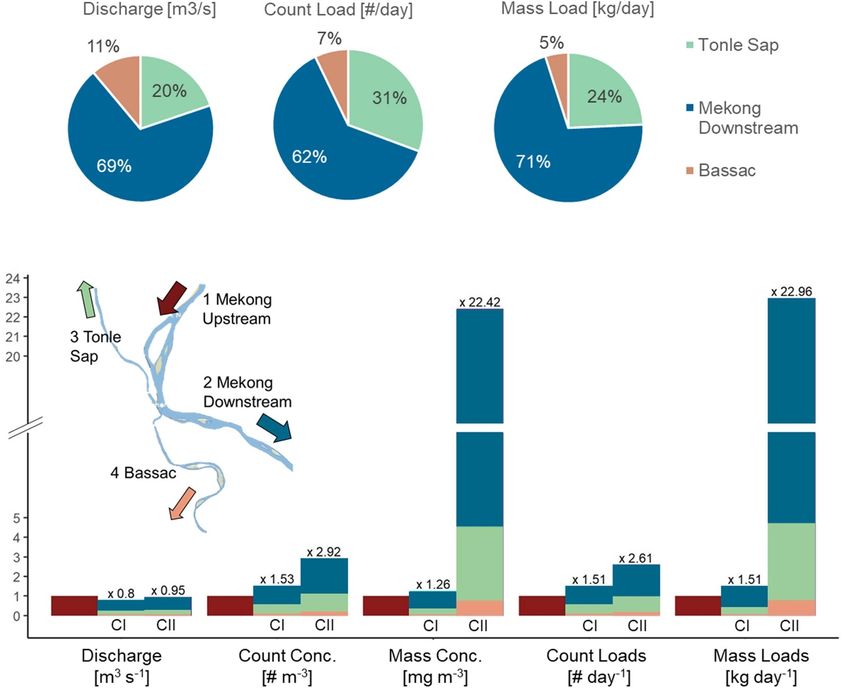
Environ. Res. Lett. 16 (2021) 095009                                                                            C J Haberstroh et al

        Figure 1. Overview map of the study area, including monitoring sites and landfill location in Phnom Penh, Cambodia.

          Table 1. Cross-section characteristics at the sampling sites (ADCP measurements from August to September 2019).

                               Mean discharge               Mean flow              Mean            Maximum
No.       Site                   (m3 s−1 )               velocity (m s−1 )       depth (m)         depth (m)         Width (m)

1         Mekong                       39 365                  1.20                  17                29                   823
          Upstream
2         Mekong                       24 262                  1.11                  19                30               1341
          Downstream
3         Tonle Sap                     6946                   1.05                  15                19                   465
4         Bassac                        3903                   1.07                  10                15                   367

the subsurface) and sampling duration. Plastic con-                   Bassac sites and 182.5 days for the Tonle Sap due to
centrations are the quotient of plastic mass or count                 its flow-reversal). For details, see extended methods
and sampling volume, and were determined both by                      in the supplementary material.
sample and as the volume-averaged of all sample posi-                      Parameters used for data analysis included
tions in the cross-section. Plastic loads were estimated              count concentration (# ·m−3 ), mass concentration
based on cross-section concentrations and the ADCP                    (mg m−3 ), count loads (# ·d−1 ), mass loads (kg d−1 ),
river discharge portion from surface to sampling                      discharge (m3 s−1 ), and local flow velocities (m s−1 ).
depths (12 or 8 m). Total annual plastic loads at                     Statistical data analysis included the pairwise Wil-
each site were calculated as the daily plastic loads in               coxon rank test to estimate differences between sites
the cross-section (average from both sampling cam-                    and campaigns, and the Spearman rank test for cor-
paigns) multiplied by the days of positive flow into                  relations (Wilcoxon 1945, Lehmann and d’Abrera
the Mekong per year (365 days for the Mekong and                      1998) at a significance level of p < 0.05.

                                                     3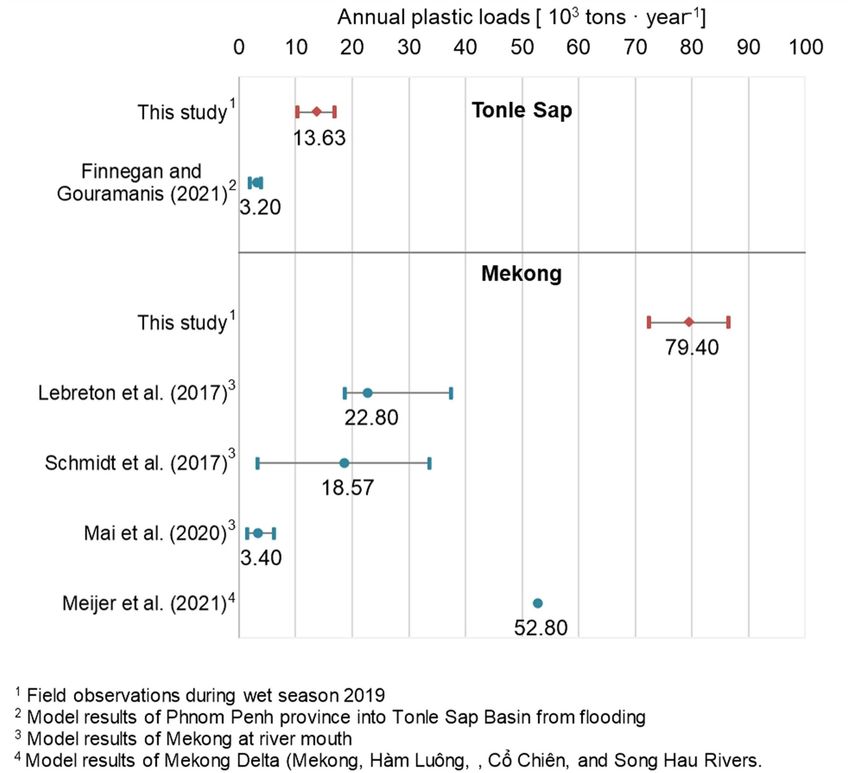
Environ. Res. Lett. 16 (2021) 095009                                                              C J Haberstroh et al

3. Results                                                 a large river system like the Mekong, but also its
                                                           immense transport potential. The Tonle Sap received
3.1. Plastic and flow dynamics                             high count loads (31%) and elevated mass loads
Plastic release and transport were highly variable         (24%) in relation to its discharge (20%) portion.
around Phnom Penh. The Mekong carried plastics             Conversely, the Bassac received 11% of the discharge
received during its long and diverse course, but loads     but only 7% and 5% of the plastic loads.
increased significantly within the city boundaries             When translating the wet season daily loads
(figure 2). We estimated that 4.35 × 10⁹ particles or      into total annual mass loads, our data suggest that
233 tons of plastic per day were moving from Phnom         the Mekong carries upstream of Phnom Penh an
Penh towards Vietnam and the South China Sea in            average of 3.81 × 10⁴ tons yr−1 and downstream
the wet season (3.90 × 10⁹ particles or 218 tons in the    7.94 × 10⁴ tons yr−1 . The Tonle Sap receives
Mekong and 4.50 × 10⁸ particles or 15 tons in the Bas-     1.36 × 10⁴ tons yr−1 (calculated for the six months
sac). Around 1.92 × 10⁹ particles or 75 tons of plastic    of wet season). Lastly, we estimate annual mass loads
per day were carried towards the Tonle Sap lake.           in the Bassac to be 5.56 × 10³ tons yr−1 .
    The Mekong’s discharge is redistributed within
Phnom Penh into the Tonle Sap and the Bas-
                                                           3.3. Cross-sectional distributions of plastic
sac. The Mekong’s discharge decreased by around
                                                           concentrations
15 000 m3 s−1 from Upstream to the Downstream site,
                                                           Plastic concentrations varied within each of the four
possibly due to documented water losses to the flood-
                                                           cross-sections. Across the surface, there was a fluctu-
plain (Kummu et al 2014). Cross-section concentra-
                                                           ation of three to four orders of magnitude in mass
tions were higher at all three outflow sites, except for
                                                           concentration; plastic mass accumulated within the
Bassac during the first campaign. The sample concen-
                                                           channel section and on the left-bank side (table S6
trations at Mekong Downstream and Tonle Sap were
                                                           in supplementary material). Surface counts of plastics
significantly higher than those at Mekong Upstream
                                                           were negatively correlated to flow velocities (p < 0.05)
and Bassac (p < 0.05). In sum, the three outflowing
                                                           and were highest near the shore in the Mekong and in
rivers together carried much higher plastic loads than
                                                           the main channel in the Tonle Sap and Bassac.
upstream from the city.
                                                               In terms of mass, most plastic was floating
    From the first to the second sampling cam-
                                                           (99.6%). Across depths, surface samples had three to
paign, flow volume at Mekong Upstream increased
                                                           five orders of magnitude higher mass concentrations
by 67%, within less than two weeks. The additional
                                                           than most sub-surface samples (figure 4). Mass con-
flow volume reduced plastic concentrations in both
                                                           centrations were negatively correlated with sampling
Mekong and Tonle Sap. The higher flows mobilized
                                                           depth (p < 0.05). The count concentrations indicate
additional plastic loads at Mekong Downstream, while
                                                           that a considerable amount of plastic particles were
at Tonle Sap those flow changes had little impact on
                                                           transported downwards. Despite the pre-dominance
loads. The smaller Bassac was most affected by the
                                                           of plastics at the surface and the overall decline over
change in flows, as more plastics mobilized, increas-
                                                           the sample range of 12 m, plastics were clearly present
ing concentrations and loads, especially in terms of
                                                           throughout the water column.
mass.

3.2. Plastic budget at Phnom Penh                          3.4. Plastic characteristics
Mekong Upstream carried a mean plastic load of             Among the 482 particles analyzed by Raman spectro-
3.23 × 10⁹ # ·d−1 or 1.04 × 10⁵ kg d−1 . The sum of        scopy, all except one were identified as polymers of
loads leaving Phnom Penh through the three distrib-        six different categories (figure 5). The vast majority
utaries was 6.28 × 10⁹ # ·d−1 or 3.07 × 10⁵ kg d−1         were polypropylene (PP; 69%) and polyethylene (PE;
(average of both campaigns), there was more than           12%). Polystyrene (PS) and polyamide/nylon were
a two-fold increase in plastics mass loads in the          encountered in small fractions (4% each). The spectra
Mekong. These numbers suggest that in average,             of a large fraction of particles (11%) were identified
3.05 × 10⁹ # ·d−1 or 2.03 × 10⁵ kg d−1 of plastic          to contain dyes (Hostasol Green G-K and Phthalocy-
entered the river confluence between sampling loc-         anine Blue) commonly used in polymers and paints.
ations (figure 3). These loads translate to approx-        ‘Other’ polymers include polyethylene terephthalate
imately 89 g d−1 of plastic waste released into the        and PP/PE blends, each below 1%. The PP fraction
rivers per capita (approximately 42% of what is            was highest at Mekong Downstream (78%) and lowest
produced; see table S7 in supplementary materi-            at Bassac (55%). In the sub-samples of Mekong Down-
als for calculations). Count concentrations increased      stream and Bassac no PS was encountered, and PE was
by 153%–292%, resulting in 151%–261% higher                less present (6% and 7%) than at Mekong Upstream
count loads. Mass concentrations increased by 126%–        and Tonle Sap (20% and 25%).
2242%, causing a 151%–2296% increase in mass                   In terms of quantity, 65% of the 41 064 particles
loads. The difference in transport estimates between       collected belonged to the smaller microplastics (smal-
both campaigns demonstrates the high variability in        ler than 1 mm), 29% were larger microplastics

                                              4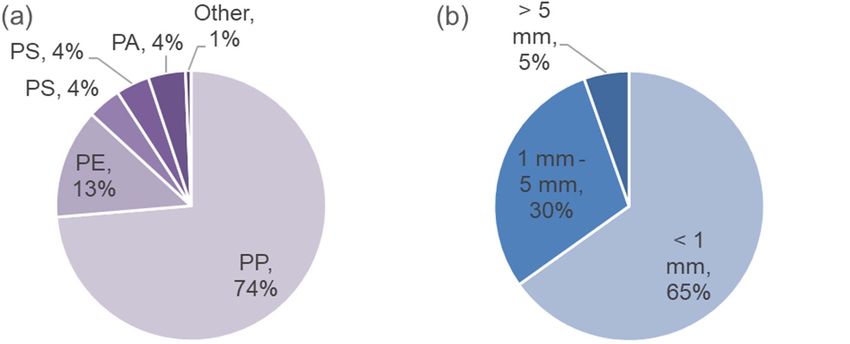
Environ. Res. Lett. 16 (2021) 095009                                                                                  C J Haberstroh et al

   Figure 2. Overview of field results by site: (a) site reference map, (b) river discharge (m3 s−1 ), (c) plastic count concentrations
   (# ·m−3 ), (d) plastic mass concentrations (mg m−3 ), (e) plastic count loads (# ·d−1 ), and (f) plastic mass loads (kg d−1 ). Y-axes
   r in logarithmic scale (range varies from frame to frame). The circle indicates the first and the diamond shape the second
   sampling campaign. Error bars indicate the minimum and maximum range based on the lowest and highest plastic count or mass
   from each sampling event. The map at the top left displays site locations/numbers and flow direction. See tables S2 and S3 for
   detailed results by sample and campaign.

(between 1 and 5 mm), and 6% macroplastics (lar-                       the delta in Vietnam and the South China Sea. Urban
ger than 5 mm; figure 5). These size fractions were                    areas are centers of plastic pollution and release to
not significantly different between samples at dif-                    rivers (Yonkos et al 2014, Mani et al 2016) and Cam-
ferent positions. Mekong Upstream carried less large                   bodia’s capital is, with over 2 million people, the
microplastics than the other sites and Tonle Sap had                   largest city along the course of the Mekong River.
a lower fraction of macroplastics in comparison with                   Phnom Penh generated about 5.83 × 10² tons d−1
the Mekong sites (p < 0.05).                                           of plastic waste in 2015 (Cambodian Ministry of
                                                                       Environment 2019) from which 4.86 × 10² tons d−1
4. Discussion                                                          were collected (21.13%, see table S7 in supple-
                                                                       mentary materials for calculations). Based on our
4.1. The role of Phnom Penh in plastic pollution                       2019 field data and this 2015 waste generation data,
The city of Phnom Penh substantially contributes to                    42% of the plastic waste generated in the city may
plastic loads in the Mekong and pollution reaching                     be entering the Mekong River during wet season

                                                        5
Environ. Res. Lett. 16 (2021) 095009 C J Haberstroh et al
Figure 3. Ratio of discharge and plastic quantities entering and leaving Phnom Penh. The dark red bar is set as 1 and refers to the
inflows of water and plastics at the Mekong Upstream site (see sketch). The blue-, green-, and salmon-colored bars represent the
sum of outflows of water and plastics from the city at the first and second field campaign (CI and CII). The color portions
indicate the approximate contribution of the three sites Mekong Downstream, Tonle Sap, and Bassac.
(2.03 × 10² tons d−1 ). In the four year period between challenges meeting their basic needs (Blettler et al
the two datasets, plastic waste generation and plastic 2018, Chowdhury et al 2021). Plastics, however, are
collection have likely increased, factors which could known to bioaccumulate and travel through the food
affect the accuracy of this statement. chain (Su et al 2018, Cera et al 2020, Sarijan et al
The Chaktomuk confluence connects the Mekong 2020), and to have negative consequences for biod-
to the Tonle Sap, home to one of the world’s largest iversity and ecosystem services in freshwater envir-
freshwater fisheries and a system already under large onments (Azevedo-Santos et al 2021). The continu-
pressure due to hydropower, climate change, and ous pollution of their water bodies and their largest
unsustainable fishing practices (Arias et al 2014, Ngor source of food and livelihood—The Tonle Sap—with
et al 2018, Arias et al 2019). The accumulation of plastics places even greater risks and challenges on
plastics adds another physical and chemical bur- the Cambodian people, flora and fauna. The extent
den on fish and other aquatic organisms (Wright of plastic accumulation and exchange in the Tonle
and Kelly 2017) and ultimately the people living Sap system, as well as its negative impact on eco-
off aquatic ecosystems (van Emmerik and Schwarz system and human health are important subjects for
2020). At an increase of 4%–6% per year, Finnegan future studies with plastic pollution in this important
and Gouramanis (2021) estimated that a total of system.
500 000 tons of plastic will enter the Tonle Sap basin
from 2020 to 2030 under a Business-as-usual scenario 4.2. Plastic loads and characteristics
during the wet season flooding, with the Phnom Penh The cross-section average concentrations in the
catchment contributing 80 000 tons. At a 4% annual Mekong were 1.74 # ·m−3 or 62.62 mg m−3
increase, our field data suggests over 200 000 tons upstream, and 3.96 # ·m−3 or 220.95 mg m−3
of plastic would be carried with the Tonle Sap river downstream of Phnom Penh. The average of the
alone between 2019 and 2030. The risks associ- surface concentrations was 2.59 ± 0.44 # ·m−3 or
ated with plastic pollution are often underestimated, 131.26 ± 89.42 mg m−3 at Mekong Upstream, and
especially in countries whose inhabitants face many 8.07 ± 1.64 # ·m−3 or 431.07 ± 140.41 mg m−3 at
6Environ. Res. Lett. 16 (2021) 095009 C J Haberstroh et al
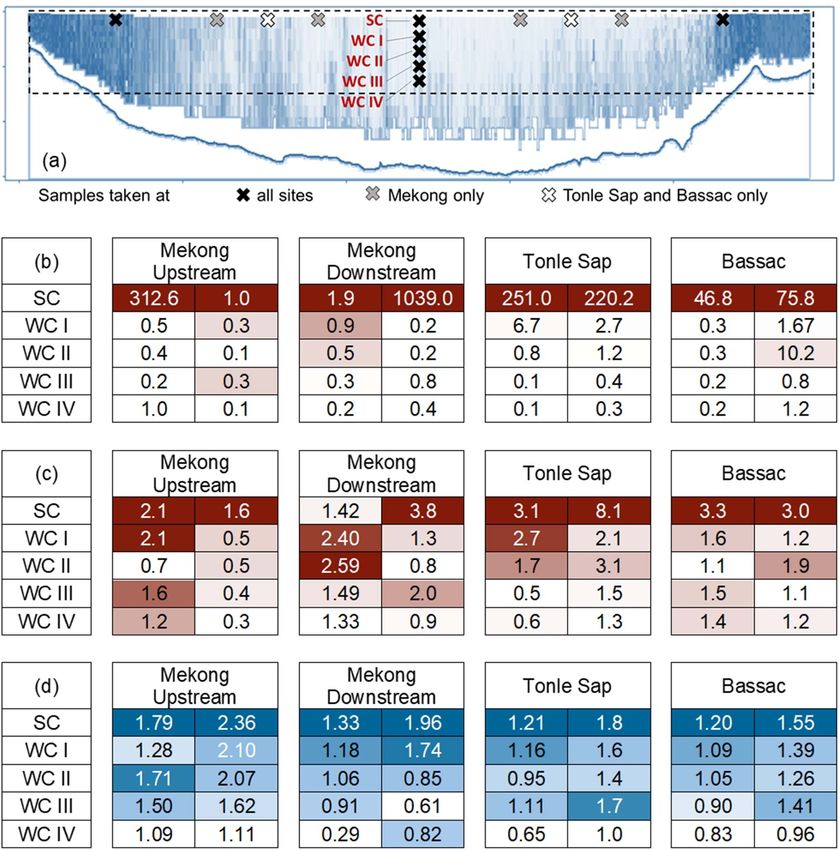
Figure 4. (a) Representative distribution of sampling locations through the river cross-sections. Water depth at the center were
∼27 m at Mekong Upstream, ∼25 m at Mekong Downstream, ∼18 m at Tonle Sap, and ∼14 m at Bassac. Sample depths varied by
sampling event and location, please refer to table S2 in supplementary material for specific sample depths. Vertical distribution of
(b) mass concentrations (mg m−3 ), (c) plastic count concentrations (# ·m−3 ) and (d) local velocities (m s−1 ) at each site. The
left column in sub-tables shows results from the first field campaign, and the right column shows results from the second field
campaign. Conditional coloring according to magnitude (darker red with increasing concentration, darker blue with increasing
velocity).
Mekong Downstream. Average surface water concen- with Raman). This is surprising, especially as expan-
trations in the Yangtze were reported to be much ded PS pieces were very frequently encountered in the
higher (4137.3 # ·m−3 and 805.2 mg m−3 ) by Zhao macroplastics class. To our knowledge, water column
et al (2014) during the wet season, and much lower studies have not been conducted in the world’s largest
(0.9 # ·m−3 ) by Xiong et al (2019) during the dry sea- rivers, and this is one of the first studies to report
son. In the Ganges, Napper et al (2021) found average on plastic concentrations and polymer distributions
surface water concentrations of 38 # ·m−3 (pre- and through the water column of a major river in Asia.
post-monsoon study) and Singh et al (2021) repor-
ted 0.47 # ·m−3 and 0.24 mg m−3 (dry season). PP 4.3. Effects of the confluence
and PE were the dominant plastics in our study, as The Chaktomuk confluence at Phnom Penh is a
it has been reported in many other studies in Asia unique hydrological feature with high exposure to
(e.g. Zhang et al 2015, Lin et al 2018, Eo et al 2019, plastic pollution. The redistribution of plastic loads
Xiong et al 2019, Liu et al 2020b, Ta et al 2020) and to the three outflowing rivers was very heterogen-
across the globe (Schwarz et al 2019). PS, typically ous and not directly related to their discharge. The
found as the third most common polymer, was not plastic concentrations and plastic loads at the four
common in our study (only 4% of particles analyzed sites suggest that relative to its size, the Tonle Sap
7Environ. Res. Lett. 16 (2021) 095009 C J Haberstroh et al
Figure 5. (a) Polymer distribution based on Raman analyzed sub-sample (n = 481) and (b) size distribution of total sample
(n = 41 064). See tables S4 and S5 in supplementary material for the underlying dataset.
received the most plastic loads from the city while water column were not included in this study. Find-
Bassac received the least. During the first sampling ings of previous studies in shallower systems suggest
campaign, plastic count concentrations in the Bas- that near-bed plastics may be an important fraction
sac were even lower than at Mekong upstream. of the total river load at certain times of the year
The impact of water sources and spatial-variation (Morritt et al 2014, Haberstroh et al 2021a). However,
plastic release within the city may explain these pat- near-bed transport and contribution in deep rivers
terns, but would require further assessment. We are has not been studied. Plastic retention is known to
not aware of any other similar studies investigating be favored by river geomorphology, hydrology, and
the effect of river confluences or forks on plastic artificial or natural barriers (Klein et al 2015, Nai-
transport. doo et al 2015, Mani et al 2016) and urban rivers are
suspected to contain accumulation zones of (large)
4.4. Effects of hydrology plastics around cities (Xiong et al 2019, Weideman
Plastic fluxes are highly variable and heterogenous et al 2020). It is likely that plastics released at Phnom
within river cross-sections (Haberstroh et al 2021a). Penh may be retained within the city or along the river
Results of a comparative study of 24 waterways course; plastics may not immediately be transported
in Asia and Europe suggest that there are differ- to the ocean but provide a source of (micro)plastics
ent distributions of floating macroplastics across the to be slowly released over many years (Weideman et al
river span (van Calcar and van Emmerik 2019) and 2020). Flood-induced remobilization of plastic from
microplastics have been shown to vary strongly even riverbanks, riparian vegetation, and floodplains likely
between two nets deployed next to each other (Lie- drive the dynamics of river plastic transport around
dermann et al 2018). As typically observed in rivers, Phnom Penh and in the Lower Mekong (Liro et al
most of the plastic mass was concentrated at the sur- 2020, Roebroek et al 2020).
face and much of it transported with the bulk flow We noticed a decrease of plastic mass concen-
of the river. However, additional quantities may be tration from the first to the second sampling cam-
stored temporarily within or around Phnom Penh. paign at Mekong Upstream but a large increase at
Plastic distribution patterns on the surface depend on Mekong Downstream at the same location within
site-specific environmental and human factors con- the river cross-section (surface center). It appears
trolling the timescale of downstream transport or that upstream of Phnom Penh the increased flows
retention in the river (Liro et al 2020, Haberstroh et al had a diluting effect, while within the city increased
2021b). In the outskirts of Phnom Penh, many com- amounts of plastic mass were added into the system,
munities are located along the river. Docks and float- likely flushed in with the stormwater runoff. Storm
ing houses provide spatial features that likely slow events have led to both dilution and intensification of
down near-shore flows, and large accumulations of plastic pollution in urban rivers and increase dynam-
plastics were—anecdotally—observed around river ics of plastic loads (Cheung et al 2019, Haberstroh
communities during the field visits. et al 2021b).
Our cross-section data indicates accumulation in
the slow-flow sections as well as movement down- 4.5. Comparison with current modeling efforts
wards into the lower water column of the rivers. When compared to four global and one local model of
Plastic loads in the Mekong could be, therefore, even river plastic loads, the results of our field study indic-
higher than reported here, as loads in the bottom ate much larger annual mass loads (figure 6). Four
8Environ. Res. Lett. 16 (2021) 095009 C J Haberstroh et al
Figure 6. Annual plastic loads (tons yr−1 ) in Mekong and Tonle Sap River compared to models estimates. The diamond and circle
and respective colors indicate mean values (this study and Schmidt et al 2017) and medium estimates (Lebreton et al 2017, Mai
et al 2020, Finnegan and Gouramanis 2021, Meijer et al 2021) and the error bars the minimum and maximum range.
of the models are regression models using Misman- provides the lowest estimates for plastic loads of all
aged Plastic Waste or Human Development Index models. The sum of plastic loads from Mekong, Hàm
as a key predictor and supported by other para- Luông, Cổ Chiên, and Song Hau at discharge into
meters such as population density, discharge, run- the sea are 1.6% of our measurements at Mekong
off, and solid waste generation (Lebreton et al 2017, Downstream.
Schmidt et al 2017, Mai et al 2020, Finnegan and We also compared our field estimates with mod-
Gouramanis 2021). The most recent global study eling results from Finnegan and Gouramanis (2021)
presents a probabilistic distributed model for macro- for the Tonle Sap basin between 2000 and 2030.
plastics that derived the probability of plastic trans- For our sampling year (2019), the model sug-
port from land to river and from river to the sea gests a contribution of 2063–3987 tons from the
from geographical indicators (Meijer et al 2021). Phnom Penh province (16% of the entire catchment).
The plastic loads we measured passed Phnom Penh This contribution is much lower than our estim-
at Mekong Downstream during wet season (7.24– ates of transport into the Tonle Sap lake (10 309–
8.63 × 10⁴ tons yr−1 ) are much higher than any of the 16 942 tons yr−1 ) during the wet season. In short,
model results. In fact, they double the highest estim- this comparison suggests that not only there is a
ates from Lebreton et al (2017) and Schmidt et al quite a bit of discrepancy among model estimates of
(2017). Despite their improved regression results in plastic waste export from the Mekong, but also that
comparison with its predecessors, the model by Mai all published models greatly underestimate our field
et al (2020) underestimates our mass load measure- measurements.
ments by one order of magnitude. For the Mekong Collected during the wet season (discharge of
Delta, the probabilistic model of Meijer et al (2021) 24 262 m3 s−1 ), our data could represent a high
9Environ. Res. Lett. 16 (2021) 095009 C J Haberstroh et al
estimate of annual plastic loads, assuming that mass The data that support the findings of this study are
loads increase with flow. This assumption, as our data available upon reasonable request from the authors.
and observations in other lowland, concentration-
limited rivers indicate, may not be the case (Haber- Acknowledgments
stroh et al 2021b). Furthermore, we argue that loads
in the lower Mekong may be equal or higher dur- This research was supported by the CUAHSI
ing the dry season, as the reversed flows of the Tonle Pathfinder Fellowship, the University of South
Sap river likely carry plastics from the Tonle Sap Florida (USF) Signature Research Fellowship, USF
basin and surrounding communities, adding another SIP (Strategic Investment Pool) Award, and the USF
source of plastic pollution to the Mekong (Finnegan Nexus Initiative (UNI). We thank the USF Nanotech-
and Gouramanis 2021). Overall, the Mekong and nology Research and Education Center (NREC) and
other large rivers play an important role on global the Institute of Technology of Cambodia (ITC) in
plastic pollution. Therefore, monitoring needs to be Phnom Penh for their support and the provision of
prioritized to challenge and improve models and to facilities as well as field and laboratory equipment.
facilitate management and intervention strategies. As Thanks to Dr Chantha Oeurng for facilitating the
the number of field data collections grows in the research collaboration and Dr Mahmood Nachabe,
world’s largest and most polluted rivers, a field-based Dr Amy Siuda, and Dr Amy Stuart for providing
ranking can emerge to validate or correct model pre- feedback on previous versions of this manuscript.
dictions of plastic loads. We especially acknowledge the USF undergradu-
ate research assistant Jenna Brooks and the ITC
5. Conclusion undergraduate research assistants Nai Chhaiheang,
Khen Chanlyda, Veng Visal, Thoy Sophon, Heang
This study investigated plastic transport in the Vannary and Kong Leang Kim for their help in field
Mekong, a major river and key region in global plastic and laboratory. This manuscript was prepared while
pollution, with potential to release large quantities M E A was a McKnight Junior Faculty Fellow; support
of plastics to the ocean and sensitive freshwater eco- from the Florida Education Fund is acknowledged.
systems. Further, this study determined micro and We further want to acknowledge Ms Lakanna
macro plastic pollution from the largest city along the Kounkunn for translating parts of the 2019 ‘Report
Mekong (Phnom Penh), as well as plastic transport on Environmental State’ of the Cambodian Ministry
through a unique river confluence. During the peak of Environment from Khmer to English.
of the Mekong’s wet season, 42% of the plastic waste Thanks also to the anonymous reviewers whose
produced in the city was released into the river system feedback improved this manuscript.
towards both the South China Sea and the Tonle Sap
lake, contributing significantly to marine plastic pol- Author Information
lution and putting a freshwater ecosystem that is crit-
ical for Cambodia’s livelihoods and biodiversity—the C J H contributed to conceptualization, data curation,
Tonle Sap—at risk. Near-surface transport domin- formal analysis, investigation, methodology, fund-
ated plastic loads in the river cross-sections, especially ing acquisition, project administration, visualiza-
in terms of mass; yet, mixing was observed well down tion, and writing—original draft. M E A contributed
the water column for all three distributaries, suggest- to conceptualization, data curation, investigation,
ing that significant plastic quantities may be retained methodology, funding acquisition, project adminis-
in the riverbed as well. Additional field studies during tration, resources, supervision, and writing—review
other seasons would provide insight into annual vari- and editing. Z Y contributed to investigation, meth-
ability and could explore the changing dynamics dur- odology, and writing—review and editing. S T con-
ing the Tonle Sap flow reversal. Furthermore, investig- tributed to project administration and writing—
ating the retention and mobilization of plastics in and review and editing. M C W contributed to resources
close to the bed of deep rivers remains a worthy chal- and writing—review and editing.
lenge for future studies. This study provided the first
field-based estimates of Phnom Penh’s and Mekong’s ORCID iDs
plastic pollution, which is an important bench-
mark dataset to improve models and guide waste Charlotte J Haberstroh https://orcid.org/0000-
management. 0002-2334-6683
Mauricio E Arias https://orcid.org/0000-0002-
Data availability statement 8805-6353
Zhewen Yin https://orcid.org/0000-0002-6855-
Most data collected during this study is provided 6799
in the Supplementary Materials. Additional inform- Michael C Wang https://orcid.org/0000-0003-
ation can be provided on reasonable request. 3300-852X
10Environ. Res. Lett. 16 (2021) 095009 C J Haberstroh et al
References identify the knowledge gaps and future research priorities
Sci. Total Environ. 586 127–41
Adamson P T et al 2009 The hydrology of the Mekong River The Jambeck J R, Geyer R, Wilcox C, Siegler T R, Perryman M,
Mekong (New York: Academic) pp 53–76 Andrady A, Narayan R and Law K L 2015 Plastic waste
Arias M E, Cochrane T A, Kummu M, Lauri H, Holtgrieve G W, inputs from land into the ocean Science 347 768–71
Koponen J and Piman T 2014 Impacts of hydropower and Klein S, Worch E and Knepper T P 2015 Occurrence and spatial
climate change on drivers of ecological productivity of distribution of microplastics in river shore sediments of the
Southeast Asia’s most important wetland Ecol. Modell. Rhine-Main area in Germany Environ. Sci. Technol.
272 252–63 49 6070–6
Arias M E, Cochrane T A, Piman T, Kummu M, Caruso B S and Kummu M, Tes S, Yin S, Adamson P, Józsa J, Koponen J, Richey J
Killeen T J 2012 Quantifying changes in flooding and and Sarkkula J 2014 Water balance analysis for the
habitats in the Tonle Sap Lake (Cambodia) caused by water Tonle Sap lake—floodplain system Hydrol. Process.
infrastructure development and climate change in the 28 1722–33
Mekong Basin J. Environ. Manage. 112 53–66 Lahens L, Strady E, Kieu-Le T-C, Dris R, Boukerma K, Rinnert E,
Arias M E, Holtgrieve G W, Ngor P B, Dang T D and Piman T Gasperi J and Tassin B 2018 Macroplastic and microplastic
2019 Maintaining perspective of ongoing environmental contamination assessment of a tropical river (Saigon River,
change in the Mekong floodplains Curr. Opin. Environ. Vietnam) transversed by a developing megacity Environ.
Sustain. 37 1–7 Pollut. 236 661–71
Azevedo-Santos V M et al 2021 Plastic pollution: a focus on Lebreton L C M, van der Zwet J, Damsteeg J-W, Slat B, Andrady A
freshwater biodiversity Ambio 50 1313–24 and Reisser J 2017 River plastic emissions to the world’s
Bellasi A, Binda G, Pozzi A, Galafassi S, Volta P and Bettinetti R oceans Nat. Commun. 8 15611
2020 Microplastic contamination in freshwater Lehmann E L and d’Abrera H J M 1998 Nonparametrics: Statistical
environments: a review, focusing on interactions with Methods Based on Ranks (Englewood Cliffs, NJ:
sediments and benthic organisms Environments 7 30 Prentice-Hall)
Blettler M C M, Abrial E, Khan F R, Sivri N and Espinola L A 2018 Liedermann M, Gmeiner P, Pessenlehner S, Haimann M,
Freshwater plastic pollution: recognizing research biases and Hohenblum P and Habersack H 2018 A methodology for
identifying knowledge gaps Water Res. 143 416–24 measuring microplastic transport in large or medium rivers
Cambodian Ministry of Environment 2019 Report on Water 10 414
environmental state Third publication in Khmer Lin L, Zuo L-Z, Peng J-P, Cai L-Q, Fok L, Yan Y, Li H-X and
Cera A, Cesarini G and Scalici M 2020 Microplastics in freshwater: Xu X-R 2018 Occurrence and distribution of microplastics
what is the news from the world? Diversity 12 276 in an urban river: a case study in the Pearl River along
Cheung P K, Hung P L and Fok L 2019 River microplastic Guangzhou City, China Sci. Total Environ. 644 375–81
contamination and dynamics upon a rainfall event in Hong Liro M, Emmerik T V, Wyżga B, Liro J and Mikuś P 2020
Kong, China Environ. Process. 6 253–64 Macroplastic storage and remobilization in rivers Water
Chowdhury G W, Koldewey H J, Duncan E, Napper I E, 12 2055
Niloy M N H, Nelms S E, Sarker S, Bhola S and Nishat B Liu L-Y, Mai L and Zeng E Y 2020a Plastic and microplastic
2021 Plastic pollution in aquatic systems in Bangladesh: a pollution: from ocean smog to planetary boundary threats A
review of current knowledge Sci. Total Environ. New Paradigm for Environmental Chemistry and Toxicology
761 143285 ed G Jiang and X Li (Singapore: Springer) pp 229–40
Denny L 2016 Reforming solid waste management in Phnom Liu Y, Zhang J, Cai C, He Y, Chen L, Xiong X, Huang H, Tao S and
Penh (Asia Foundation/Overseas Development Institute) Liu W 2020b Occurrence and characteristics of
Dietsch B, Densmore B and Wilson R 2015 Hydrographic Survey of microplastics in the Haihe River: an investigation of a
Chaktomuk, the Confluence of the Mekong, Tonlé Sap, and seagoing river flowing through a megacity in northern
Bassac Rivers near Phnom Penh, Cambodia, 2012 (Reston, China Environ. Pollut. 262 114261
VA: US Department of the Interior, US Geological Survey) Mai L, Sun X-F, Xia L-L, Bao L-J, Liu L-Y and Zeng E Y 2020
Dris R et al 2018 Microplastic contamination in freshwater Global riverine plastic outflows Environ. Sci. Technol.
systems: methodological challenges, occurrence and sources 54 10049–56
Microplastic Contamination in Aquatic Environments Mani T, Hauk A, Walter U and Burkhardt-Holm P 2016
(Amsterdam: Elsevier) pp 51–93 Microplastics profile along the Rhine River Sci. Rep. 5 17988
Eo S, Hong S H, Song Y K, Han G M and Shim W J 2019 Meijer L J J, van Emmerik T, van der Ent R, Schmidt C and
Spatiotemporal distribution and annual load of Lebreton L 2021 More than 1000 rivers account for 80% of
microplastics in the Nakdong River, South Korea Water Res. global riverine plastic emissions into the ocean Sci. Adv.
160 228–37 7 eaaz5803
Finnegan A M D and Gouramanis C 2021 Projected plastic waste Morritt D, Stefanoudis P V, Pearce D, Crimmen O A and Clark P F
loss scenarios between 2000 and 2030 into the largest 2014 Plastic in the Thames: a river runs through it Mar.
freshwater-lake system in Southeast Asia Sci. Rep. Pollut. Bull. 78 196–200
11 3897 Naidoo T, Glassom D and Smit A J 2015 Plastic pollution in five
Haberstroh C J et al 2021a Effects of hydrodynamics on the urban estuaries of KwaZulu-Natal, South Africa Mar. Pollut.
cross-sectional distribution and transport of plastic in an Bull. 101 473–80
urban coastal river Water Environ. Res. 93 186–200 Napper I E et al 2021 The abundance and characteristics of
Haberstroh C J et al 2021b Effects of urban hydrology on plastic microplastics in surface water in the transboundary Ganges
transport in a subtropical river ACS ES&T Water 1 8 River Environ. Pollut. 274 116348
Hoornweg D and Bhada-Tata P 2012 What a waste—a global Ngor P B, McCann K S, Grenouillet G, So N, McMeans B C,
review of solid waste management (Washington, DC: World Fraser E and Lek S 2018 Evidence of indiscriminate fishing
Bank) (available at: https://siteresources.worldbank.org/ effects in one of the world’s largest inland fisheries Sci.
INTURBANDEVELOPMENT/Resources/336387- Rep. 8 1–12
1334852610766/What_a_Waste2012_Final.pdf) Roebroek C T J et al 2020 Plastic in global rivers: are floods
Horton A A and Dixon S J 2018 Microplastics: an introduction to making it worse? preprint In Review (https://doi.org/
environmental transport processes Wiley Interdiscip. Rev. 10.21203/rs.3.rs-43330/v1)
Water 5 e1268 Sabo J L, Ruhi A, Holtgrieve G W, Elliott V, Arias M E, Ngor P B,
Horton A A, Walton A, Spurgeon D J, Lahive E and Svendsen C Räsänen T A and Nam S 2017 Designing river flows to
2017 Microplastics in freshwater and terrestrial improve food security futures in the Lower Mekong Basin
environments: evaluating the current understanding to Science 358 eaao1053
11Environ. Res. Lett. 16 (2021) 095009 C J Haberstroh et al
Sarijan S et al 2020 Microplastics in freshwater ecosystems: a van Calcar C J and van Emmerik T H M 2019 Abundance of
recent review of occurrence, analysis, potential impacts, and plastic debris across European and Asian rivers Environ. Res.
research needs Environ. Sci. Poll. Res. 28 1341–56 Lett. 14 124051
Schmidt C, Krauth T and Wagner S 2017 Export of plastic van Emmerik T, Loozen M, van Oeveren K, Buschman F and
debris by rivers into the Sea Environ. Sci. Technol. Prinsen G 2019a Riverine plastic emission from Jakarta into
51 12246–53 the ocean Environ. Res. Lett. 14 084033
Schwarz A E, Ligthart T N, Boukris E and van Harmelen T 2019 van Emmerik T and Schwarz A 2020 Plastic debris in rivers WIREs
Sources, transport, and accumulation of different types of Water 7 e1398
plastic litter in aquatic environments: a review study Mar. van Emmerik T, Strady E, Kieu-Le T-C, Nguyen L and Gratiot N
Pollut. Bull. 143 92–100 2019b Seasonality of riverine macroplastic transport Sci.
Seng B, Fujiwara T and Seng B 2018 Suitability assessment for Rep. 9 1–9
handling methods of municipal solid waste Glob. J. Environ. Weideman E A, Perold V and Ryan P G 2020 Limited
Sci. Manage. 4 113–26 long-distance transport of plastic pollution by the
Seng B, Kaneko H, Hirayama K and Katayama-Hirayama K Orange-Vaal River system, South Africa Sci. Total Environ.
2011 Municipal solid waste management in Phnom 727 138653
Penh, capital city of Cambodia Waste Manage. Res. Wilcoxon F 1945 Individual comparisons by ranking methods
29 491–500 Biomet. Bull. 1 80
Seng K 2015 Analysis of Solid Waste Composition and Waste Windsor F M, Durance I, Horton A A, Thompson R C, Tyler C R
Forecasting in Phnom Penh with the Production of Methane and Ormerod S J 2019 A catchment-scale perspective of
from Dangkor Landfill (Cambodia: Institute of Technology plastic pollution Glob. Change Biol. 25 1207–21
of Cambodia) Wright S L and Kelly F J 2017 Plastic and human health: a micro
Silva-Cavalcanti J S, Silva J D B, França E J D, Araújo M C B D and issue? Environ. Sci. Technol. 51 6634–47
Gusmão F 2017 Microplastics ingestion by a common Xiong X, Wu C, Elser J J, Mei Z and Hao Y 2019 Occurrence and
tropical freshwater fishing resource Environ. Pollut. fate of microplastic debris in middle and lower reaches of
221 218–26 the Yangtze River—from inland to the sea Sci. Total Environ.
Singh N, Mondal A, Bagri A, Tiwari E, Khandelwal N, 659 66–73
Monikh F A and Darbha G K 2021 Characteristics and Yonkos L T, Friedel E A, Perez-Reyes A C, Ghosal S and
spatial distribution of microplastics in the lower Arthur C D 2014 Microplastics in Four Estuarine Rivers in
Ganga River water and sediment Mar. Pollut. Bull. the Chesapeake Bay, U.S.A. Environ. Sci. Technol.
163 111960 48 14195–202
Su L, Cai H, Kolandhasamy P, Wu C, Rochman C M and Shi H Zhang K, Gong W, Lv J, Xiong X and Wu C 2015 Accumulation of
2018 Using the Asian clam as an indicator of microplastic floating microplastics behind the Three Gorges Dam
pollution in freshwater ecosystems Environ. Pollut. Environ. Pollut. 204 117–23
234 347–55 Zhao S, Zhu L, Wang T and Li D 2014 Suspended microplastics in
Ta A T, Babel S and Haarstick A 2020 Microplastics the surface water of the Yangtze Estuary System, China: first
contamination in a high population density area of the Chao observations on occurrence, distribution Mar. Pollut. Bull.
Phraya River, Bangkok J. Eng. Technol. Sci. 52 534 86 562–8
12You can also read