What determines the sign of the evapotranspiration response to afforestation in European summer? - Biogeosciences
←
→
Page content transcription
If your browser does not render page correctly, please read the page content below
Biogeosciences, 18, 1499–1510, 2021
https://doi.org/10.5194/bg-18-1499-2021
© Author(s) 2021. This work is distributed under
the Creative Commons Attribution 4.0 License.

What determines the sign of the evapotranspiration response to
afforestation in European summer?
Marcus Breil1 , Edouard L. Davin2 , and Diana Rechid3
1 Institute
          for Meteorology and Climate Research, Karlsruhe Institute of Technology, Karlsruhe, Germany
2 Department  of Environmental Systems Science, ETH Zurich, Zurich, Switzerland
3 Climate Service Center Germany, Helmholtz-Zentrum Geesthacht, Hamburg, Germany

Correspondence: Marcus Breil (marcus.breil@kit.edu)

Received: 16 July 2020 – Discussion started: 14 August 2020
Revised: 14 December 2020 – Accepted: 18 January 2021 – Published: 3 March 2021

Abstract. Uncertainties in the evapotranspiration response to      higher. The interplay of these two counteracting factors de-
afforestation constitute a major source of disagreement be-        pends on the latitude and the prevailing forest type in a re-
tween model-based studies of the potential climate benefits        gion.
of forests. Forests typically have higher evapotranspiration
rates than grasslands in the tropics, but whether this is also
the case in the midlatitudes is still debated. To explore this
question and the underlying physical processes behind these        1   Introduction
varying evapotranspiration rates of forests and grasslands in
more detail, a regional model study with idealized afforesta-      Afforestation is frequently discussed as a potential strategy
tion scenarios was performed for Europe. In the first experi-      to mitigate the effects of human-induced climate change
ment, Europe was maximally forested, and in the second one,        (e.g., Sonntag et al., 2016; Harper et al., 2018; Roe et al.,
all forests were turned into grassland.                            2019; Davin et al., 2020). One benefit of afforestation is that
   The results of this modeling study exhibit the same con-        forests are generally able to take up more CO2 than grass-
tradicting evapotranspiration characteristics of forests and       lands (IPCC, 2019). Another advantage is that forests can
grasslands as documented in observational studies, but by          have a cooling effect on the land surface due to increased
means of an additional sensitivity simulation in which the         evapotranspiration rates compared to grasslands (e.g., Bo-
surface roughness of the forest was reduced to grassland, the      nan, 2008; Bright et al., 2017; Duveiller et al., 2018). Ac-
mechanisms behind these varying evapotranspiration rates           cording to our present knowledge about the biogeophysical
could be revealed. Due to the higher surface roughness of          effects of forests and grasslands, this increased forest evapo-
a forest, solar radiation is more efficiently transformed into     transpiration is caused by deeper roots (Schenk and Jackson,
turbulent sensible heat fluxes, leading to lower surface tem-      2003) and a higher leaf area index (LAI; e.g., Henderson-
peratures (top of vegetation) than in grassland. The saturation    Sellers, 1993) than in grassland, whose influence can be at-
deficit between the vegetation and the atmosphere, which de-       tenuated by the reduced photosynthetic activity of forests and
pends on the surface temperature, is consequently reduced          an associated stomata closure (Leuzinger et al., 2005). The
over forests. This reduced saturation deficit counteracts the      evaporative cooling effect is particularly pronounced in the
transpiration-facilitating characteristics of a forest (deeper     tropics (Von Randow et al., 2004) but is unclear at midlati-
roots, a higher leaf area index, LAI, and lower albedo values      tudes (Bonan, 2008). While several observation-based stud-
than grassland). If the impact of the reduced saturation deficit   ies show the higher evapotranspiration rates of forests at mid-
exceeds the effects of the transpiration-facilitating charac-      latitudes (e.g., Zhang et al., 2001; Li et al., 2015; Chen et al.,
teristics of a forest, evapotranspiration is reduced compared      2018; Duveiller et al., 2018), some studies exhibit an oppo-
to grassland. If not, evapotranspiration rates of forests are      site behavior of forests with reduced evapotranspiration rates
                                                                   compared to grasslands (e.g., Wicke and Bernhofer, 1996;

Published by Copernicus Publications on behalf of the European Geosciences Union.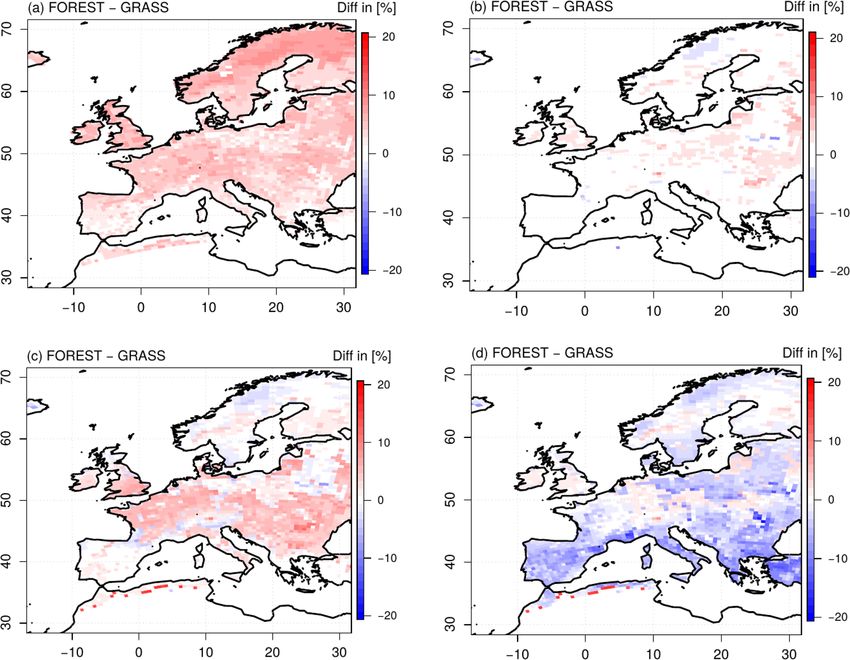
1500                                                                 M. Breil et al.: Evapotranspiration response to afforestation

Teuling et al., 2010; Williams et al., 2012). The actual evapo-         discussed in detail. Subsequently, the setup of the performed
transpiration rates of forests and grasslands are therefore sub-        simulations is described.
jects of controversial discussions within the scientific com-
munity (e.g., Teuling, 2018).                                           2.1     Theoretical background
   An adequate methodology to improve the understanding
about this contradicting evapotranspiration responses is the            Transpiration can be described as a water flux from a veg-
application of model simulations in which factorial experi-             etated land surface into the atmosphere. This flux is deter-
ments are performed in order to disentangle the role of differ-         mined by two factors: (1) the saturation deficit between the
ent processes. Also within executed model intercomparison               vegetation and the atmosphere qs (Tscf )−qa and (2) a transfer
studies, a number of models simulate increased evapotran-               coefficient c.
spiration, and some models simulate decreased evapotranspi-
                                                                        Q = p × c (qs (Tscf ) − qa ) ,                               (1)
ration in forests during summer (de Noblet-Ducoudré et al.,
2012; Lejeune et al., 2017; Davin et al., 2020). The mech-              where qs (Tscf ) depends on the surface temperature Tscf and is
anisms behind the diverging evapotranspirative behavior of              derived from the Magnus equation. The surface temperature
forests and grasslands in the midlatitudes are consequently             is in this case the temperature at the top of the vegetation, and
still an unsolved issue. Thus, to be able to correctly assess           p is the air density. In state of the art LSMs, the transfer co-
the suitability of afforestation as an effective mitigation strat-      efficient c is generally regarded as a resistance that has to be
egy in the midlatitudes, the understanding of the biogeophys-           overcome by the transpiration flux (e.g., Niu et al. 2011; Ole-
ical processes in forests and grasslands needs to be improved.          son et al., 2013). In VEG3D, the LSM applied in this study,
Only if the evapotranspirative behavior of forests and grass-           this drag coefficient is described through two resistances in
lands can be properly explained can the impact of these land            series (Deardorff, 1978 and Taconet et al., 1986): an atmo-
use types on the near surface climate conditions be evaluated.          spheric resistance ra and a canopy resistance rc .
   In this study, therefore, the question of how afforestation
can lead in some parts of the midlatitudes to increased evapo-                 fracdry
                                                                        c=             ,                                             (2)
transpiration rates in summer and in some regions to a reduc-                  rc + ra
tion will be further explored. For this, idealized and extensive
afforestation scenarios are applied in regional climate simu-           where fracdry represents the fraction of dry leaf surface.
lations for Europe. This approach allows for an isolated view              In ra , the turbulent atmospheric conditions for the transfer
on the biogeophysical processes in forest and grasslands on             of water vapor are included, which are calculated by means
a large scale which is not provided by selective point obser-           of an empirical parameter Cleaf and the friction velocity u∗ .
vations. The theoretical background of the transpiration flux                  Cleaf
calculation and the simulation setup of the afforestation ex-           ra =         ,                                               (3)
                                                                                u∗
periments is provided in Sect. 2. Based on the presented sim-
ulation results in Sect. 3, a mechanism explaining the varying          where Cleaf describes an empirical interrelation between the
evapotranspiration rates of forest and grasslands is discussed          turbulent exchange and the leaf area index (LAI; Taconet et
in Sect. 4.                                                             al., 1986) in relation to the leaf geometry, represented by the
                                                                        plant-specific parameter cveg (Goudriaan, 1977).

2   Method                                                                           1 + 0.5 × LAI
                                                                        Cleaf =                      ,                               (4)
                                                                                   0.04 × LAI × cveg
To investigate the processes determining the sign of the evap-
otranspiration response to afforestation in the midlatitudes,           where u∗ is classically derived from the Monin–Obukhov
simulations with the regional climate model COSMO-CLM                   similarity theory (Monin and Obukhov, 1954) and as such
(Rockel et al., 2008) coupled with the land surface model               mainly dependent on z0 .
(LSM) VEG3D (Breil and Schädler, 2017) are performed for
                                                                                       k vza − vz0
Europe. Since afforestation is primarily affecting the tran-            u∗ =                       ,                   (5)
spiration characteristics of a land surface, it is assumed that               ln zz0a + 9 Lza∗ + 9 Lz0∗
changes in total evapotranspiration in summer are mainly
caused by changes in the transpiration rates as indicated               where za is the height of the lowest atmospheric model level,
by, e.g., Meier et al. (2018). The focus of the paper will              z0 is the roughness length, vza and vz0 are consequently the
therefore be on the impact of afforestation on transpiration            wind velocities at the respective heights, k is the Karman
changes, and we try to explain evapotranspiration responses             constant, L∗ is the Monin–Obukhov length, and 9 is a sta-
by changes in the transpiration characteristics. According to           bility function based on Businger et al. (1971) establishing
this, in a first step, the theoretical background of transpiration      empirical relationships in turbulent motion which depend on
is presented, and its implementation in the LSM VEG3D is                the atmospheric stratification. According to Eqs. (4) and (5),

Biogeosciences, 18, 1499–1510, 2021                                                         https://doi.org/10.5194/bg-18-1499-2021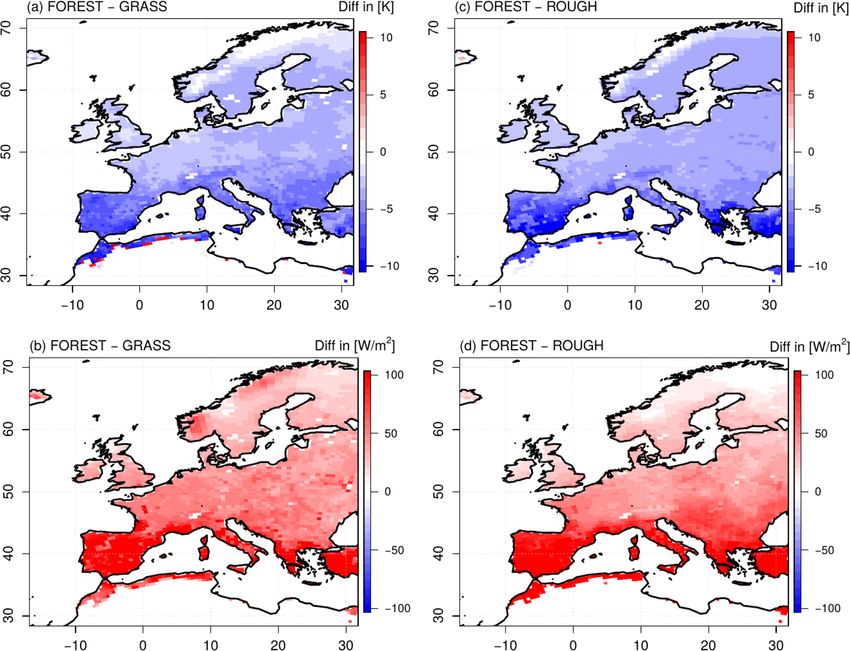
M. Breil et al.: Evapotranspiration response to afforestation                                                                     1501

Table 1. The impact of the different influencing factors on transpi-   grasslands (Taconet et al., 1986). Thus, ra is reduced and
ration of forests in comparison to grasslands.                         transpiration is facilitated.
                                                                          The surface roughness of a forest is higher than of grass-
          Parameter              Impact on transpiration               land (Garratt, 1993; Henderson-Sellers, 1993). The turbulent
          Leaf geometry          Facilitates transpiration             mixing is consequently increased, which in turn reduces ra
          Surface roughness      Facilitates transpiration             and facilitates transpiration.
          LAI                    Facilitates transpiration                The LAI for forests is higher than for grassland
          Albedo                 Facilitates transpiration             (e.g., Henderson-Sellers, 1993). With a high LAI, more wa-
          Root depth             Facilitates transpiration             ter can be transpired. The canopy resistance rc of forests is
          Stomatal resistance    Facilitates transpiration             therefore reduced. Furthermore, a high LAI increases inter-
          Saturation deficit     Attenuates transpiration              ception, which additionally increases evapotranspiration.
                                                                          A forest is characterized by lower albedo values than
                                                                       grassland (Garratt, 1993; Henderson-Sellers, 1993). Thus,
ra is consequently affected by three vegetation parameters,            the net shortwave radiation S is increased. This leads par-
namely a plant-specific parameter cveg (a), the surface rough-         ticularly in summer to a reduced canopy resistance rc which
ness z0 (b) and the LAI (c), but out of these three parame-            facilitates transpiration.
ters, the influence of the surface roughness (b) on ra and thus           The roots in a forest reach deeper than in grassland
on the transfer coefficient c is clearly dominant (Goudriaan,          (Schenk and Jackson, 2003). During dry summer conditions,
1977).                                                                 therefore, the available amount of water for transpiration is
   In rc , the plant physiological processes of transpiration          increased in a forest. The water stress for the trees is conse-
are considered. Soil water is thereby extracted by the roots           quently low, leading again to a reduced rc .
and transported into the leaves. There, the water is released             Values of rmin for forest and grassland vary in literature but
through the stomata into the atmosphere. Plants are regulat-           are on a similar level in VEG3D, as stated by Garratt (1993).
ing this water flux by the closure of the stomata. In the case         In the presented study, a lower rmin for forest is used than for
of high solar radiation, for instance, stomata can be opened           grassland, leading to lower rc values under the same bound-
to increase the evaporative cooling. On the other hand, in the         ary conditions.
case of limited water availability, the stomata can be closed,            Thus, each of the six factors (a–f ) which affect the trans-
and transpiration is reduced. These different canopy func-             fer coefficient c (Eq. 2) in the transpiration flux calculation
tions are described by rc (Deardorff, 1978 and Taconet et al.,         (Eq. 1) in VEG3D is reduced in forest compared to grassland
1986):                                                                 and thus facilitates transpiration during summer. According
                                                                       to Eq. (1), a reduced transpiration in a forest must conse-
                                                      !
                                               wwilt 2

          1 + 0.5 × LAI         Smax                                   quently be connected to a reduced saturation deficit between
rc = rmin                                  +            ,       (6)
               LAI         S + 0.03 × Smax     wroot                   the vegetation and the atmosphere. In the following, there-
                                                                       fore, the impact of this saturation deficit on the transpiration
where rc depends on the net shortwave radiation, whereby               fluxes of forests and grasslands and its relations to the vege-
S is the actual net shortwave radiation and Smax constitutes           tation parameters (a–f ) is investigated. For this, an idealized
a seasonally varying maximum shortwave radiation. Vegeta-              model study is conducted to explore the reasons for the un-
tion affects these components by the albedo parameter (d).             certain effects of afforestation in European summer.
In VEG3D, a bulk surface albedo with prescribed parameter
values is used depending on the vegetation type. Addition-             2.2   Simulation setup
ally, rc depends on the soil water availability, which is de-
scribed by the relation of the wilting point wwilt to the soil         As described in the previous section, transpiration depends
water content within the rooted soil wroot . Vegetation affects        on two factors: (1) the saturation deficit between the surface
the soil water content by the root depth parameter (e). Fur-           and the atmosphere and (2) the transfer coefficient c. The
thermore, rc is controlled by the LAI (c) and a plant-specific         second factor can thereby be described by two resistances,
stomata coefficient rmin (f ) representing plant-specific stom-        ra and rc , which are controlled by six vegetation parameters
atal resistance characteristics (Deardorff, 1978).                     (a–f ). Now, the impact of all these components on the tran-
   Thus, in VEG3D, transpiration depends on six different              spiration flux of forests and grasslands is investigated by per-
vegetation parameters (a–f ) besides the humidity gradient             forming idealized afforestation simulations with a regional
(1) (Table 1). The values of these six vegetation parameters           climate model.
in VEG3D are in line with the parameter values used in other              For this, two extreme land use change scenarios for Eu-
state of the art LSMs (Breil et at., 2020). In a forest, these         rope are simulated. In the first experiment, Europe is com-
vegetation characteristics are different to grassland.                 pletely covered with forest where trees can realistically grow
   Trees have generally larger leaves than grass. The leaf ge-         (FOREST); in the second experiment, all forest is turned into
ometry parameter cveg is therefore higher for forests than for         grassland (GRASS). By using this approach, the differences

https://doi.org/10.5194/bg-18-1499-2021                                                       Biogeosciences, 18, 1499–1510, 2021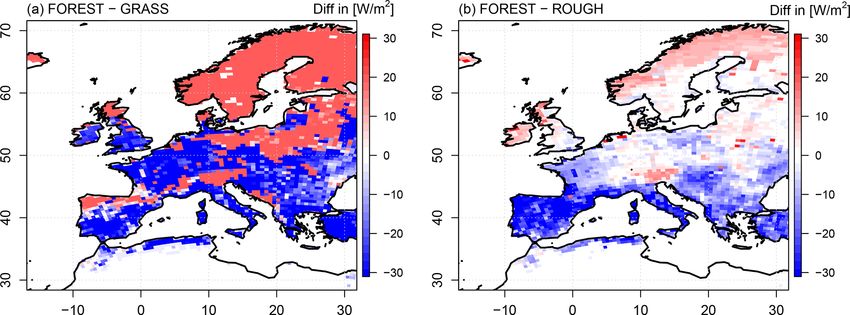
1502                                                                 M. Breil et al.: Evapotranspiration response to afforestation

                                                                        3     Results

                                                                        3.1    Evapotranspiration

                                                                        In southern and central Europe, evapotranspiration is reduced
                                                                        in the FOREST run compared to the GRASS simulation
                                                                        (Fig. 2a). The evapotranspiration reduction in FOREST is
                                                                        in this context particularly strong in southern Europe, but in
                                                                        northern Europe, the opposite is the case, and evapotranspi-
                                                                        ration is increased in FOREST. In central Europe, regions
                                                                        with reduced evapotranspiration rates in FOREST coincide
                                                                        with regions covered by deciduous forest (Fig. 1). This in-
                                                                        dicates that differences in evapotranspiration rates between
Figure 1. Spatial distribution of the land use classes used in the      forests and grassland are affected by the prevailing forest
FOREST experiment.                                                      type in a region. Thus, the different vegetation characteris-
                                                                        tics (a–f ) of deciduous and coniferous forest must have an
                                                                        impact on the intensity of the evapotranspiration response to
in transpiration between forests and grasslands can be iso-             afforestation, but, since both forest types have lower resis-
lated and analyzed on a large scale which is not given in ob-           tance values (higher c values) than grasslands, both forest
servation studies. In this way, the mechanisms leading to the           types should also more strongly promote transpiration than
different transpiration responses to afforestation in European          grasslands, which seems to be in contradiction to the reduced
summer can be explored in detail.                                       evapotranspiration rates of deciduous forests in central Eu-
   In FOREST, two different forest types are used (conifer-             rope. Therefore, the resistance values of the different forest
ous and deciduous); in GRASS, only one grassland class is               types cannot solely explain the opposing transpiration sig-
applied. The spatial distribution of the two different forest           nals.
types in FOREST is illustrated in Fig. 1. Coniferous and de-               In general, differences in evapotranspiration rates are fre-
ciduous forest, as well as grassland, have different vegeta-            quently connected to differences in the soil water contents
tion characteristics, leading to different transpiration rates,         and thus differences in the amount of available water for
as already described in Sect. 2.1. The vegetation parameters            evapotranspiration, but due to their deeper roots, forests have
used for each land use class are summarized in Table 2. The             access to a larger amount of available soil water than grass-
study is embedded in the LUCAS initiative (Rechid et at.,               lands (Fig. 3a) so that the drought stress in summer is lower
2017). The model domain is the Coordinated Downscaling                  in the FOREST simulation than in the GRASS run. The re-
Experiment – European Domain (EURO-CORDEX; Jacob et                     duced evapotranspiration rates in central and southern Eu-
al., 2014) at a horizontal resolution of 0.44◦ (∼ 50 km). The           rope in FOREST can consequently not be caused by lower
simulations were driven by ERA-Interim reanalyses (Dee et               soil water contents.
al., 2011) at the lateral boundaries and at the lower boundary             Furthermore, by means of differences in the soil water
over sea. The simulation period is 1986–2015. A spin-up of 6            content, the contribution of transpiration and soil evapora-
years was performed before 1986.                                        tion to total evapotranspiration can be indirectly assessed.
   To be able to better distinguish between the effects of              Fig. 3b–d show the differences in soil water contents be-
ra and rc on the respective transpiration fluxes, an addi-              tween the FOREST simulation and the GRASS run for dif-
tional sensitivity run with the FOREST setup is performed               ferent soil depths. Differences in the upper 5 cm of the soil
(ROUGH). In this simulation, the surface roughness of for-              (Fig. 3b) are used as an indicator for differences in the soil
est is replaced by the surface roughness of grassland. All the          evaporation since this process is executed through the soil
other vegetation parameters of forest, like albedo or LAI, re-          surface (although soil evaporation can also be affected by soil
mained unchanged. Since the surface roughness affects only              depths deeper than 5 cm). At a depth of 15 cm (Fig. 3c), the
ra and not rc , this sensitivity simulation gives the opportunity       maximum root density of grassland is located and at 75 cm
to draw conclusions about the impact of both resistances on             depth (Fig. 3d) that of forests. Thus, differences in these
the transpiration fluxes.                                               soil depths refer to the contribution of transpiration to to-
                                                                        tal evapotranspiration in each simulation. Just slight differ-
                                                                        ences occur between the FOREST and the GRASS simula-
                                                                        tions for the upper soil (Fig. 3b). This is because the upper
                                                                        soil layers are in both simulations almost completely dry in
                                                                        summer. The contribution of soil evaporation to total evapo-
                                                                        transpiration is therefore low in both simulations. This con-
                                                                        firms the proposed assumption at the beginning of the study

Biogeosciences, 18, 1499–1510, 2021                                                       https://doi.org/10.5194/bg-18-1499-2021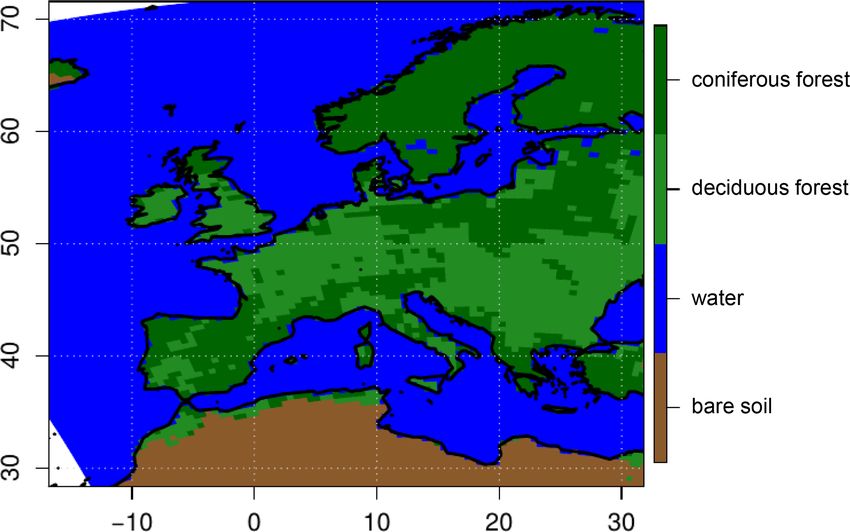
M. Breil et al.: Evapotranspiration response to afforestation                                                                      1503

Table 2. Vegetation parameters of the different land use classes in summer.

                                                  Albedo     LAI    rmin          Root depth         z0   cveg
                                                                              (density < 2 %)
                             Coniferous forest       0.11       9    120               1.0 m     1.0 m    1.75
                             Deciduous forest        0.15       8    120               2.0 m     0.8 m     2.1
                             Grassland                0.2       4    150               0.5 m    0.03 m     1.2

Figure 2. Differences in mean seasonal latent heat fluxes in summer between the FOREST and the GRASS experiments (a) and the FOREST
and the ROUGH experiments (b) over the simulation period 1986–2015.

(Sect. 2) that changes in total evapotranspiration in summer            3.2     Saturation deficit
are mainly associated with transpiration. At a depth of 15 cm,
almost all over Europe the soil is drier in the GRASS simula-           According to Eq. (1), the saturation deficit between the vege-
tion (Fig. 3c) since grassland extracts water for transpiration         tation and the atmosphere is the driving force of transpiration
mainly from this depth. The same applies to forest at 75 cm             which is regulated by the transfer coefficient c. In the FOR-
depth (Fig. 3d), but since forest is able, in contrast to grass-        EST simulation, this saturation deficit is reduced all over Eu-
land, to extract water from these deeper soil layers, the avail-        rope compared to the GRASS simulation (Fig. 4a). Thus, all
able soil water amount for transpiration in summer is higher            over Europe, the transpiration-facilitating vegetation charac-
in FOREST than in GRASS (Fig. 3a).                                      teristics of a forest are facing a reduced driving force of tran-
   The ROUGH sensitivity simulation, with its reduced sur-              spiration.
face roughness, provides the opportunity to additionally in-               In southern Europe, the reduction in the saturation deficit
vestigate the impact of the resistance part ra on the transpi-          is particularly pronounced. As a result, the reduced satura-
ration flux more precisely (Fig. 2b). In general, a reduced             tion deficit exceeds the impact of the increased transfer coef-
surface roughness reduces turbulent mixing, which is mani-              ficient in the transpiration flux calculation (Eq. 1), and evapo-
fested in an increased ra . According to Eq. (2), this reduces          transpiration is reduced. In northern Europe, on the contrary,
the transfer coefficient c, and transpiration is impeded. This          the reduction in the saturation deficit in the FOREST simu-
should consequently lead all over Europe to reduced transpi-            lation is less pronounced. As shown in Fig. 1, northern Eu-
ration rates in ROUGH, but this is only the case in northern            rope is completely covered by coniferous forest in the FOR-
Europe. In southern Europe and large parts of central Europe,           EST simulation. Coniferous forest has a high LAI and low
evapotranspiration is even increased compared to FOREST.                albedo values and thus low rc and high c values. In north-
Thus, the ROUGH simulation exhibits astonishingly com-                  ern Europe, a slightly reduced saturation deficit consequently
parable evapotranspiration patterns to the GRASS run and                faces a high transfer coefficient. This higher transfer coeffi-
does not behave anymore like a forest simulation. Since an              cient therefore exceeds the impact of the reduced saturation
increase in ra should have an opposite effect, its impact on            deficit in the flux calculation (Eq. 1), and evapotranspiration
the transpiration flux signal must be negligible, at least in           is increased. In central Europe, the saturation deficit in the
southern and central Europe, but the generally strong effects           FOREST run is comparable to northern Europe, but in con-
of the surface roughness change on evapotranspiration indi-             trast to northern Europe, regions of increased evapotranspi-
cates that surface roughness is playing a major role in evap-           ration are simulated, as well as regions of reduced evapo-
otranspiration beyond its impact on ra .                                transpiration, compared to the GRASS simulation (Fig. 2a).
                                                                        As already mentioned in Sect. 3.1, the regions of increased
                                                                        evapotranspiration coincide with regions covered by conifer-

https://doi.org/10.5194/bg-18-1499-2021                                                          Biogeosciences, 18, 1499–1510, 2021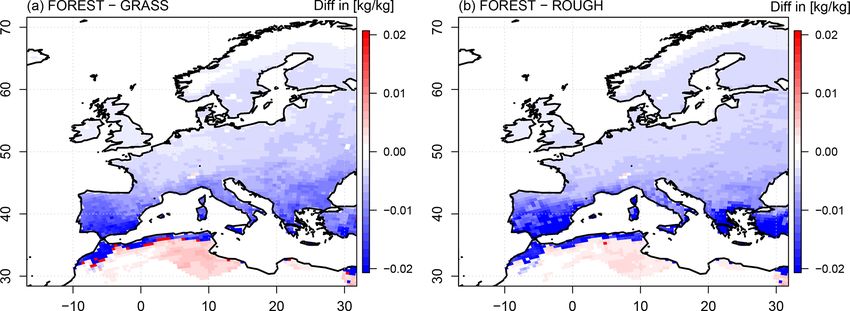
1504                                                                   M. Breil et al.: Evapotranspiration response to afforestation

Figure 3. Differences between the FOREST and the GRASS experiments in summer for the available soil water amount for evapotranspira-
tion (soil water content – residual soil water content) within the rooted soil column (a), in the upper soil layers (until 5 cm depth) (b), at a
soil depth of 15 cm (c), at a soil depth of 75 cm (d) and over the simulation period 1986–2015.

Figure 4. Differences in mean saturation deficit (in kilograms water vapor per kilogram wet air) between the vegetation and the atmosphere
in summer between the FOREST and the GRASS experiments (a) and the FOREST and the ROUGH experiments (b) over the simulation
period 1986–2015. The saturation deficit is calculated for the daily maximum surface temperature (top of vegetation).

ous forests, while regions of reduced evapotranspiration are              tics which lead to high c values. However, since evapotran-
covered by deciduous forests. Since the saturation deficit re-            spiration in central Europe is higher for coniferous forests
duction in the FOREST run is comparable for both forest                   than for deciduous forests, the impact of LAI and the albedo
types in central Europe (Fig. 4a), these different evapotran-             (pronounced in coniferous forests) on c must be higher than
spiration responses to afforestation must be associated with              the impact of the root depth and cveg (pronounced in decid-
differences in the transfer coefficient c (Eq. 1). The trans-             uous forests). As a result, the impact of the higher transfer
fer coefficient c of coniferous forest must therefore be higher           coefficient c of coniferous forests surpasses the effects of the
than the one of deciduous forest. In a coniferous forest, LAI             lower saturation deficit in central Europe in the transpiration
is increased, and albedo is reduced in comparison to a decid-             flux calculation, and evapotranspiration is increased, while
uous forest, while in a deciduous forest, the root depth and              for deciduous forests, the impact of the reduced saturation
cveg are increased. Thus, both forest types have characteris-             deficit is dominant, and evapotranspiration is reduced.

Biogeosciences, 18, 1499–1510, 2021                                                            https://doi.org/10.5194/bg-18-1499-2021
M. Breil et al.: Evapotranspiration response to afforestation 1505
As described in Sect. 3.1., surface roughness has only a Europe (Fig. 6d). Thus, the high radiative energy is not as ef-
minor impact on the extent of the transfer coefficient c, but ficiently transformed and transported into the atmosphere as
its effects on the humidity gradients are large. As shown in in FOREST with the consequence that the surface tempera-
Fig. 4b, the reduction in the surface roughness in the ROUGH tures are increased in a similar way to the GRASS simulation
simulation results in increased saturation deficits all over Eu- (Fig. 6c).
rope which are similar to the GRASS run. Thus, the sur- As described in Eq. (1), the saturation deficit between the
face roughness is the main driver for the different saturation surface and the atmosphere depends on the surface tempera-
deficits in FOREST and GRASS. The reasons for this sur- ture. Due to the increased surface roughness of a forest, this
face roughness effect on the saturation deficits are described surface temperature is reduced compared to grassland. As
in detail in the next section. a result, the saturation deficit of forests to the atmosphere
is lower than for grassland (Fig. 4a). Finally, this leads in
3.3 Effects of surface roughness southern and central Europe to a lower forest evapotranspira-
tion (Fig. 2a). Thus, the lower surface temperatures of forests
Differences in evapotranspiration as seen for the FOREST compared to grassland are there not as a result of evaporative
and GRASS runs (Fig. 2) inevitably affect the atmospheric cooling but of the increased surface roughness. These lower
conditions in these simulations. For instance, the increased surface temperatures then, in turn, even decrease forest evap-
evapotranspiration rates in northern Europe in FOREST lead otranspiration.
to an increased cloud cover in this region (Fig. 5a). The in-
coming solar radiation is consequently reduced in compari-
son to GRASS. However, since the albedo of the trees in the 4 Discussion and conclusions
FOREST simulation is lower than the albedo of grassland in
the GRASS run, the reduction in the incoming solar radiation In the framework of idealized regional climate simulations
is compensated for, and net shortwave radiation is slightly with CCLM-VEG3D for two extreme land use change sce-
increased in northern Europe (Fig. 5b). For the rest of the narios (FOREST and GRASS), diverging evapotranspiration
European continent, this albedo effect is even more strongly responses are simulated. In northern Europe, evapotranspira-
pronounced, and the net shortwave radiation is consider- tion is increased with afforestation; in southern and central
ably increased since cloud cover is not changed compared Europe, evapotranspiration is decreased. Especially the re-
to GRASS, but this increased radiative energy input does not duced forest evapotranspiration rates in southern and central
result in higher surface temperatures (Fig. 6a; since evapo- Europe are in contradiction to the prevailing scientific doc-
transpiration mainly takes place during the day, here and in trine that forest evapotranspiration is enhanced (e.g., Bonan,
the following, the daily maximum temperatures are consid- 2008) due to deeper roots (Schenk and Jackson, 2003) and a
ered). All over Europe, lower daily maximum surface tem- higher leaf area index (Henderson-Sellers, 1993) than grass-
peratures are simulated in FOREST than in GRASS. These land. However, these results qualitatively reflect the vary-
lower surface temperatures cannot be caused by an evapo- ing evapotranspiration rates of forests and grasslands in Eu-
rative cooling associated with increased latent heat fluxes, ropean summer, documented in numerous observations and
as generally supposed (e.g., Bonan, 2008), since at least in modeling studies (Zhang et al., 2001; Williams et al., 2012;
southern and central Europe, evapotranspiration is reduced in Davin et al., 2020).
FOREST (Fig. 2a). As stated by Breil et al. (2020), the lower Climate simulations with incorporated land surface mod-
surface temperatures in FOREST are mainly caused by in- els (LSMs) are an appropriate method to analyze the rea-
creased sensible heat fluxes all over Europe (Fig. 6b) which sons for these varying evapotranspiration rates of forests
transform and transport the increased energy input from the and grasslands. However, models constitute only a simpli-
net shortwave radiation into the atmosphere without increas- fied description of reality and thus cannot represent the com-
ing the surface temperature. plex biogeophysical processes in nature comprehensively.
These increased sensible heat fluxes are induced by the For instance, VEG3D does not consider the effects of the
higher surface roughness of a forest compared to grassland, multilayer canopy structure of trees (effects of shaded and
as demonstrated by the results of the ROUGH simulation unshaded leaves; Bonan et al., 2012) or the influence of
(Figs. 5c–d and 6c–d). Due to the increased evapotranspi- the understory on evapotranspiration rates which can con-
ration rates in ROUGH in northern Europe (Fig. 2b), cloud tribute substantially to total evapotranspiration in forests
cover is increased in this region in comparison to the FOR- (e.g., Yepez et al., 2003). Furthermore, VEG3D does not con-
EST run (Fig. 5c). The net shortwave radiation is conse- sider the impact of temperature and vapor pressure deficit
quently slightly reduced (Fig. 5d), but for the rest of the Eu- on stomata closure, but the results of model intercompar-
ropean continent, net shortwave radiation in FOREST and ison studies show that more sophisticated LSMs in which
ROUGH is at the same high level due to the unchanged these biogeophysical effects are integrated exhibit compara-
albedo values. The reduced surface roughness in ROUGH re- ble evapotranspiration responses to afforestation as VEG3D
duces the sensible heat transport into the atmosphere all over (e.g., de Noblet-Ducoudré et al., 2012; Davin et al., 2020).
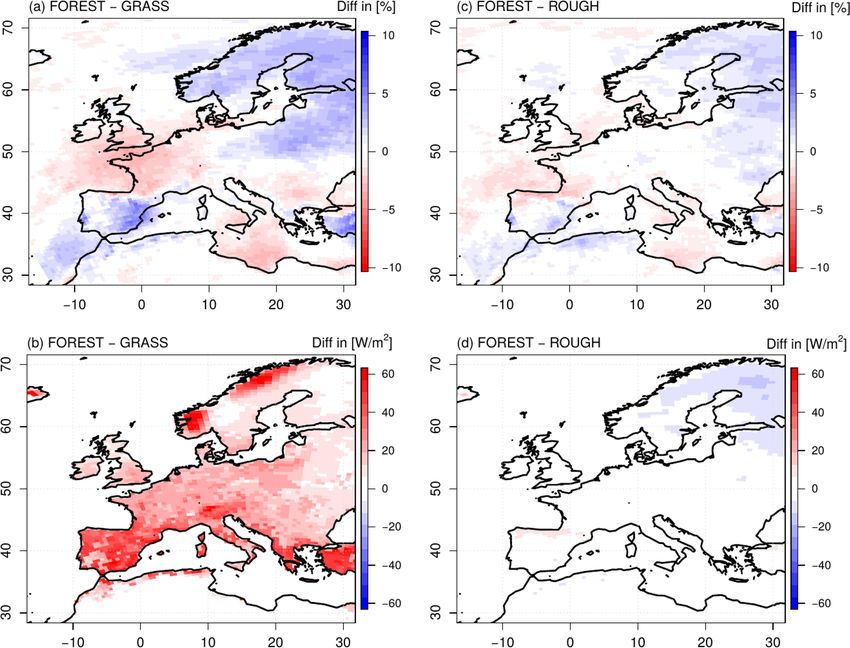
https://doi.org/10.5194/bg-18-1499-2021 Biogeosciences, 18, 1499–1510, 20211506 M. Breil et al.: Evapotranspiration response to afforestation Figure 5. Differences in mean seasonal cloud cover (a, c) and net shortwave radiation (b, d) in summer between the FOREST and the GRASS experiments (a–b) and the FOREST and the ROUGH experiments (c–d) over the simulation period 1986–2015. Figure 6. Differences in mean seasonal daily maximum surface (top of vegetation) temperature (a, c) and seasonal sensible heat fluxes (b, d) in summer between the FOREST and the GRASS experiments (a–b) and the FOREST and the ROUGH experiments (c–d) over the simulation period 1986–2015. Biogeosciences, 18, 1499–1510, 2021 https://doi.org/10.5194/bg-18-1499-2021
M. Breil et al.: Evapotranspiration response to afforestation                                                                  1507

For instance, in the framework of the LUCAS project, sim-          ulated reduction in evapotranspiration in the Mediterranean
ulations with the classic model VEG3D and the more so-             is not reflected by observations (e.g., Rohatyn et al., 2018).
phisticated Community Land Model under the same atmo-              One potential explanation for these deviations between the
spheric boundary conditions show similar spatial patterns of       CCLM-VEG3D model results and observations is the miss-
increased or reduced evapotranspiration rates with afforesta-      ing consideration of the summertime senescence of grass-
tion (Davin et al., 2020). Thus, the differences in the model      lands in Mediterranean regions and the associated reduction
complexity (effects of shaded and unshaded leaves or the va-       in grassland evapotranspiration (Ryu et al., 2008). Another
por pressure dependency of stomata closure) cannot be the          possible reason for the disagreement between the simula-
main reason for the simulated differences in evapotranspi-         tion results and the observations is the missing considera-
ration responses in forests and grasslands. These different        tion of vapor pressure effects on the stomatal resistance in
evapotranspiration responses must rather be caused by a fun-       CCLM-VEG3D. For instance, in southern Europe, the satu-
damental mechanism, which is simulated in both classic and         ration deficit of forests is particularly lower than for grass-
complex LSMs. In order to get to the bottom of these funda-        land. In contrast to the simulated trees in CCLM-VEG3D,
mental processes, the use of a less complex model can even         real trees are potentially able to adapt to this lower satura-
be beneficial. In such a model, the degrees of freedom are         tion deficit by further reducing the stomatal closure and thus
reduced, and functional interrelations can consequently be         the transfer coefficient. In line with the introduced evapo-
deduced more easily. Therefore, by means of a sensitivity          transpiration concept, the transpiration-facilitating character-
study with this less complex CCLM-VEG3D model in which             istics of forests (2) would be further enhanced, counteracting
the surface roughness of forests was reduced to grassland          the reduced saturation deficit (1) in southern Europe, and thus
(ROUGH), this fundamental mechanisms behind the vary-              would increase forest evapotranspiration.
ing evapotranspiration rates of forests and grasslands could          On the other hand, the simulation results show that the bal-
be clearly revealed:                                               ance between factors (1) and (2) is differently pronounced
   Due to a higher surface roughness, the daily maximum sur-       for individual forest types. In central Europe, for instance,
face temperatures (top of the vegetation) of a forest are lower    deciduous and coniferous forests show opposing evapotran-
than of grassland (Breil et al., 2020). The saturation deficit     spiration responses to afforestation, although they are facing
between the vegetation and the atmosphere (1) which de-            a comparable saturation deficit (1). Differences in the evapo-
pends on these surface temperatures (Eq. 1) is consequently        transpiration rates must consequently be associated with dif-
reduced and counteracts the transpiration-facilitating charac-     ferences in the transfer coefficients (2). A deciduous forest,
teristics of a forest (2), high transfer coefficient due to deep   for instance, has a lower LAI and higher albedo values than
roots, high LAI and low albedo. Therefore, the question of         a coniferous forest (Table 2). The transfer coefficient is con-
whether forests or grasslands transpire more water depends         sequently lower, and factor (2) is becoming weaker. The im-
on the balance between the two factors (1) and (2).                pact of the saturation deficit (1) is therefore dominating the
   The simulation results show that the interplay of these two     effects of factor (2), and the transpiration rates of deciduous
forces depends, on the one hand, on the latitude. In south-        forests are reduced compared to grassland in central Europe,
ern Europe with its intense solar radiation, the surface tem-      but for coniferous forest, which are facing a similar satura-
perature strongly increases if energy is not efficiently trans-    tion deficit (1), the impact of factor (2) is increased due to the
formed into sensible heat fluxes by turbulent processes. Due       higher LAI and lower albedo values. The transpiration rates
to its low surface roughness, grassland is not able to trans-      are consequently higher for coniferous forests in this region.
form the solar energy as efficiently as forests. The surface       These results are also in line with observation-based studies
temperature and thus also the saturation deficit (1) is con-       showing that evapotranspiration rates differ between differ-
sequently more strongly increased than for forest. The im-         ent forest types (e.g., Brown et al., 2005), whereby higher
pact of factor (1) therefore exceeds the effects of factor (2),    evapotranspiration rates are generally assigned to coniferous
and grassland transpiration is increased compared to forest.       forests (e.g., Teuling, 2018). Furthermore, Marc and Robin-
In northern Europe, on the contrary, the incoming solar ra-        son (2007) showed that also the age of the forest affects evap-
diation is lower. Thus, the surface temperature differences        otranspiration.
and saturation deficits between forest and grassland (1) are          In this study, only the results of model simulations are
not as pronounced as in the southern parts of Europe. The          presented which obviously depend on the used parameteriza-
impact of factor (2) surpasses consequently the effects of         tions and parameters. In the specific CCLM-VEG3D setup,
factor (1), and forest transpiration is increased compared to      for instance, only two different forest types (coniferous and
grassland. The dependency of the evapotranspiration rates of       deciduous) are applied, which might not completely repre-
forests and grasslands on the latitude is also documented in       sent the whole variety of European forests. Generalizations,
satellite observations (e.g., Li et al., 2015). In this context,   as well as under- or overestimations of certain physical pro-
the simulated increase in evapotranspiration with afforesta-       cesses, can result locally. Therefore, this study does not claim
tion for large parts of central and northern Europe is in line     for general validity. The transpiration rates of forests and
with observations (e.g., Duveiller et al., 2018), while the sim-   grasslands depend on the weighting of the respective factors

https://doi.org/10.5194/bg-18-1499-2021                                                    Biogeosciences, 18, 1499–1510, 2021
1508                                                                M. Breil et al.: Evapotranspiration response to afforestation

(1) and (2). Since this weighting is model-specific, slightly          Competing interests. The authors declare that they have no conflict
different evapotranspiration responses in forests and grass-           of interest.
lands are anticipated for different model simulations. More-
over, different evapotranspiration responses can also be ex-
pected within observational data since the biogeophysical              Acknowledgements. LUCAS is supported by WCRP CORDEX
characteristics of forests and grasslands vary also in nature          as a Flagship Pilot Study. Marcus Breil acknowledges fund-
(Garratt, 1993; Henderson-Sellers, 1993; Schenk and Jack-              ing from the Federal Ministry of Education and Research in
                                                                       Germany (BMBF) under the ClimXtreme research program.
son, 2003). Taking these uncertainties into account, differ-
                                                                       Edouard L. Davin acknowledges support from the Swiss National
ences between the CCLM-VEG3D results and observations,
                                                                       Science Foundation (SNSF) through the CLIMPULSE project. All
as present in southern Europe (Rohatyn et al., 2018), can po-          simulations were performed at the German Climate Computing
tentially be explained.                                                Center (DKRZ). Marcus Breil acknowledges support from the KIT
   However, it is generally difficult to assess the effects of         Publication Fund of the Karlsruhe Institute of Technology.
afforestation by a direct comparison of the CCLM-VEG3D
model results with observational data due to discrepancies
on the scale of processes considered in models and obser-              Financial support. The article processing charges for this open-
vations (Davin et al., 2020). In observational data (satel-            access publication were covered by a Research Centre of the
lite data, as well as data from eddy covariance flux tow-              Helmholtz Association.
ers), forests and grasslands in immediate vicinity are com-
pared. Differences in the measured fluxes are therefore di-
rectly related to the local land cover differences (Bright et          Review statement. This paper was edited by Christopher Still and
al., 2017). In contrast, differences in model results for forests      reviewed by two anonymous referees.
and grasslands are additionally affected by large-scale atmo-
spheric feedback processes (Winckler et al., 2017). There-
fore, it is difficult to assess the CCLM-VEG3D model re-
sults quantitatively and qualitatively in comparison to ob-            References
servations. Thus, with this study, the question of whether in
                                                                       Bonan, G. B.: Forests and climate change: forcings, feedbacks, and
specific regions observation-based studies are correct which
                                                                         the climate benefits of forests, Science, 320, 1444–1449, 2008.
show higher evapotranspiration rates of forests (e.g., Zhang
                                                                       Bonan, G. B., Oleson, K. W., Fisher, R. A., Lasslop, G., and Reich-
et al., 2001; Li et al., 2015; Chen et al., 2018; Duveiller et           stein, M.: Reconciling leaf physiological traits and canopy flux
al., 2018) or studies which document the opposite behav-                 data: Use of the TRY and FLUXNET databases in the Commu-
ior is not intended to be answered (e.g., Wicke and Bern-                nity Land Model version 4, J. Geophys. Res.-Biogeosci., 117,
hofer, 1996; Teuling et al., 2010; Williams et al., 2012). In            2012.
this study, a mechanism is rather presented that explains how          Breil, M. and Schädler, G.: Quantification of the uncertainties in
these different transpiration responses in forests and grass-            soil and vegetation parameterizations for regional climate simu-
lands can generally evolve in Europe and by which factors                lations in Europe, J. Hydrometeorol., 18, 1535–1548, 2017.
they are controlled. In this context, especially an explana-           Breil, M., Rechid, D., Davin, E. L., de Noblet-Ducoudré, N., Ka-
tion for the hardly comprehensibly lower evapotranspiration              tragkou, E., Cardoso, R. M., Hoffmann, P., Jach, L. L., Soares, P.
                                                                         M. M., Sofiadis, G., Strada, S., Strandberg, G., Tölle, M. H., and
rates of forests during summer can be provided in a physi-
                                                                         Warrach-Sagi, K.: The Opposing Effects of Reforestation and
cally consistent way.
                                                                         Afforestation on the Diurnal Temperature Cycle at the Surface
                                                                         and in the Lowest Atmospheric Model Level in the European
                                                                         Summer, J. Climate, 33, 9159–9179, 2020.
Code availability. The coupled version of COSMO-CLM and                Bright, R. M., Davin, E., O’Halloran, T., Pongratz, J., Zhao, K., and
VEG3D is available upon request from Marcus Breil.                       Cescatti, A.: Local temperature response to land cover and man-
                                                                         agement change driven by non-radiative processes, Nat. Clim.
                                                                         Change, 7, 296–302, 2017.
Data availability. CCLM-VEG3D data presented in the paper can          Brown, A. E., Zhang, L., McMahon, T. A., Western, A. W., and
be accessed by contacting Marcus Breil. The data will be archived        Vertessy, R. A.: A review of paired catchment studies for deter-
at the DKRZ (German Climate Computing Centre). ERA-Interim               mining changes in water yield resulting from alterations in vege-
boundary conditions can be obtained at https://apps.ecmwf.int/           tation, J. Hydrol., 310, 28–61, 2005.
datasets/data/interim-full-daily/ (ECMWF, 2021).                       Businger, J. A., Wyngaard, J. C., Izumi, Y., and Bradley, E. F.: Flux-
                                                                         Profile Relationships in the Atmospheric Surface Layer, J. At-
                                                                         mos. Sci., 28, 181–189, 1971.
Author contributions. MB designed the study and performed the          Chen, L., Dirmeyer, P. A., Guo, Z., and Schultz, N. M.: Pair-
model simulations and analysis. All authors (MB, ELD and DR)             ing FLUXNET sites to validate model representations of land-
contributed to writing and revising the paper.                           use/land-cover change, Hydrol. Earth Syst. Sci., 22, 111–125,
                                                                         https://doi.org/10.5194/hess-22-111-2018, 2018.

Biogeosciences, 18, 1499–1510, 2021                                                        https://doi.org/10.5194/bg-18-1499-2021
M. Breil et al.: Evapotranspiration response to afforestation 1509 Davin, E. L., Rechid, D., Breil, M., Cardoso, R. M., Coppola, E., Jacob, D., Petersen, J., Eggert, B., Alias, A., Christensen, O. B., Hoffmann, P., Jach, L. L., Katragkou, E., de Noblet-Ducoudré, Bouwer, L. M., Braun, A., Colette, A., Deque, M., Georgievski, N., Radtke, K., Raffa, M., Soares, P. M. M., Sofiadis, G., G., Georgopoulou, E., Gobiet, A., Menut, L., Nikulin, G., Strada, S., Strandberg, G., Tölle, M. H., Warrach-Sagi, K., and Haensler, A., Hempelmann, N., Jones, C., Keuler, K., Kovats, S., Wulfmeyer, V.: Biogeophysical impacts of forestation in Eu- Kröner, N, Kotlarski, S., Kriegsmann, A., Martin, E., van Mei- rope: first results from the LUCAS (Land Use and Climate jgaard, E., Moseley, C., Pfeifer, S., Preuschmann, S., Raderma- Across Scales) regional climate model intercomparison, Earth cher, C., Radtke, K., Rechid, D., Rounsevell, M., Samuelsson, Syst. Dynam., 11, 183–200, https://doi.org/10.5194/esd-11-183- P., Somot, S., Soussana, J.-F., Teichmann, C., Valentini, R., Vau- 2020, 2020. tard, R., Weber, B., and Yiou, P.: EURO-CORDEX: new high- Deardorff, J. W.: Efficient prediction of ground surface temperature resolution climate change projections for European impact re- and moisture, with inclusion of a layer of vegetation, J. Geophys. search, Reg. Environ. Change, 14, 563–578, 2014. Res.-Oceans, 83, 1889–1903, 1978. Lejeune, Q., Seneviratne, S. I., and Davin, E. L.: Historical land- Dee, D. P., Uppala, S. M., Simmons, A. J., Berrisford, P., Poli, cover change impacts on climate: comparative assessment of LU- P., Kobayashi, S., Andrae, U., Balmaseda, M. A., Balsamo, G., CID and CMIP5 multimodel experiments, J. Climate, 30, 1439– Bauer, P., Bechtold, P., Beljaars, A. C. M., van de Berg, L., Bid- 1459, 2017. lot, J., Bormann, N., Delsol, C., Dragani, R., Fuentes, M., Geer, Leuzinger, S., Zotz, G., Asshoff, R., and Körner, C.: Responses of A. J., Haimberger, L., Healy, S. B., Hersbach, H., Holm, E. V., deciduous forest trees to severe drought in Central Europe, Tree Isaksen, L., Kallberg, P., Köhler, M., Matricardi, M., McNally, Physiol., 25, 641–650, 2005. A. P., Monge-Sanz, B. M., Morcrette, J.-J., Park, B.-K., Peubey, Li, Y., Zhao, M., Motesharrei, S., Mu, Q., Kalnay, E., and Li, S.: C., de Rosnay P., Tavolato, C., Thepaut, J.-N., and Vitart, F.: The Local cooling and warming effects of forests based on satellite ERA-Interim reanalysis: Configuration and performance of the observations, Nat. Commun., 6, 1–8, 2015. data assimilation system, Q. J. R. Meteorol. Soc., 137, 553–597, Marc, V. and Robinson, M.: The long-term water balance (1972– 2011. 2004) of upland forestry and grassland at Plynlimon, mid-Wales, de Noblet-Ducoudré, Boissier, J.-P., Pitman, A., Bonan, G. B., Hydrol. Earth Syst. Sci., 11, 44–60, https://doi.org/10.5194/hess- Brovkin, V., Cruz, F., Delire, C., Gayler, V., van den Hurk, B., 11-44-2007, 2007. Lawrence, P. J., van der Mollen, M. K., Müller, C., Reick, C. H., Meier, R., Davin, E. L., Lejeune, Q., Hauser, M., Li, Y., Martens, B., Strengers, B. J., and Voldoire, A.: Determining robust impacts Schultz, N. M., Sterling, S., and Thiery, W.: Evaluating and im- of land-use-induced land cover changes on surface climate over proving the Community Land Model’s sensitivity to land cover, North America and Eurasia: results from the first set of LUCID Biogeosciences, 15, 4731–4757, https://doi.org/10.5194/bg-15- experiments, J. Climate, 25, 3261–3281, 2012. 4731-2018, 2018. ECMWF: ERA Interim, Daily, available at: https://apps.ecmwf.int/ Monin, A. and Obukhov, A.: Basic laws of turbulent mixing in the datasets/data/interim-full-daily/, last access: 22 February 2021. surface layer of the atmosphere, Contrib. Geophys. Inst. Acad. Duveiller, G., Hooker, J., and Cescatti, A.: The mark of vegetation Sci, USSR, 151, 163–187, 1954. change on Earth’s surface energy balance, Nat. Commun., 9, 1– Niu, G. Y., Yang, Z.-L., Mitchell, K. E., Chen, F., Ek, 12, 2018. M. B., Barlage, M., Kumar, A., Manning, K., Niyogi, Garratt, J. R.: Sensitivity of climate simulations to land-surface and D., Rosero, E., Tewari, M., and Xia, Y.: The community atmospheric boundary-layer treatments-a review, J. Climate, 6, Noah land surface model with multiparameterization options 419–448, 1993. (Noah-MP): 1. Model description and evaluation with local- Goudriaan, J.: Crop micrometeorology: a simulation study (Doc- scale measurements, J. Geophys. Res.-Atmos., 116, D12109, toral dissertation, Pudoc), Wageningen, 1977. https://doi.org/10.1029/2010JD015139, 2011. Harper, A. B., Powell, T., Cox, P. M., House, J., Huntingford, C., Oleson, K. W., Lawrence, D. M., Bonan, G. B., Drewniak, B., Lenton, T. M., Sitch, S., Burke, E., Chadburn, S. E., Collins, W. Huang, M., Koven, C. D., Levis, S., Li, F., Riley, W. J., Subin, Z. J., Comyn-Platt, E., Daioglou, V., Doelman, J. C., Hayman, G., M., Swenson, S. C., and Thornton, P. E.: Technical description Robertson, E., van Vuuren, D., Wiltshire, A., Webber, C. P., Bas- of version 4.5 of the Community Land Model (CLM), Boulder, tos, A., Boysen, L., Ciais, P., Devaraju, N., Jain, A. K., Krause, CO, 420 pp., 2013. A., Poulter, B., and Shu, S.: Land-use emissions play a criti- Rechid, D., E. Davin, N. de Noblet-Ducoudré, and E. Katragkou: cal role in land-based mitigation for Paris climate targets, Nat. CORDEX Flagship Pilot Study LUCAS - Land Use & Climate Commun., 9, 2938, https://doi.org/10.1038/s41467-018-05340- Across Scales – a new initiative on coordinated regional land use z, 2018. change and climate experiments for Europe, EGU General As- Henderson-Sellers, A.: A factorial assessment of the sensitivity of sembly 2017, Vienna, Austria, 23–28 April 2017, 13172, 2017. the BATS land-surface parameterization scheme, J. Climate, 6, Rockel, B., A. Will, and A. Hense: The regional climate model 227–247, 1993. COSMO-CLM (CCLM), Meteorol. Z., 17, 347–348, 2008. Intergovernmental Panel on Climate Change: Climate change and Roe, S., Streck, C., Obersteiner, M., Frank, S., Griscom, B., Drouet, land: an IPCC special report on climate change, desertifica- L., Fricko, O., Gusti, M., Harris, N., Hasegawa, T., Hausfather, tion, land degradation, sustainable land management, food se- Z., Havlík, P., House, J., Nabuurs, G.-J., Popp, A., Sanz Sánchez, curity, and greenhouse gas fluxes in terrestrial ecosystems, avail- M. J., Sanderman, J., Smith, P., Stehfest, E., and Lawrence, D.: able at: https://www.ipcc.ch/report/srccl/ (last access: 22 Febru- Contribution of the land sector to a 1.5◦ C world, Nat. Clim. ary 2021), 2019. Change, 1–12, 2019. https://doi.org/10.5194/bg-18-1499-2021 Biogeosciences, 18, 1499–1510, 2021
1510                                                                      M. Breil et al.: Evapotranspiration response to afforestation

Rohatyn, S., Rotenberg, E., Ramati, E., Tatarinov, F., Tas, E., and          Von Randow, C., Manzi, A. O., Kruijt, B., de Oliveira, P. J., Zanchi,
  Yakir, D.: Differential impacts of land use and precipitation on             F. B., Silva, R. L., Hodnett, M. G., Gash, J. H. C., Elbers, J.
  “ecosystem water yield”, Water Resour. Res., 54, 5457–5470,                  A., Waterloo, M. J., Cardoso, F. L., and Kabat, P.: Comparative
  2018.                                                                        measurements and seasonal variations in energy and carbon ex-
Ryu, Y., Baldocchi, D. D., Ma, S., and Hehn, T.: Interannual vari-             change over forest and pasture in South West Amazonia, Theor.
  ability of evapotranspiration and energy exchange over an annual             Appl. Climatol., 8, 5–26, 2004.
  grassland in California, J. Geophys. Res.-Atmos., 113, D09104,             Wicke, W. and Bernhofer, C.: Energy balance comparison of the
  https://doi.org/10.1029/2007JD009263, 2008.                                  Hartheim forest and an adjacent grassland site during the HartX
Schenk, H. J. and Jackson, R. B.: Global distribution of root profiles         experiment. Theor. Appl. Climatol., 53, 49–58, 1996.
  in terrestrial ecosystems, Data set, Oak Ridge National Labora-            Williams, D., Reichstein, M., Buchmann, N., Baldocchi, D.,
  tory Distributed Active Archive Center, Oak Ridge, TN, USA),                 Beer, C., Schwalm, C., Wohlfahrt, G., Hasler, N., Bernhofer,
  2003. https://doi.org/10.3334/ORNLDAAC/660, 2003.                            C., Foken, T., Papale, D., Schymanski, T., and Schaefer, K.:
Sonntag, S., Pongratz, J., Reick, C. H., and Schmidt, H.: Reforesta-           Climate and vegetation controls on the surface water bal-
  tion in a high-CO2 world–Higher mitigation potential than ex-                ance: Synthesis of evapotranspiration measured across a global
  pected, lower adaptation potential than hoped for, Geophys. Res.             network of flux towers, Water Resour. Res., 48, W06523,
  Lett., 43, 6546–6553, 2016.                                                  https://doi.org/10.1029/2011WR011586, 2012.
Taconet, O., Bernard, R., and Vidal-Madjar, D.: Evapotranspira-              Winckler, J., Reick, C. H., and Pongratz, J.: Robust identification
  tion over an agricultural region using a surface flux/temperature            of local biogeophysical effects of land-cover change in a global
  model based on NOAA-AVHRR data, J. Clim. Appl. Meteorol.,                    climate model, J. Climate, 30, 1159–1176, 2017.
  25, 284–307, 1986.                                                         Yepez, E. A., Williams, D. G., Scott, R. L., and Lin, G.: Partition-
Teuling, A. J.: A forest evapotranspiration paradox inves-                     ing overstory and understory evapotranspiration in a semiarid sa-
  tigated using lysimeter data, Vadose Zone J., 17, 1–7,                       vanna woodland from the isotopic composition of water vapor,
  https://doi.org/10.2136/vzj2017.01.0031, 2018.                               Agr. Forest Meteorol., 119, 53–68, 2003.
Teuling, A. J., Seneviratne, S. I., Stöckli, R., Reichstein, M., Moors,      Zhang, L., Dawes, W. R., and Walker, G. R.: Response of mean an-
  E., Ciais, P., Luyssaert, S., van den Hurk, B., Ammann, C., Bern-            nual evapotranspiration to vegetation changes at catchment scale,
  hofer, C., Dellwik, E., Gianelle, D., Gielen, B., Grünwald, T.,              Water Resour. Res., 37, 701–708, 2001.
  Klumpp, K., Montagnani, L., Moureaux, C., Sottocornola, M.,
  and Wohlfahrt, G.: Contrasting response of European forest and
  grassland energy exchange to heatwaves, Nat. Geosci., 3, 722–
  727, 2010.

Biogeosciences, 18, 1499–1510, 2021                                                              https://doi.org/10.5194/bg-18-1499-2021
You can also read